
Detail Information of Disease-specific Protein Abundances
| General Information of Drug Transporter (DT) | |||||
|---|---|---|---|---|---|
| DT ID | DTD0532 Transporter Info | ||||
| Gene Name | KCNT1 | ||||
| Protien Name | Potassium channel subfamily T member 1 | ||||
| Gene ID | |||||
| UniProt ID | |||||
| Disease-specific Protein Abundances of DT (DPAD) | |||||
|---|---|---|---|---|---|
| ICD-11: 01 Certain infectious or parasitic disease | |||||
| [+] ICD-11: 1E50.1 Acute hepatitis B (viral hepatitis B) | Click to Show/Hide the Full List | ||||
| The Studied Tissue | Liver | ||||
| The Specified Disease | Hepatitis b virus infection [ICD-11:1E50.1] | ||||
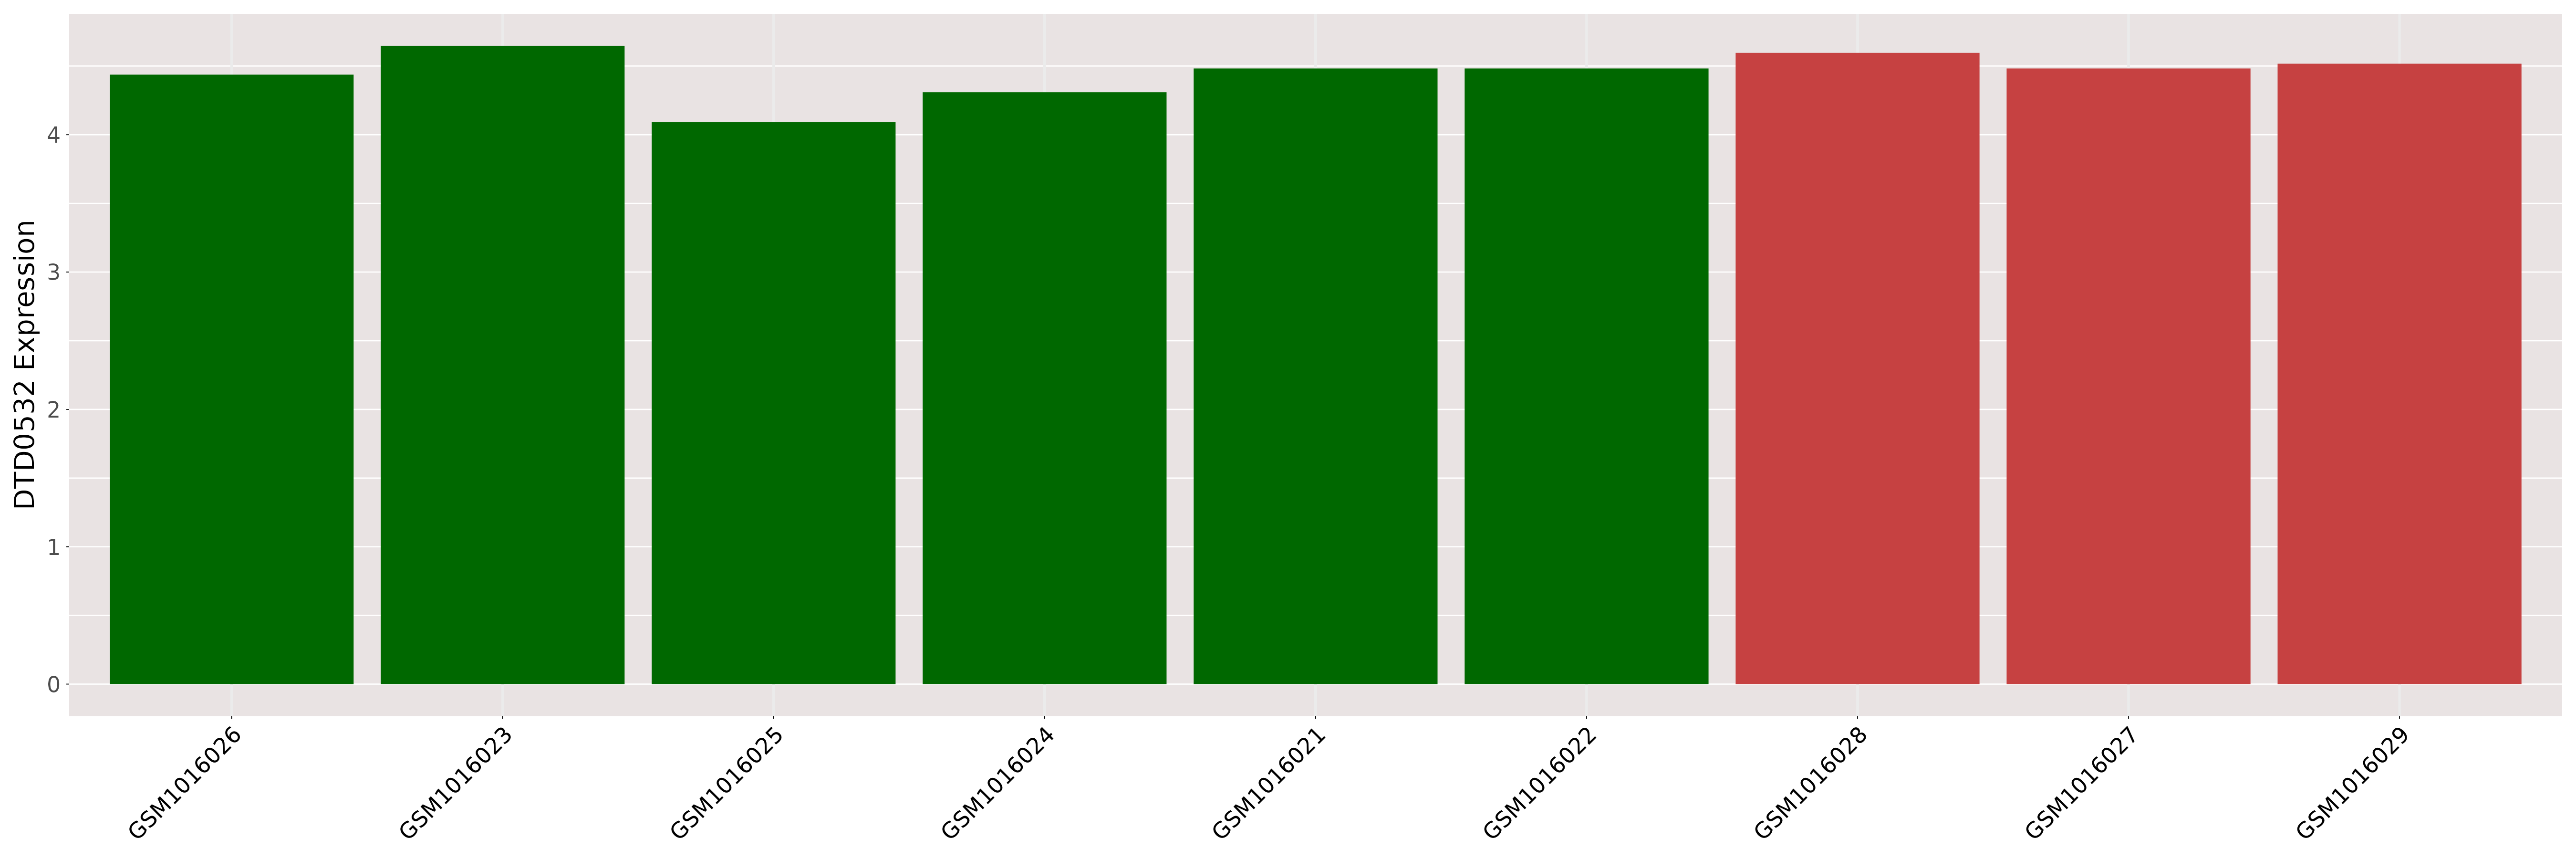
| The Expression Level of Disease Section Compare with the Healthy Individual Tissue | p-value:0.9914477943553472; Fold-change:1.0195944896687583; Z-score:-0.004950748 | ||||
|
Please Click the above Thumbnail to View/Download the Expression Barchart for All Samples | ||||
| ICD-11: 02 Neoplasm | |||||
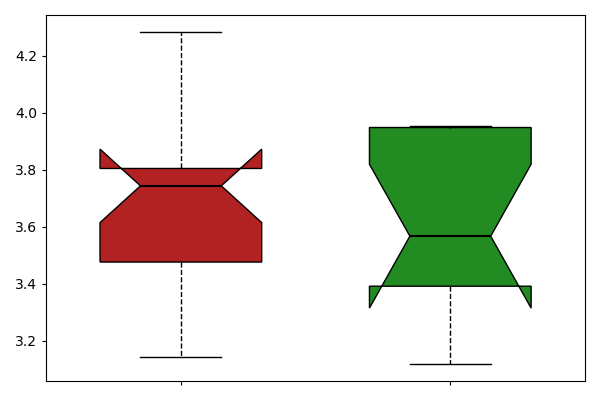
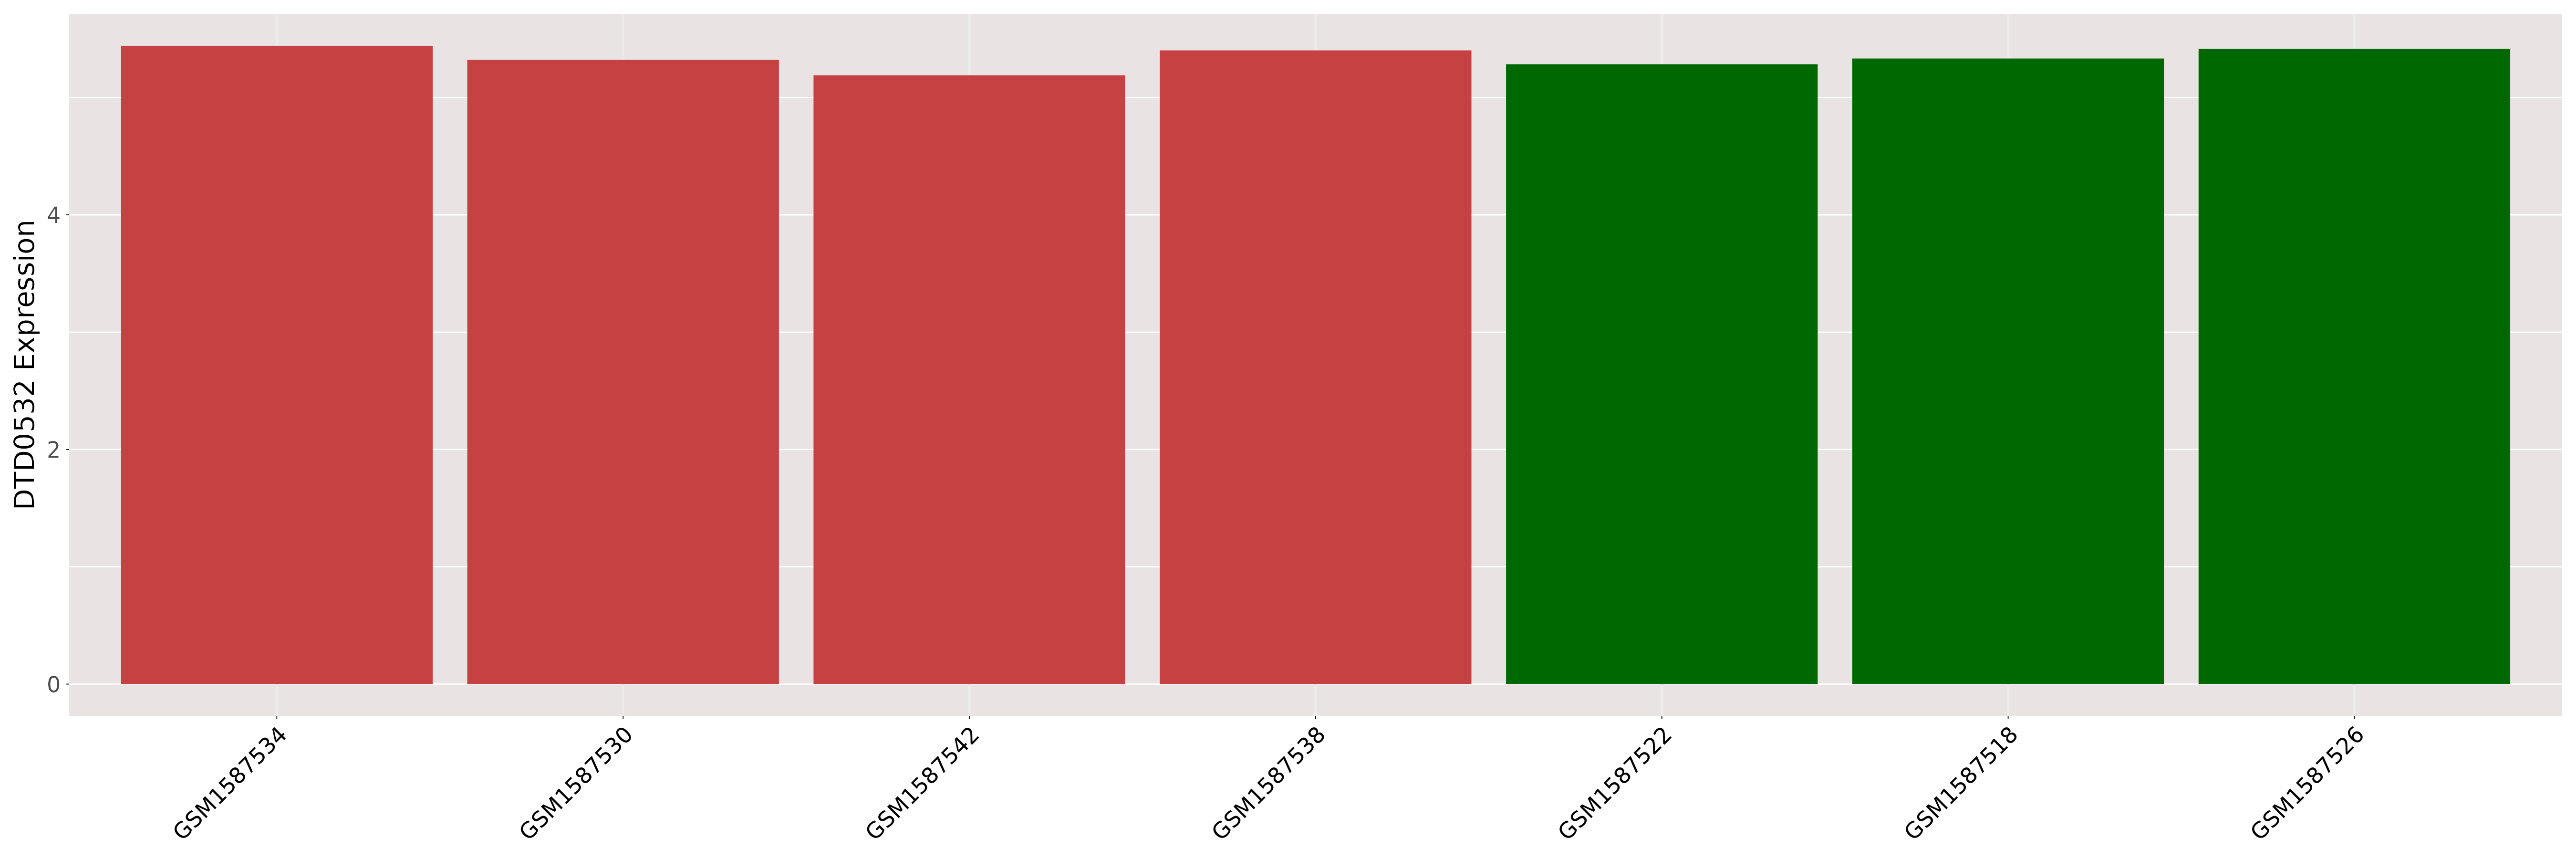
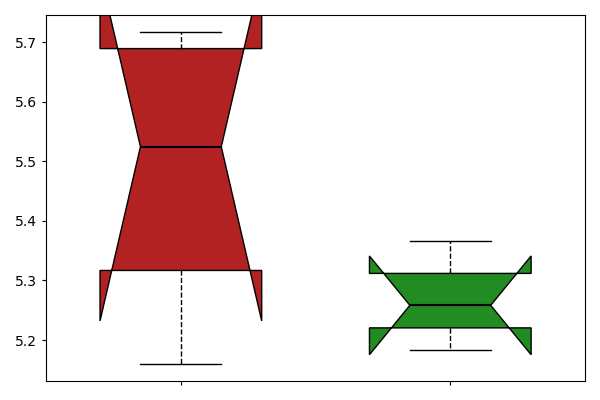
| [+] ICD-11: 2A00.0Y Ependymoma (other specified primary brain neoplasm) | Click to Show/Hide the Full List | ||||
| The Studied Tissue | Brain | ||||
| The Specified Disease | Ependymoma [ICD-11:2A00.0Y] | ||||
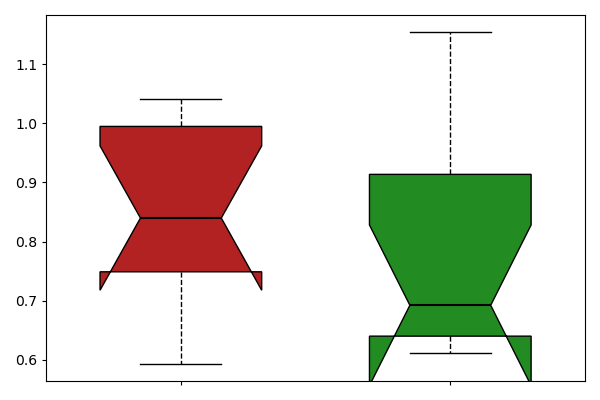
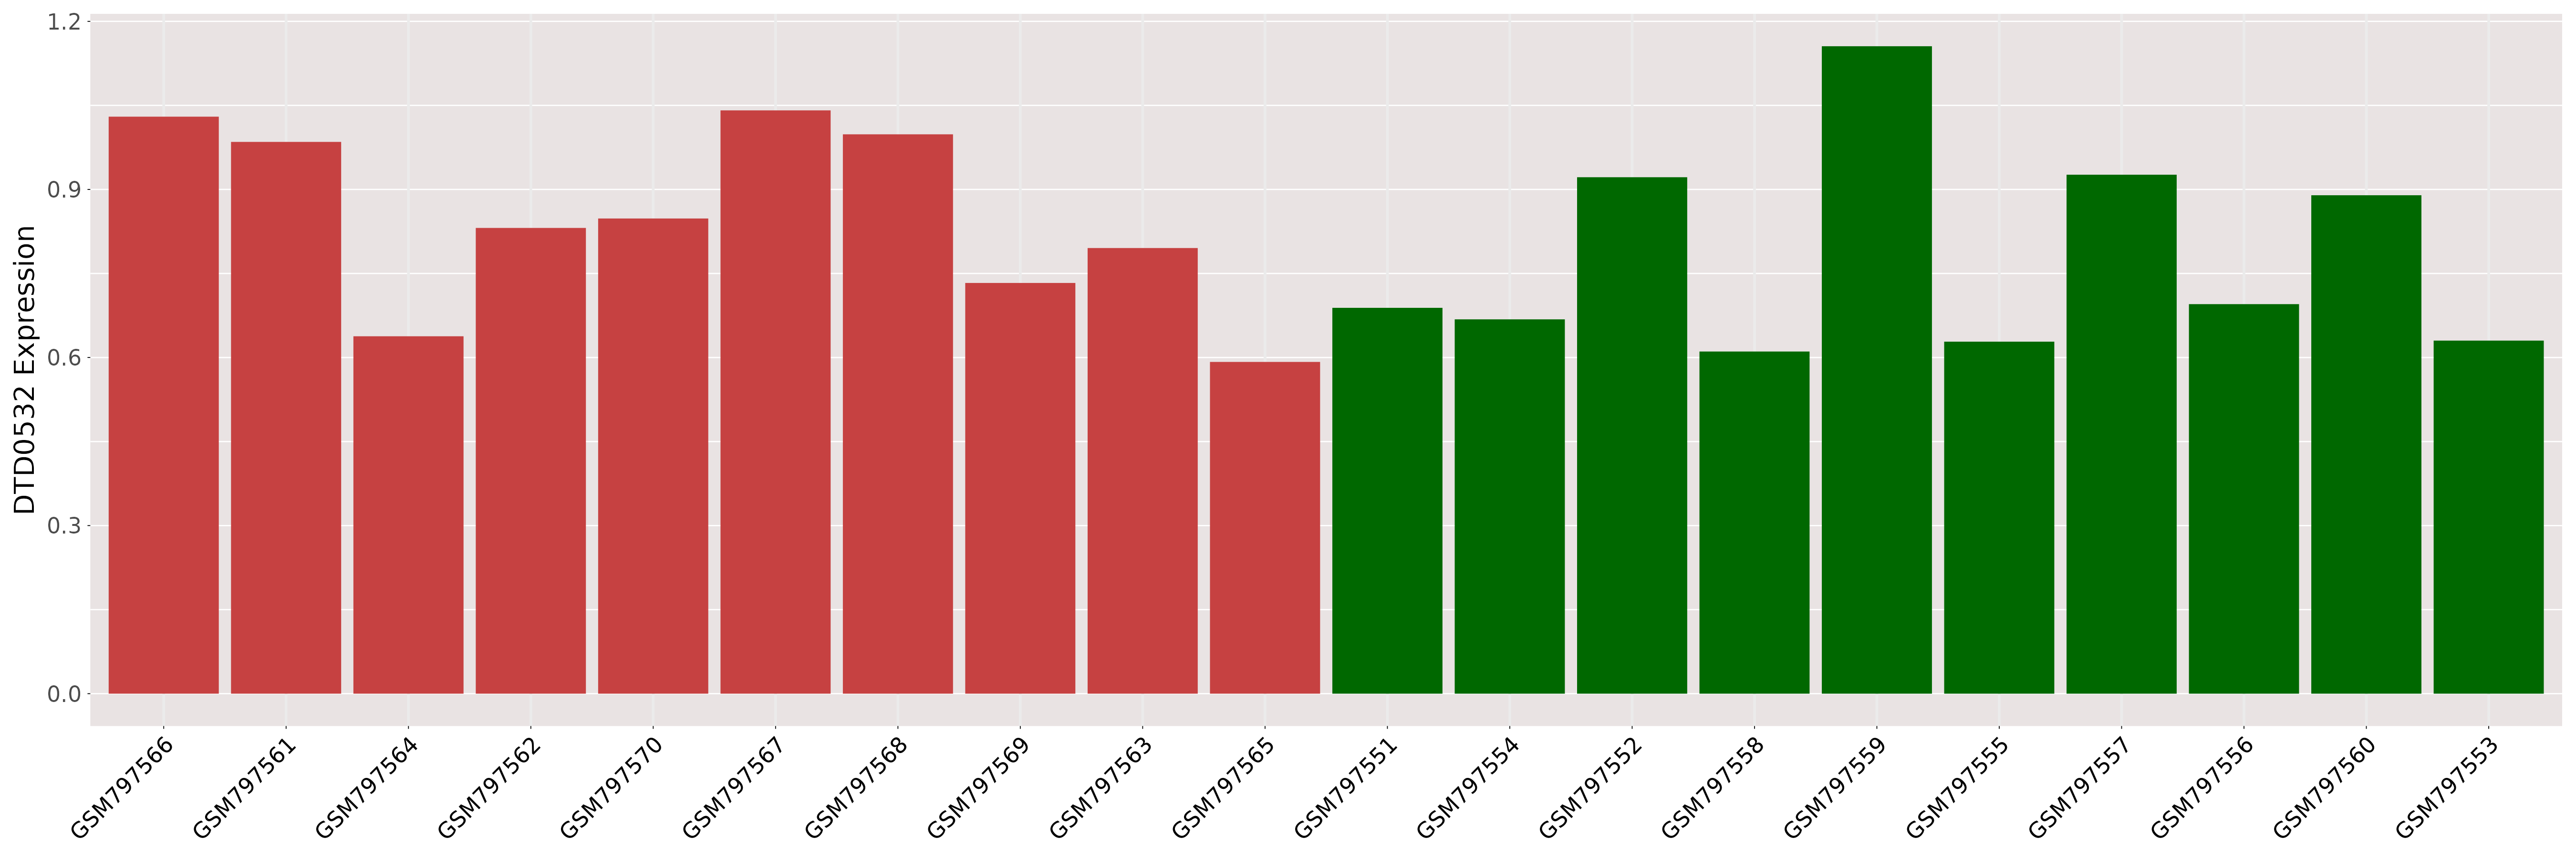
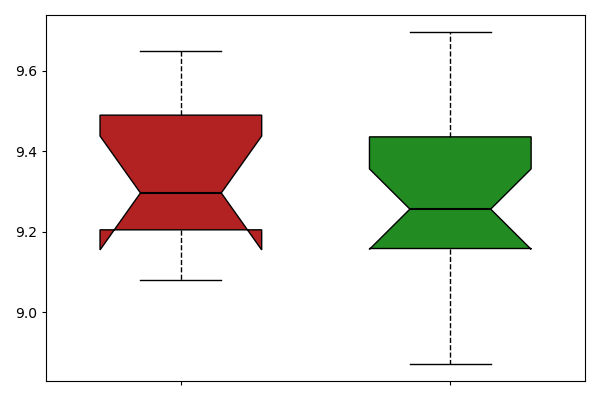
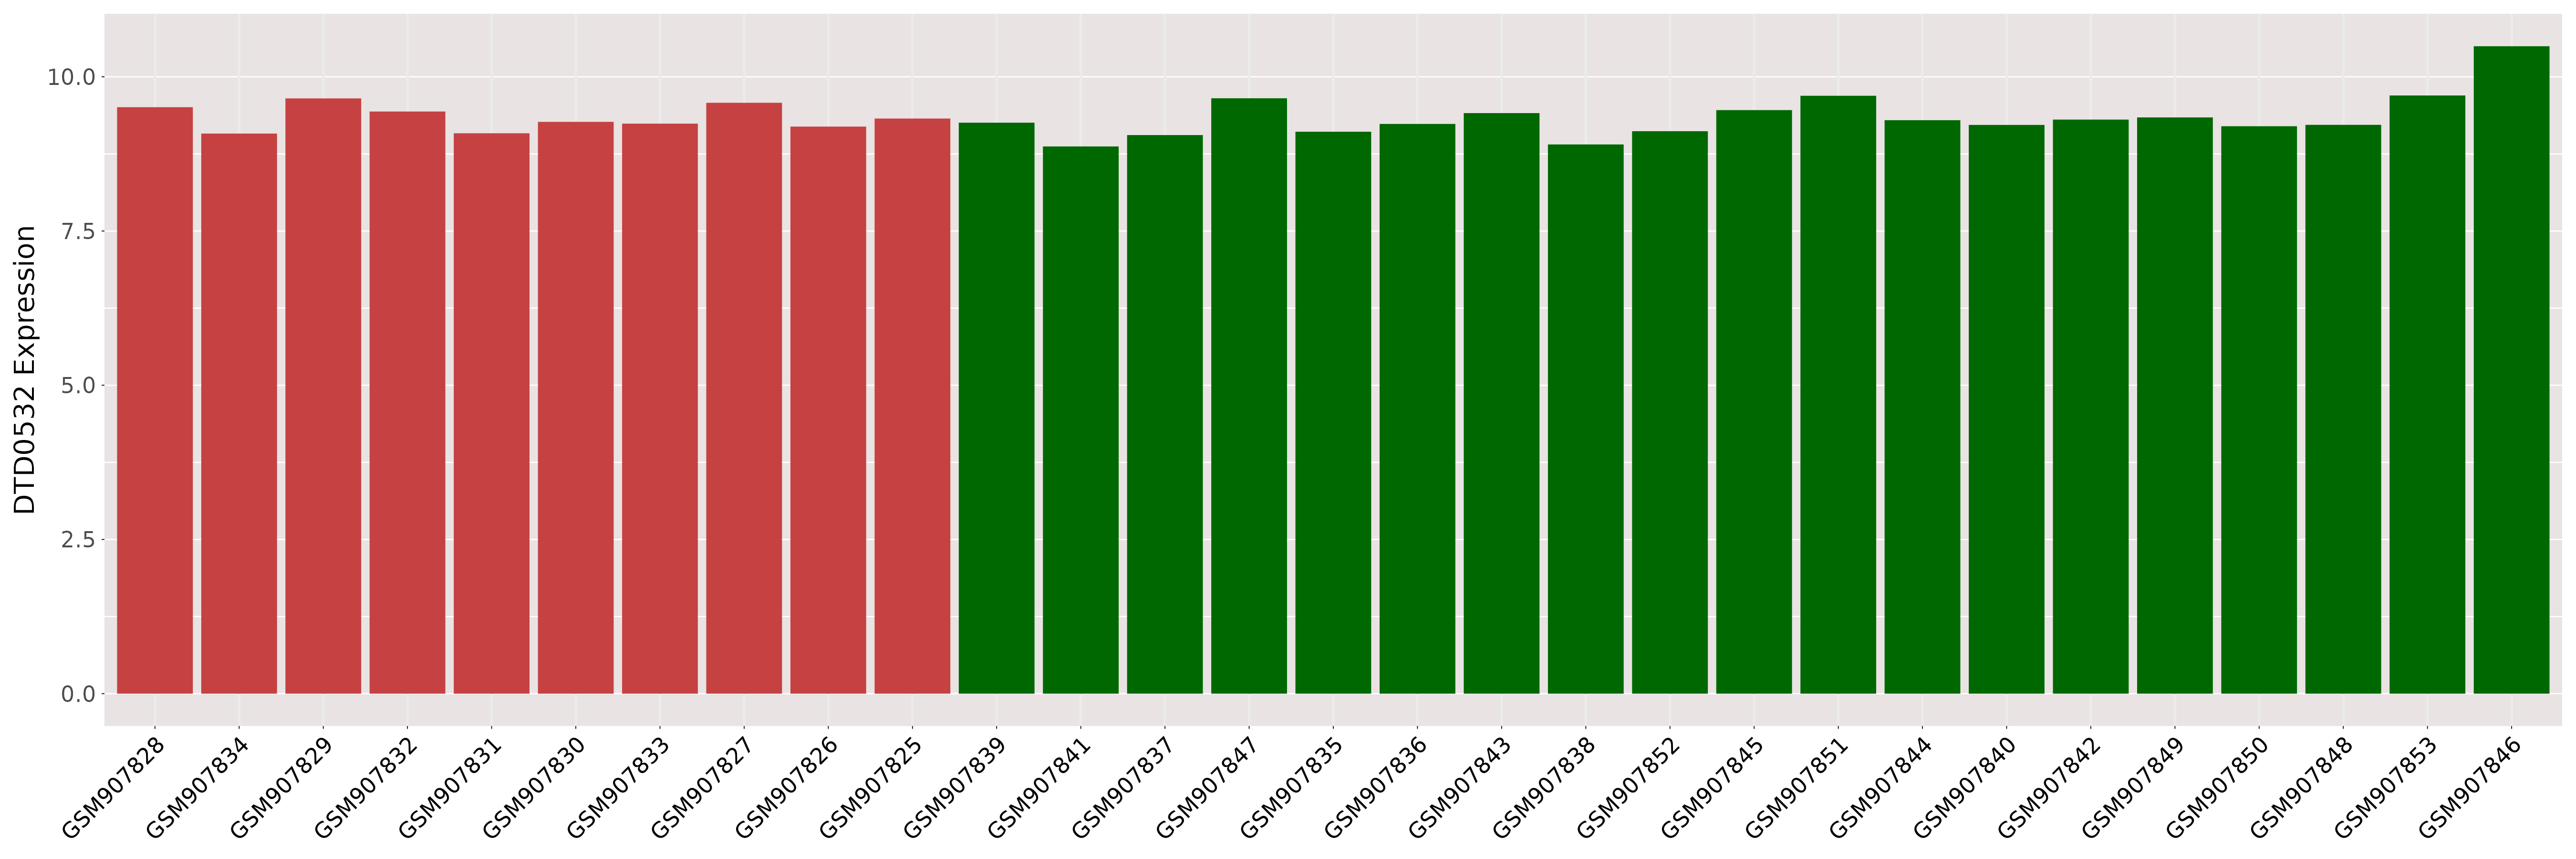
| The Expression Level of Disease Section Compare with the Healthy Individual Tissue | p-value:0.2727838843635223; Fold-change:0.9612075974793745; Z-score:-0.322934545 | ||||
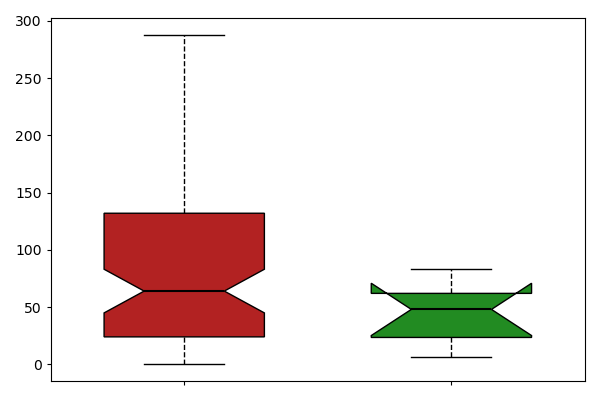
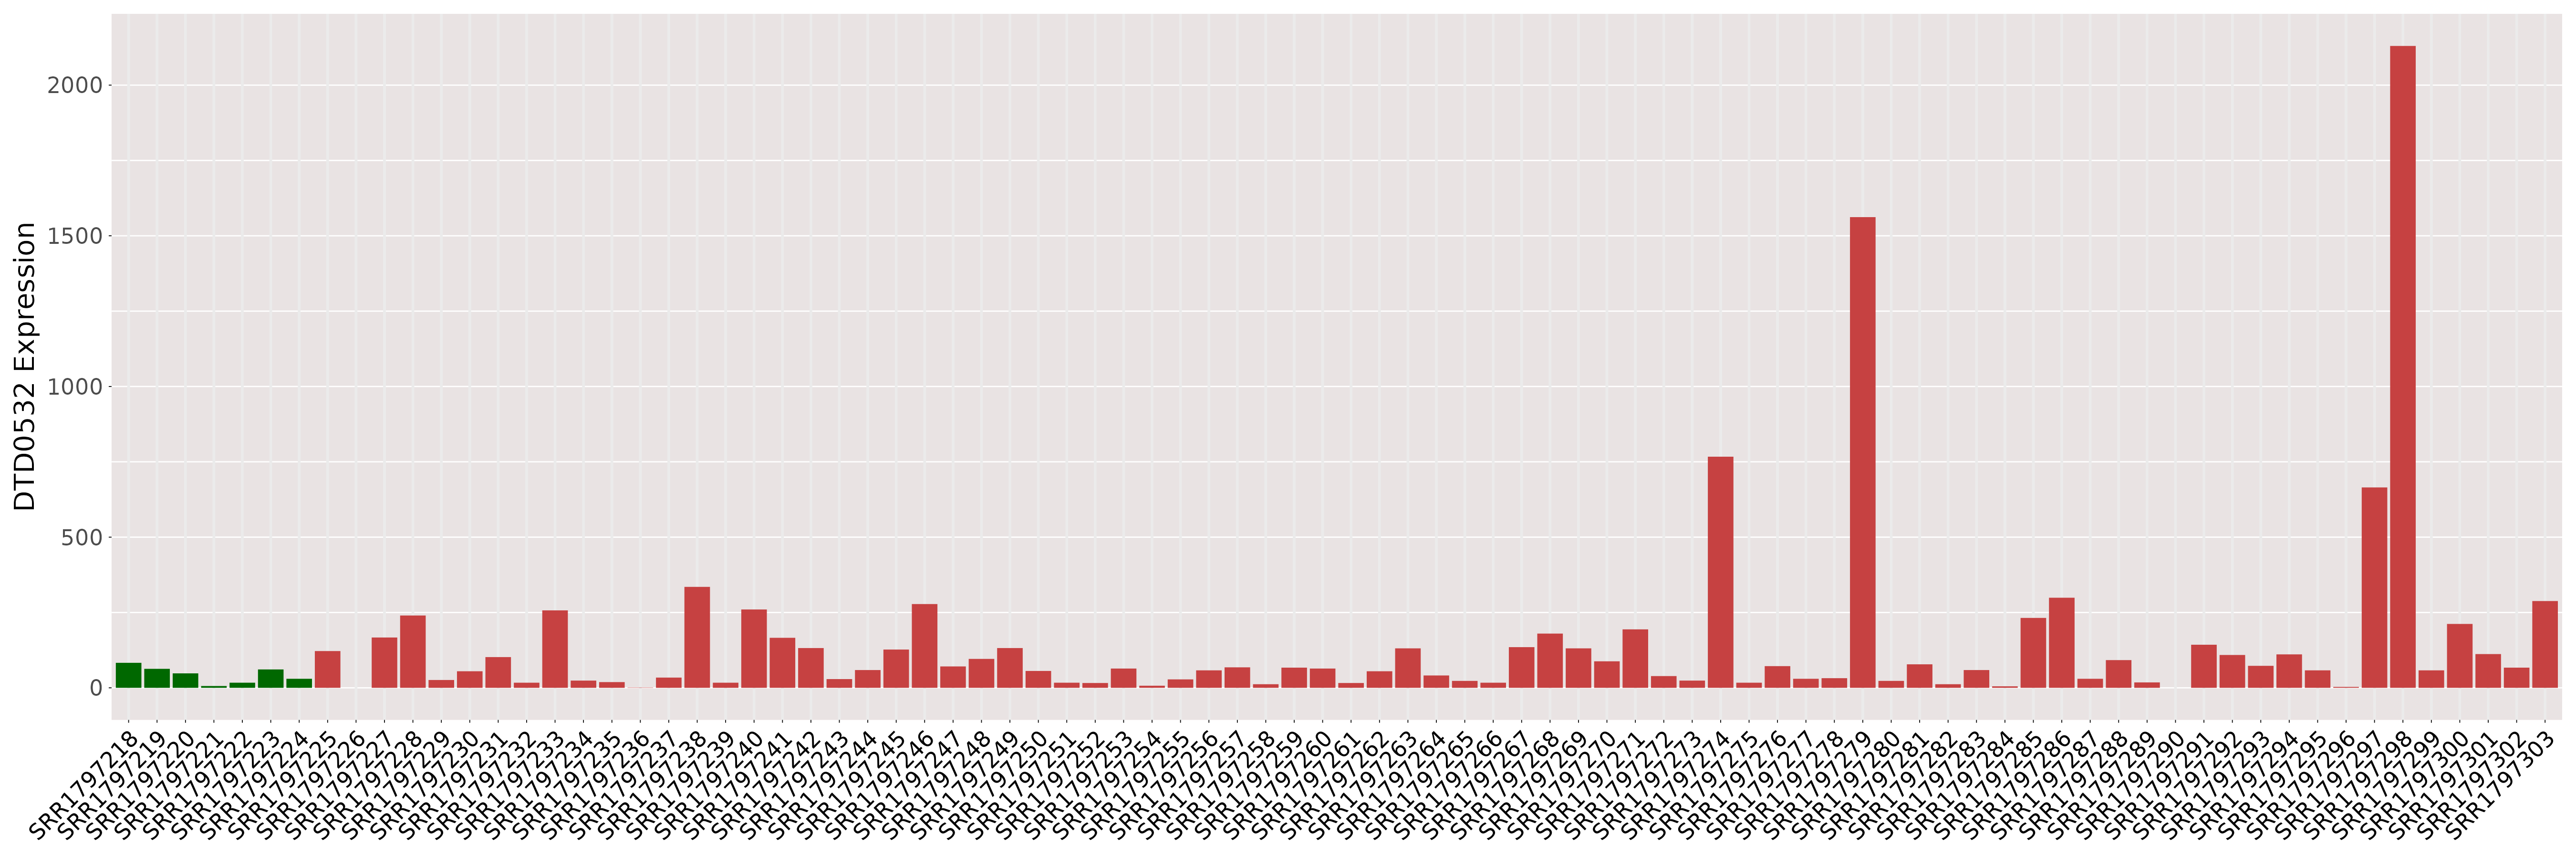
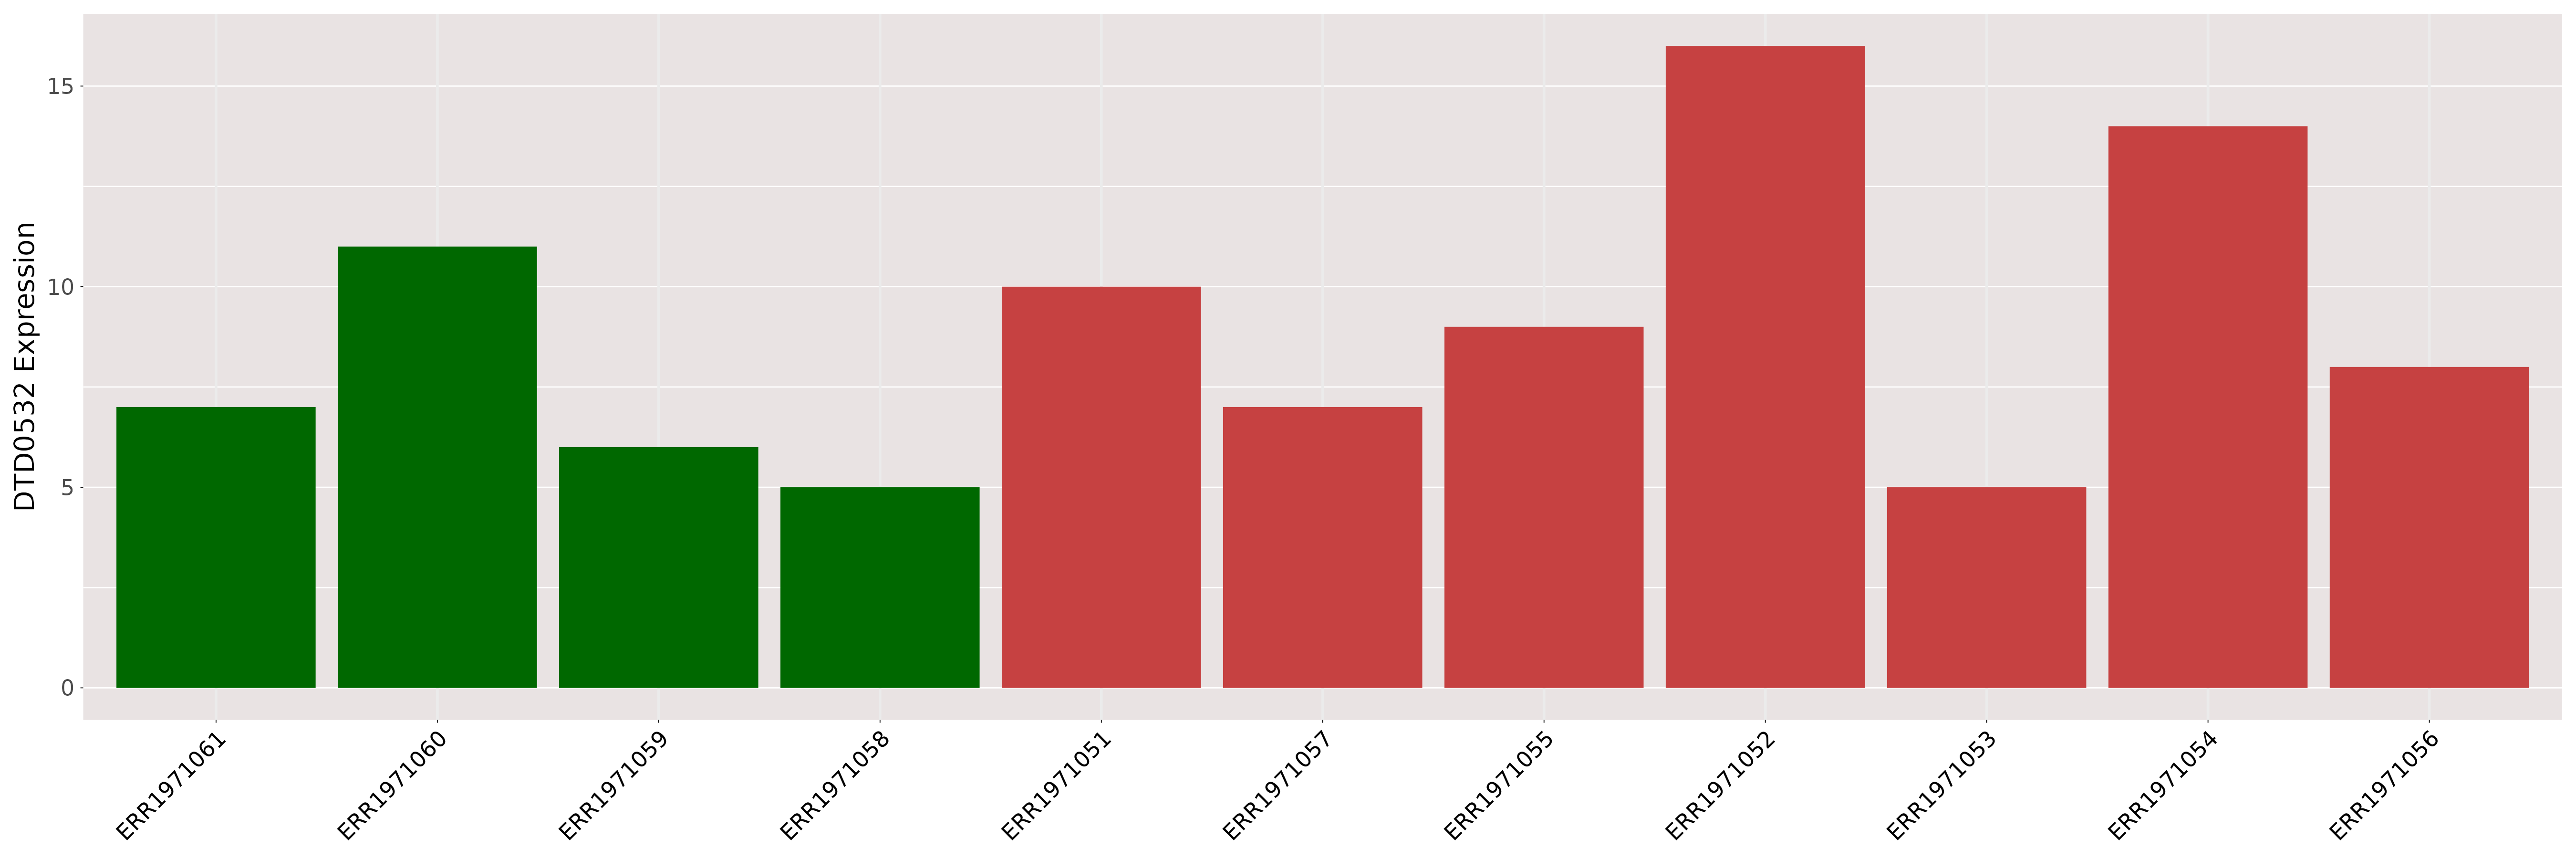
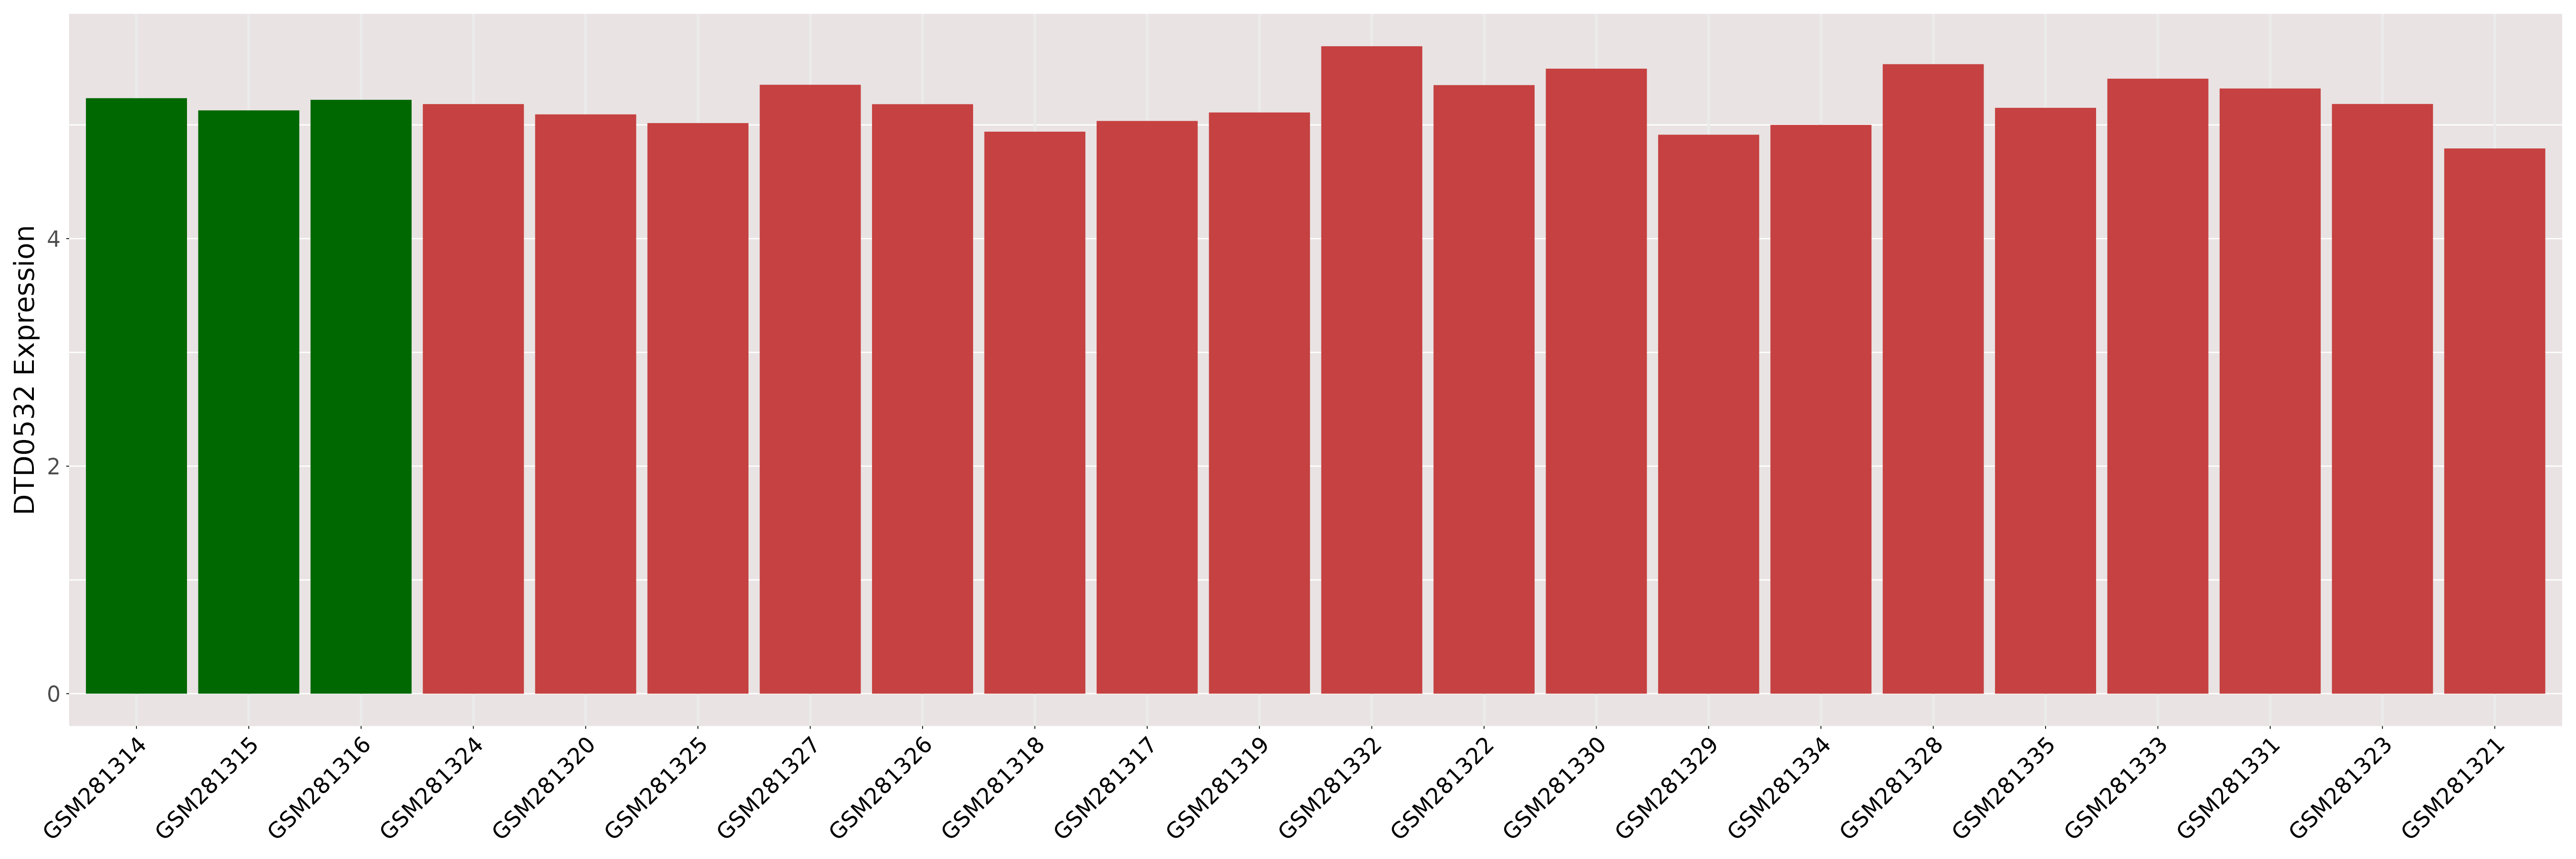
| DT expression in the diseased tissue of patients
DT expression in the normal tissue of healthy individuals
|
|||||

|
 Please Click the above Thumbnail to View/Download
the Expression Barchart for All Samples Please Click the above Thumbnail to View/Download
the Expression Barchart for All Samples
|
||||
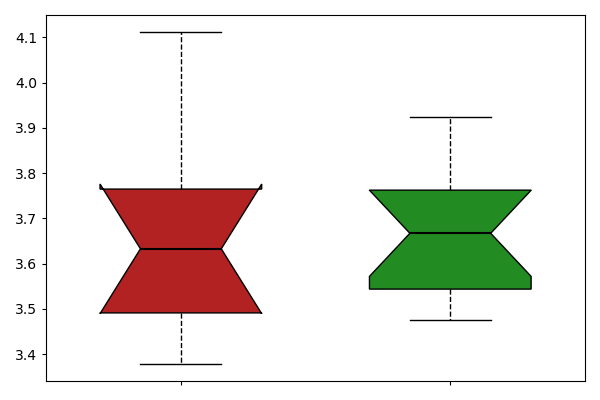
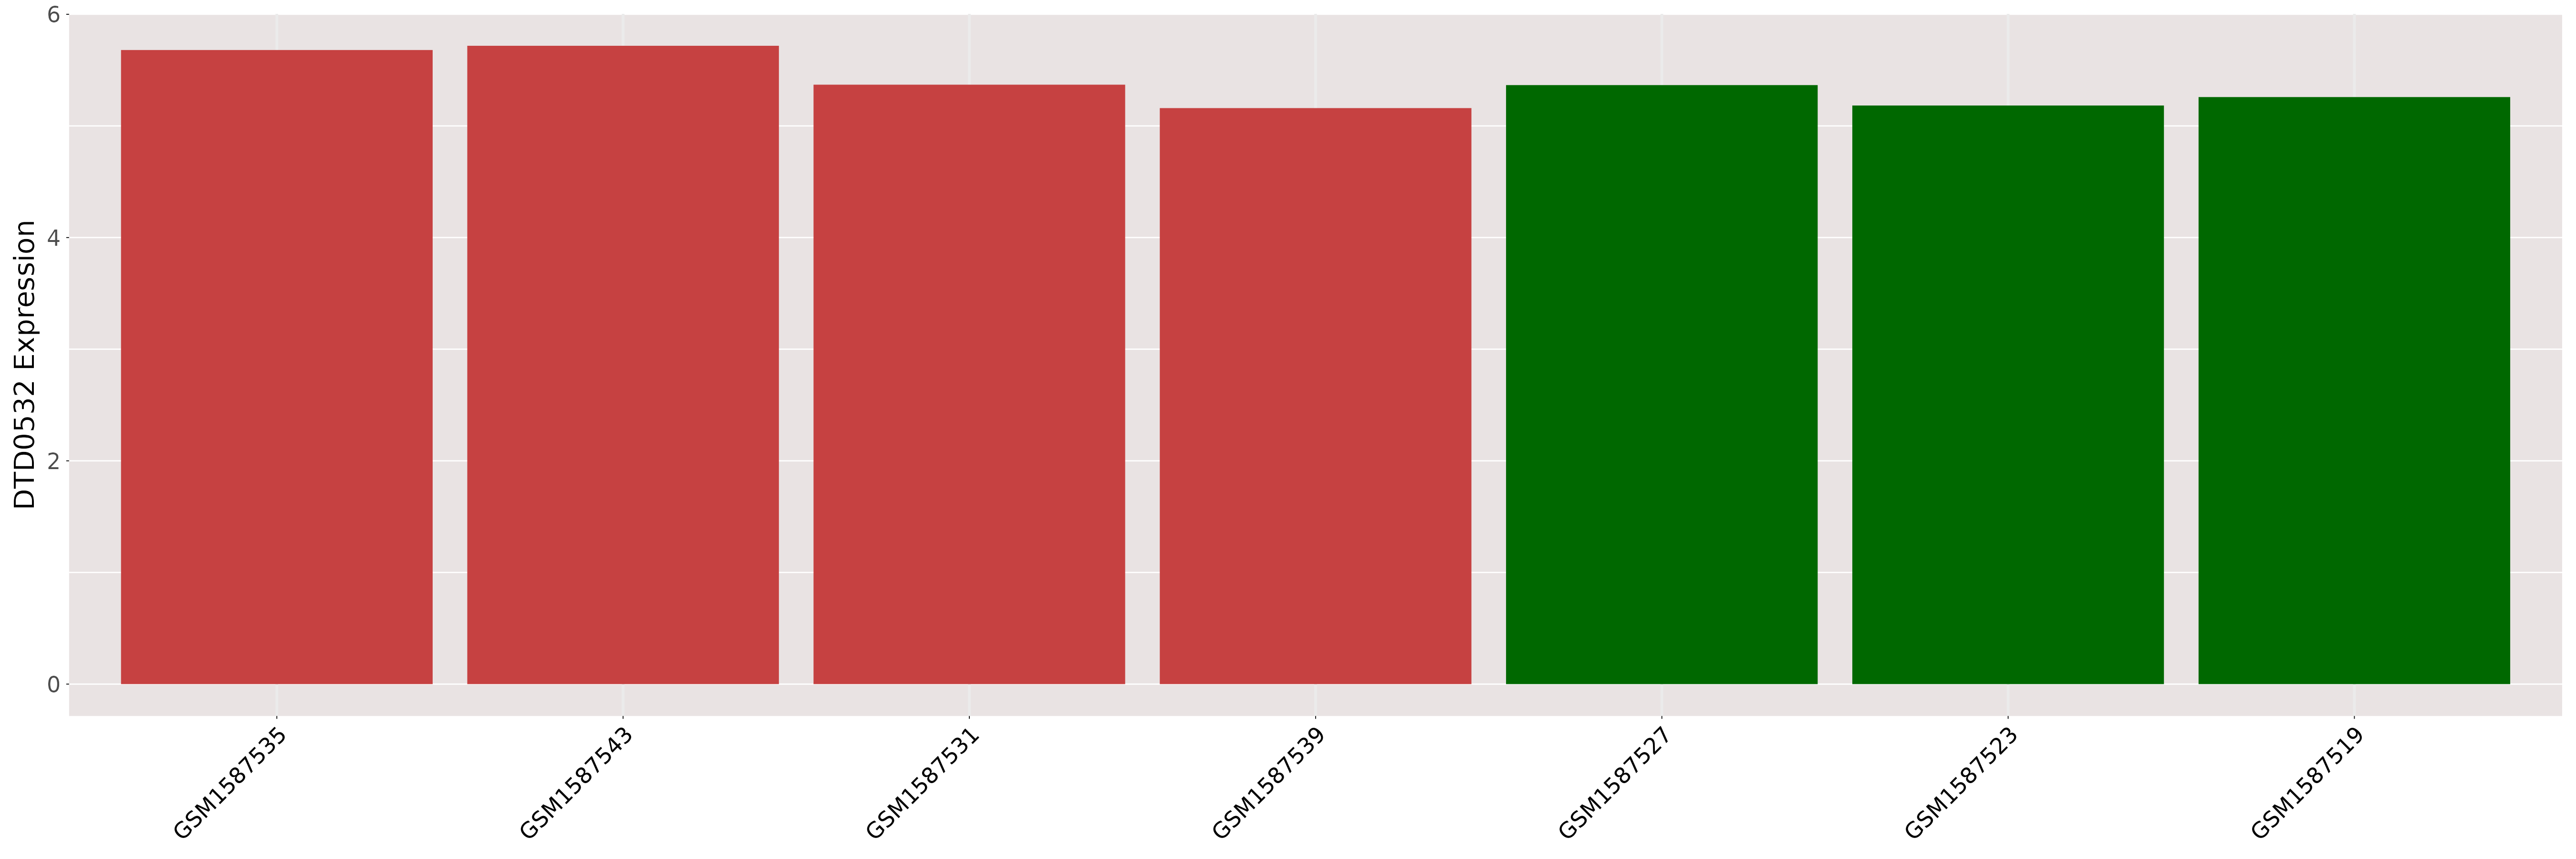
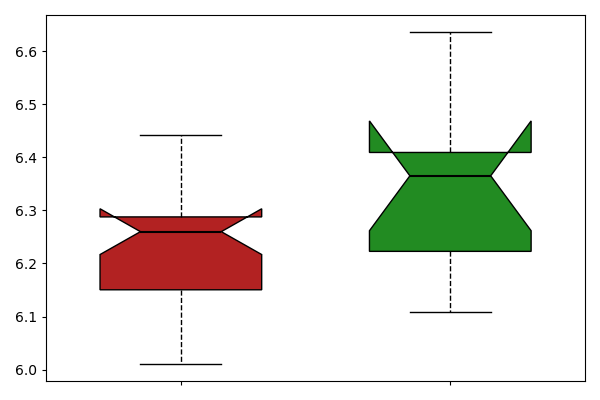
| [+] ICD-11: 2A00.10 Medulloblastoma | Click to Show/Hide the Full List | ||||
| The Studied Tissue | Brain | ||||
| The Specified Disease | Medulloblastoma [ICD-11:2A00.10] | ||||
| The Expression Level of Disease Section Compare with the Healthy Individual Tissue | p-value:0.6036988990716313; Fold-change:1.0001470483071118; Z-score:-0.365664178 | ||||
| DT expression in the diseased tissue of patients
DT expression in the normal tissue of healthy individuals
|
|||||
|
 Please Click the above Thumbnail to View/Download
the Expression Barchart for All Samples Please Click the above Thumbnail to View/Download
the Expression Barchart for All Samples
|
||||
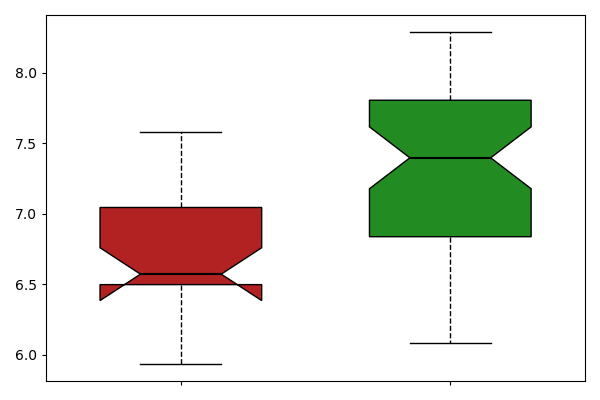
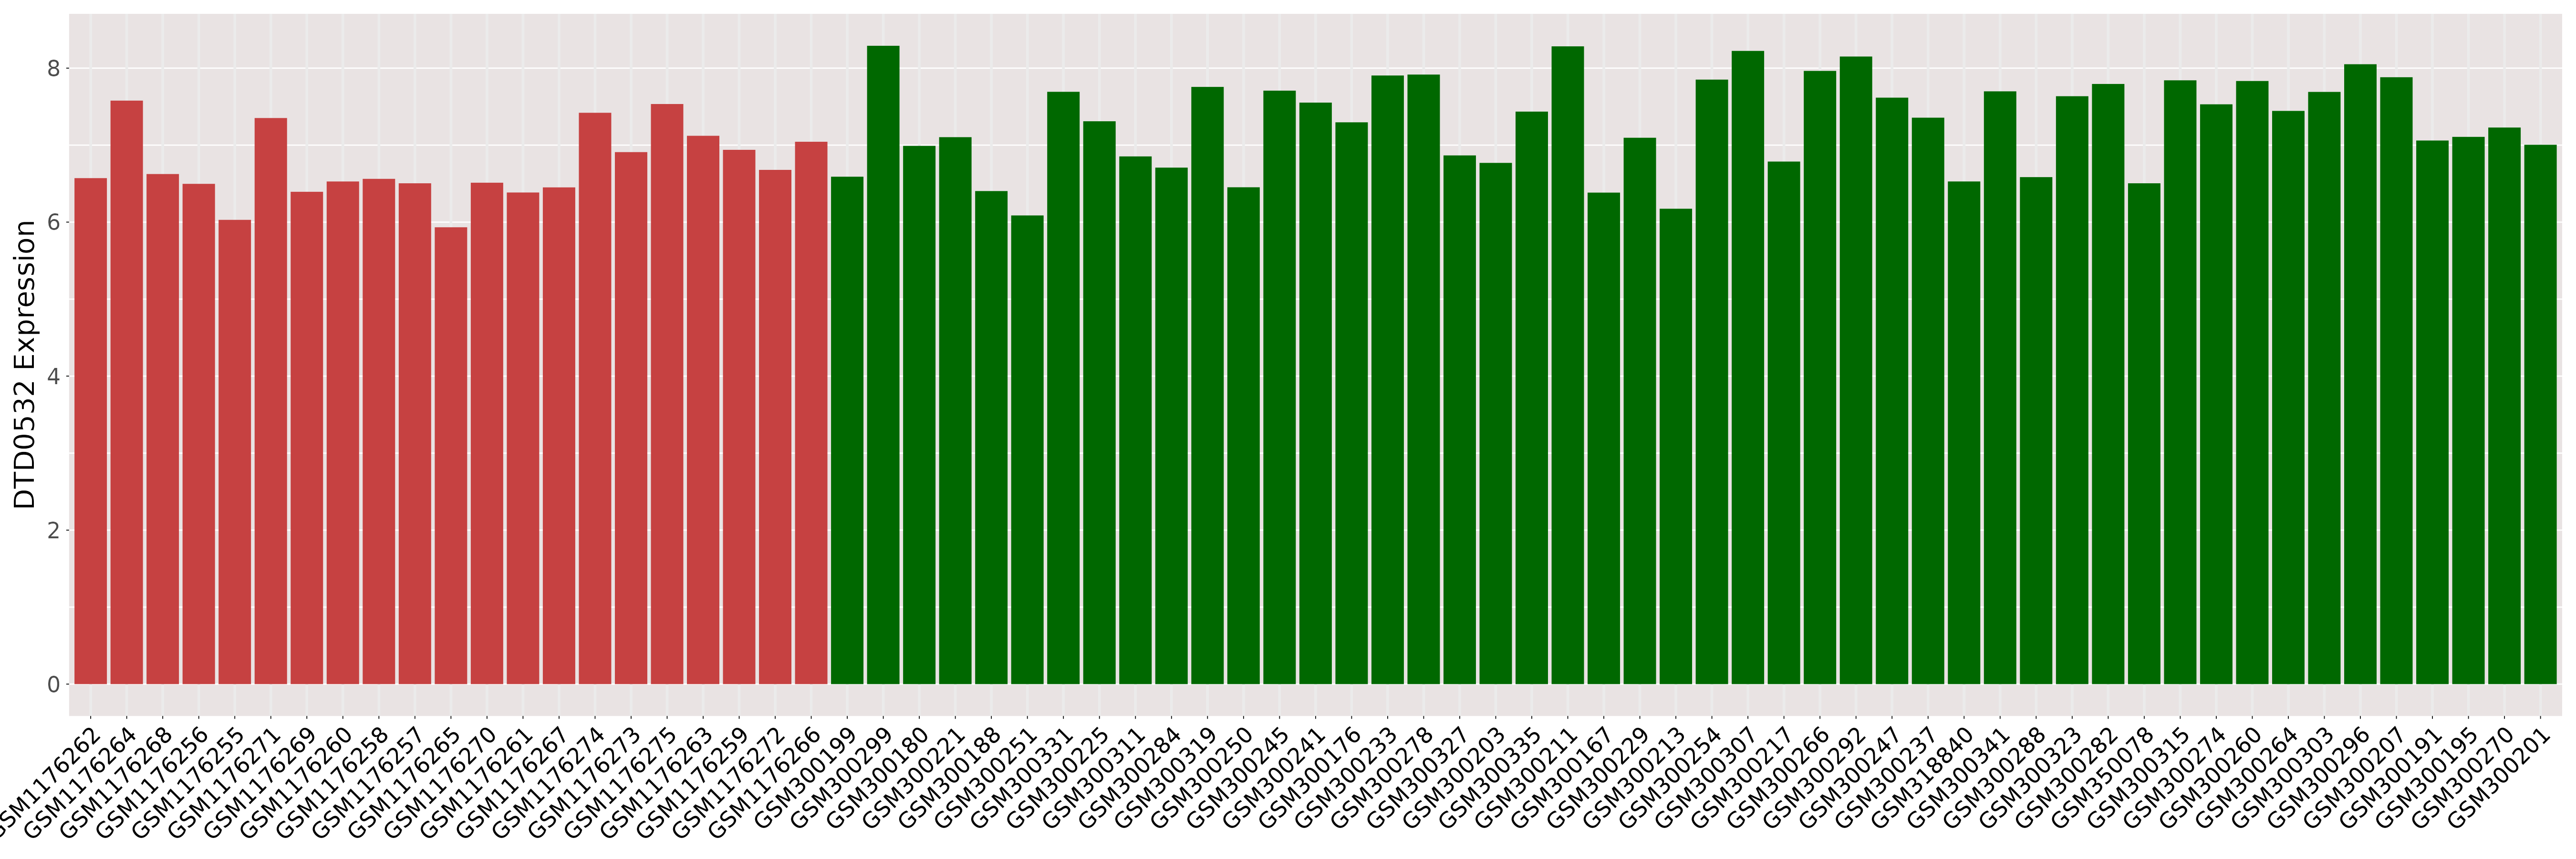
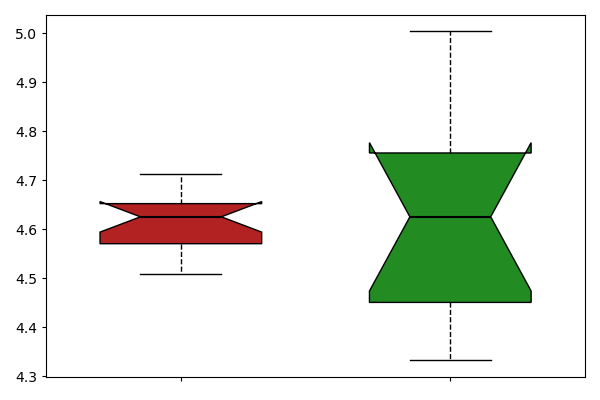
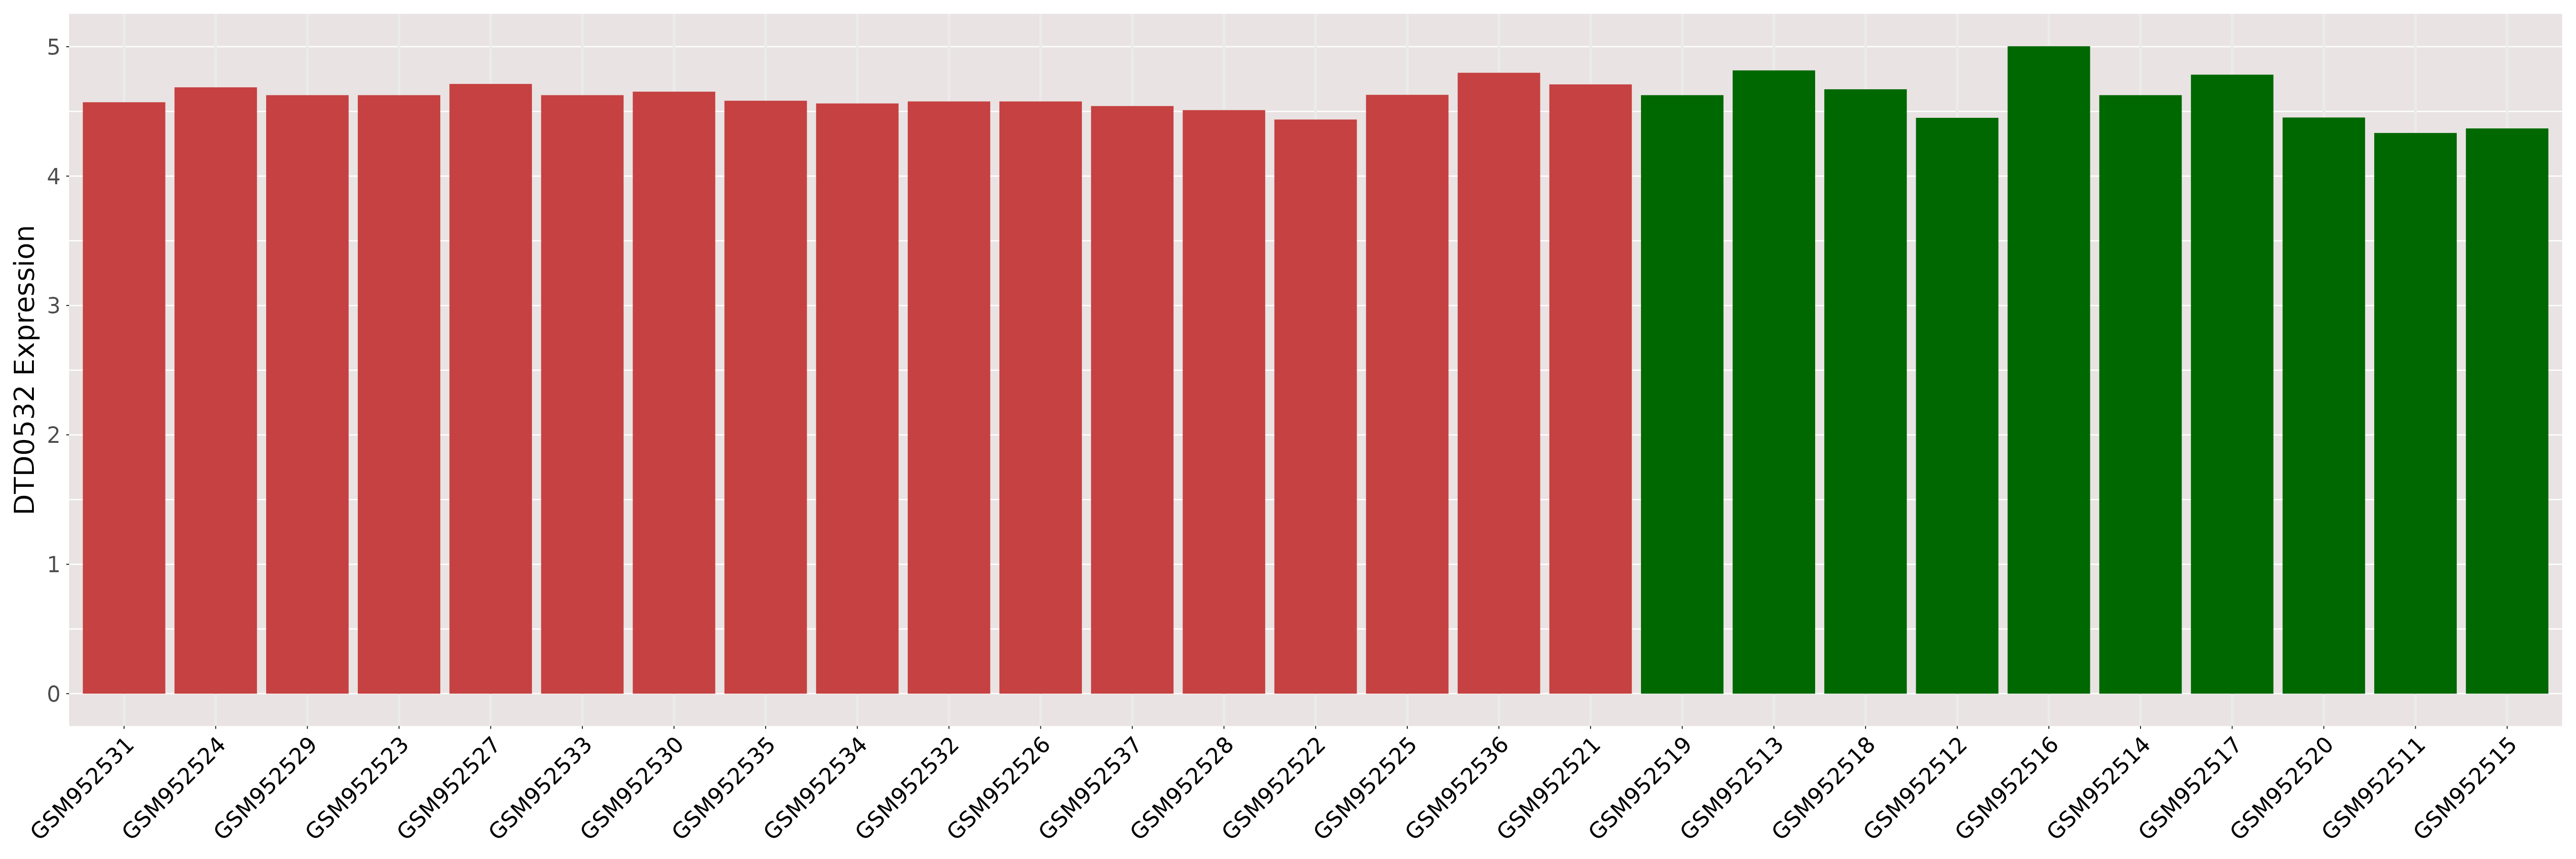
| [+] ICD-11: 2A00.1Y Glioblastoma (other specified malignant neoplasm of brain) | Click to Show/Hide the Full List | ||||
| The Studied Tissue | Brain | ||||
| The Specified Disease | Glioblastoma [ICD-11:2A00.1Y] | ||||
| The Expression Level of Disease Section Compare with the Healthy Individual Tissue | p-value:0.3228863367506467; Fold-change:0.995370489598006; Z-score:-0.627934072 | ||||
| DT expression in the diseased tissue of patients
DT expression in the normal tissue of healthy individuals
|
|||||
|
 Please Click the above Thumbnail to View/Download
the Expression Barchart for All Samples Please Click the above Thumbnail to View/Download
the Expression Barchart for All Samples
|
||||
| [+] ICD-11: 2A00.1Y Large-cell medulloblastoma | Click to Show/Hide the Full List | ||||
| The Studied Tissue | Brain | ||||
| The Specified Disease | Medulloblastoma, large cell [ICD-11:2A00.10] | ||||
| The Expression Level of Disease Section Compare with the Healthy Individual Tissue | p-value:0.6209443665717478; Fold-change:1.0538811514278013; Z-score:0.4743185943146391 | ||||
| DT expression in the diseased tissue of patients
DT expression in the normal tissue of healthy individuals
|
|||||
|
 Please Click the above Thumbnail to View/Download
the Expression Barchart for All Samples Please Click the above Thumbnail to View/Download
the Expression Barchart for All Samples
|
||||
| [+] ICD-11: 2A00.1Y Primitive neuroectodermal tumor (PNET) | Click to Show/Hide the Full List | ||||
| The Studied Tissue | Brain | ||||
| The Specified Disease | Primitive neuroectodermal tumor [ICD-11:2A00.Y] | ||||
| The Expression Level of Disease Section Compare with the Healthy Individual Tissue | p-value:0.1933932920518331; Fold-change:1.002396018998006; Z-score:-0.624850873 | ||||
| DT expression in the diseased tissue of patients
DT expression in the normal tissue of healthy individuals
|
|||||
|
 Please Click the above Thumbnail to View/Download
the Expression Barchart for All Samples Please Click the above Thumbnail to View/Download
the Expression Barchart for All Samples
|
||||
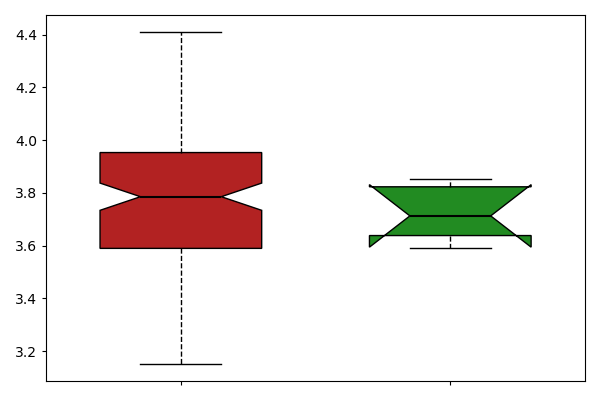
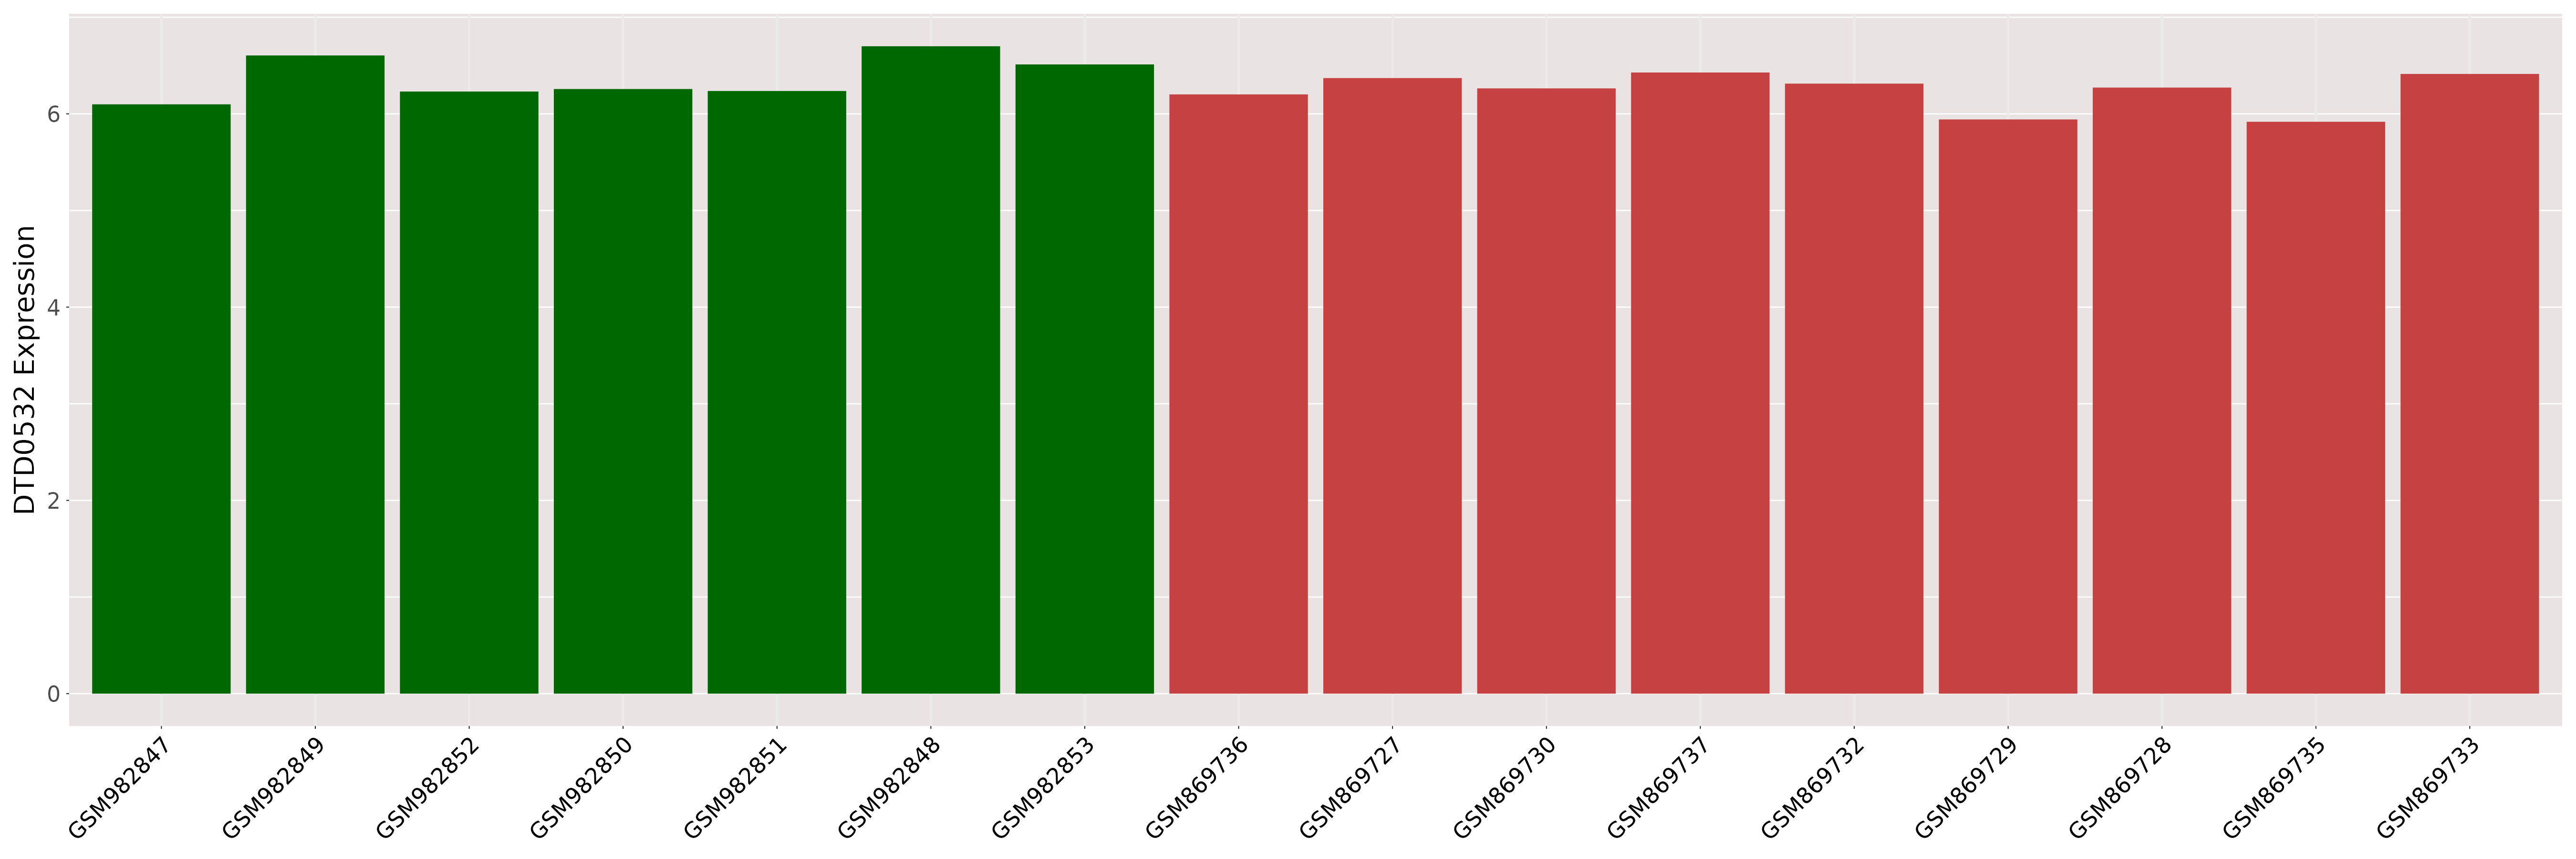
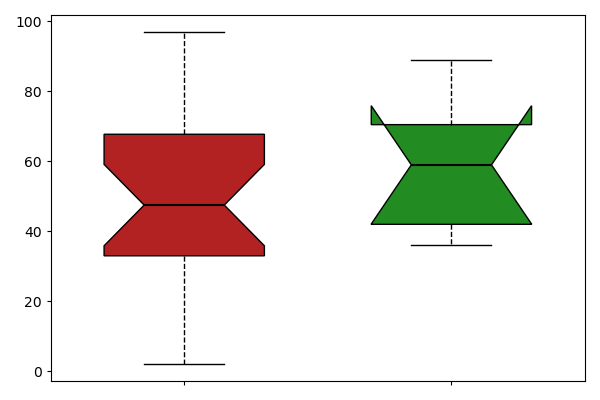
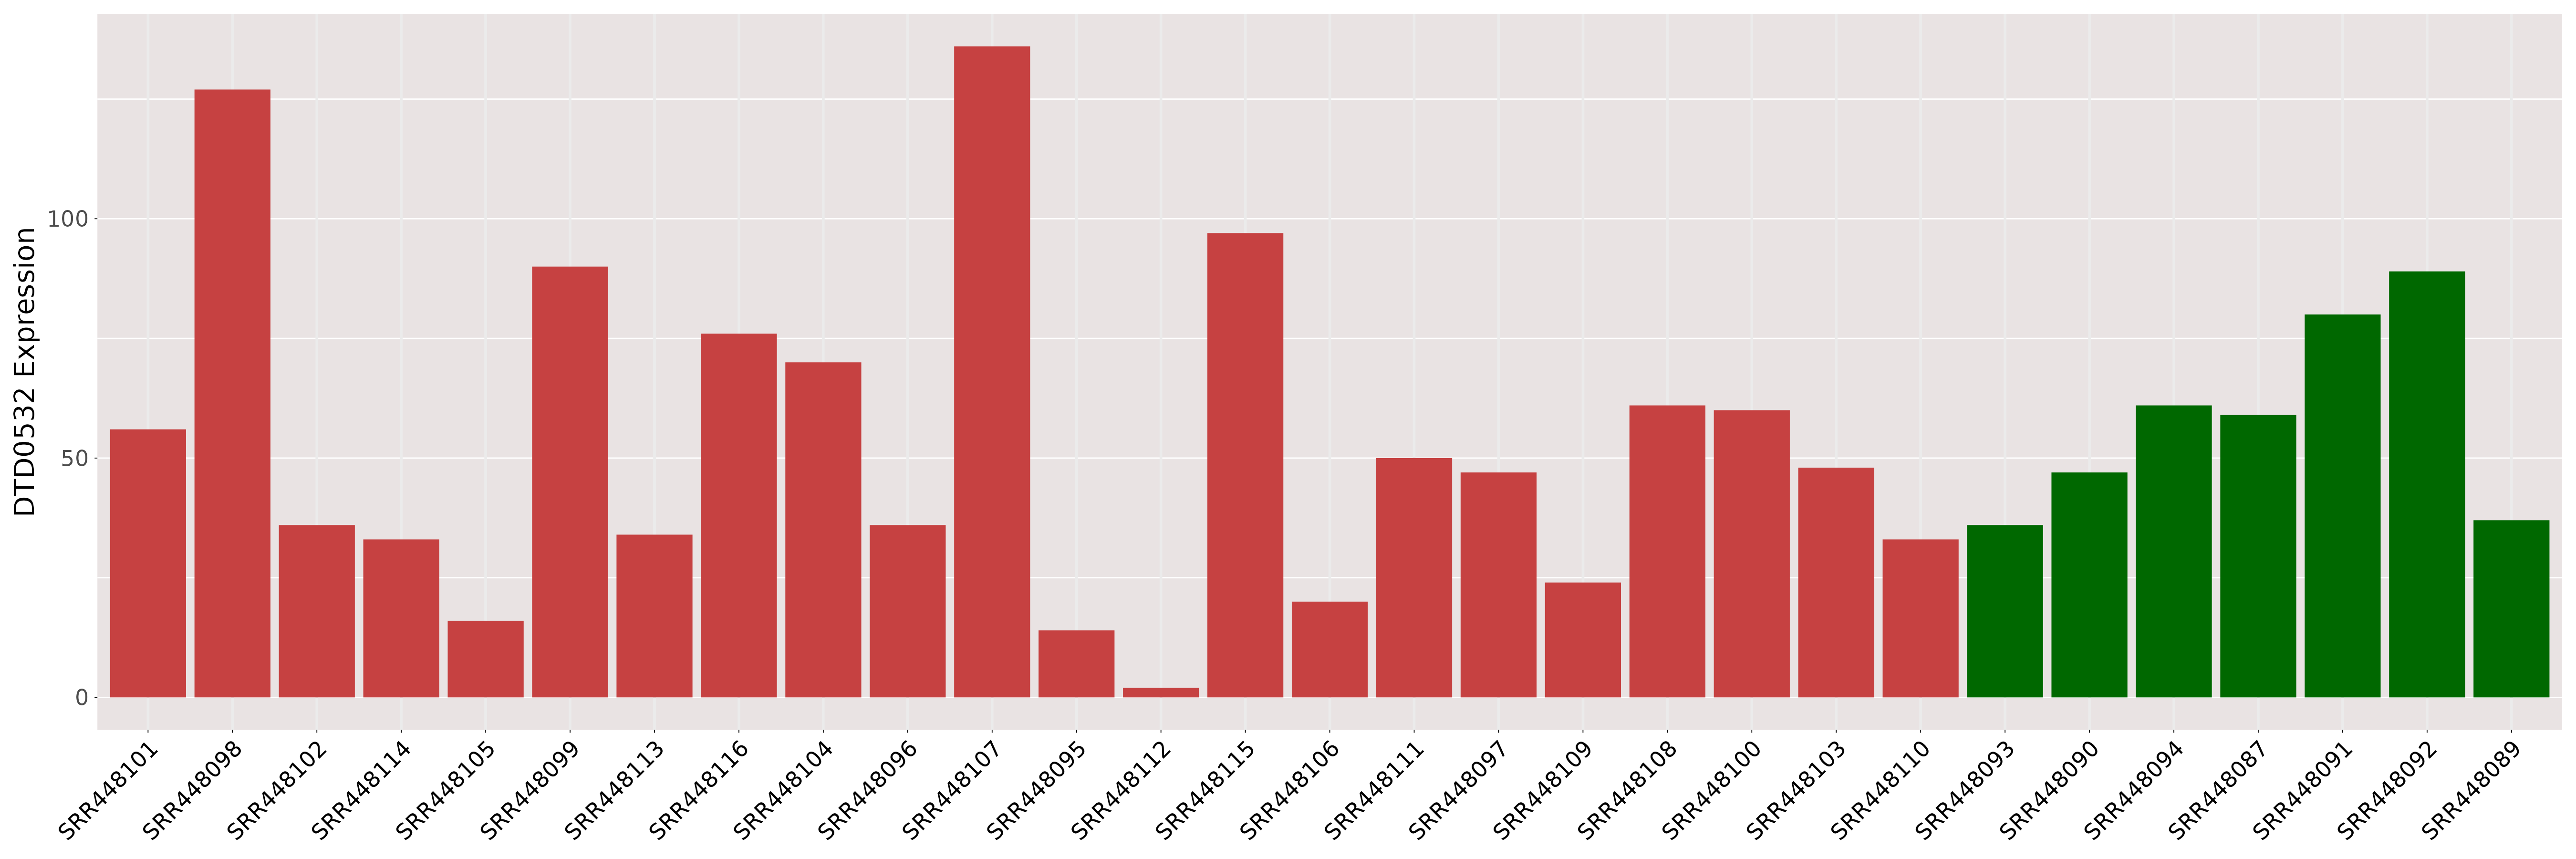
| [+] ICD-11: 2B91 Colorectal carcinoma (colorectal cancer) | Click to Show/Hide the Full List | ||||
| The Studied Tissue | Blood | ||||
| The Specified Disease | Colorectal cancer [ICD-11:2B91] | ||||
| The Expression Level of Disease Section Compare with the Healthy Individual Tissue | p-value:0.721839009662218; Fold-change:1.0075789477237551; Z-score:0.0978787999398399 | ||||
| DT expression in the diseased tissue of patients
DT expression in the normal tissue of healthy individuals
|
|||||

|
 Please Click the above Thumbnail to View/Download
the Expression Barchart for All Samples Please Click the above Thumbnail to View/Download
the Expression Barchart for All Samples
|
||||
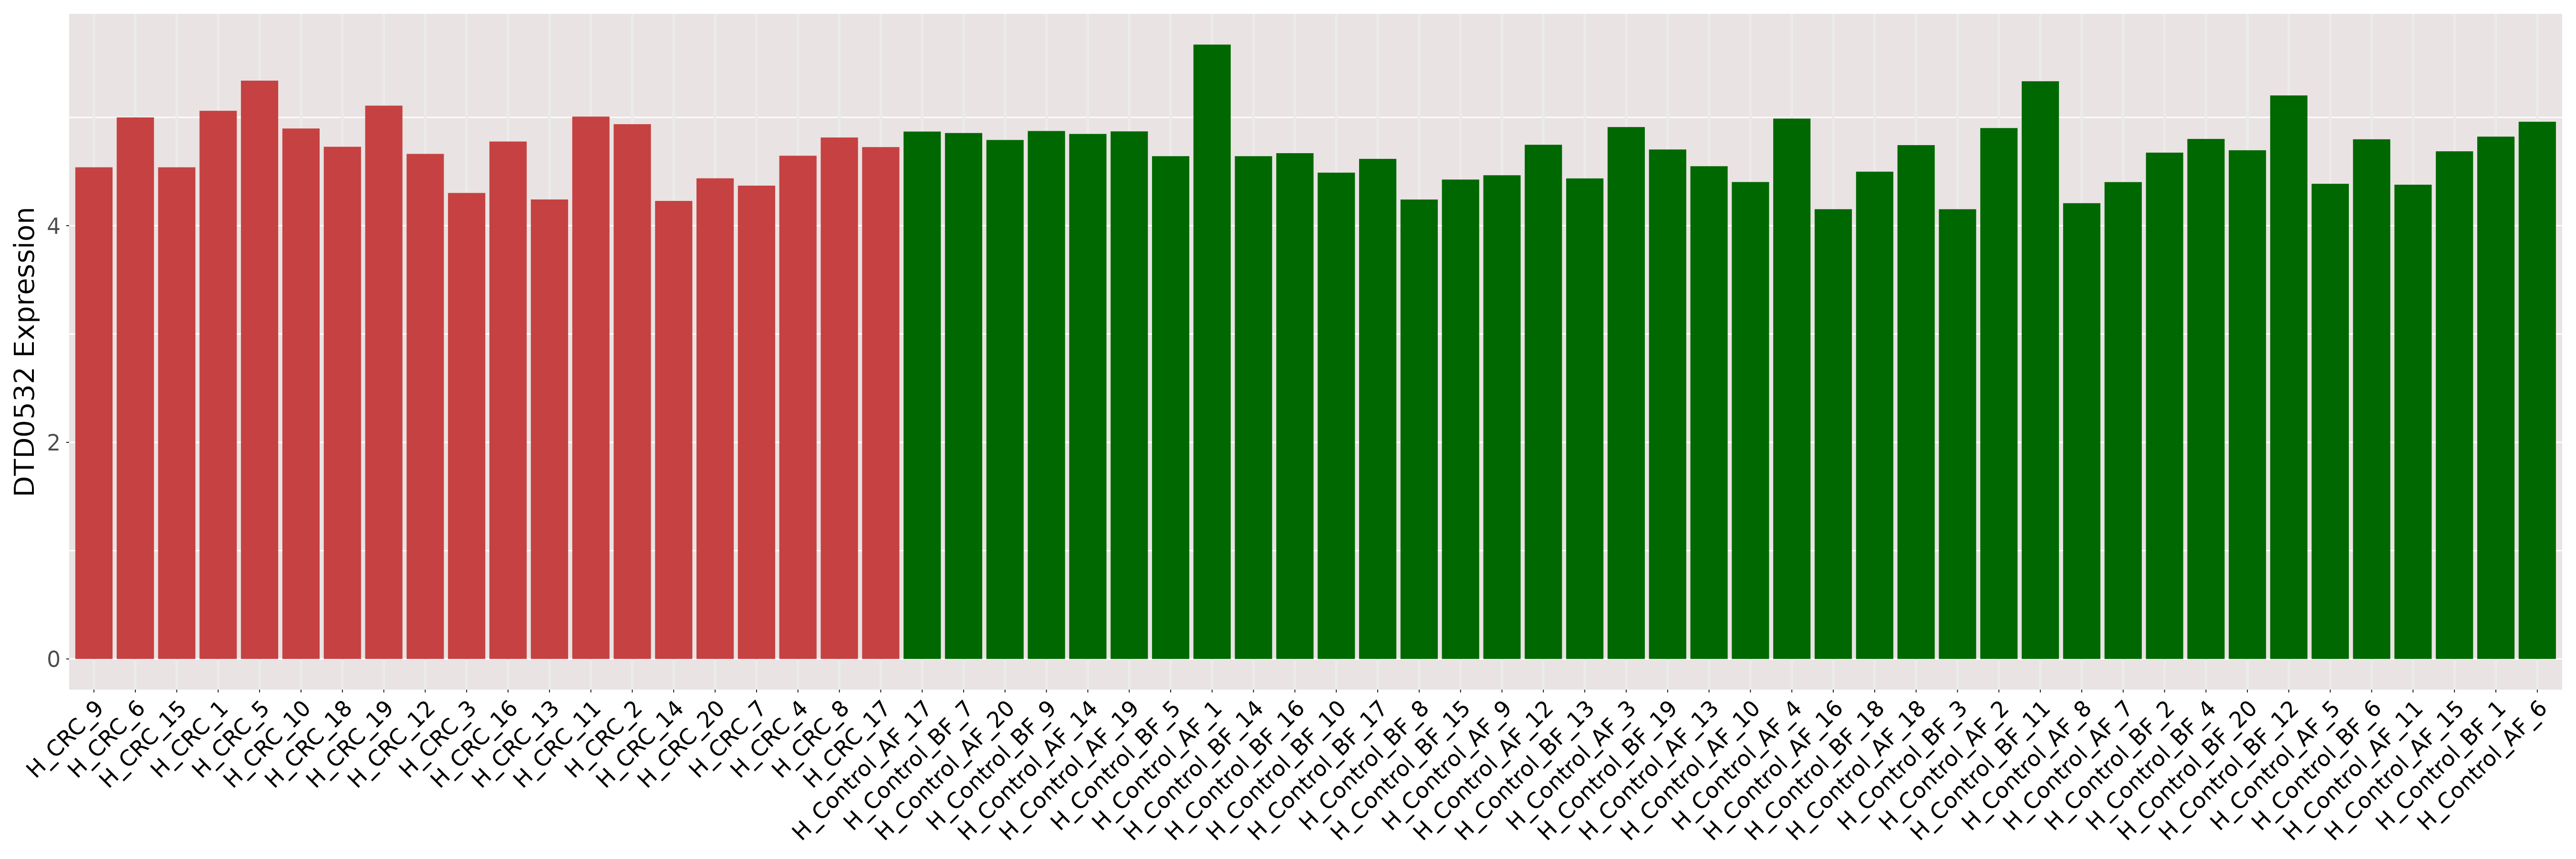
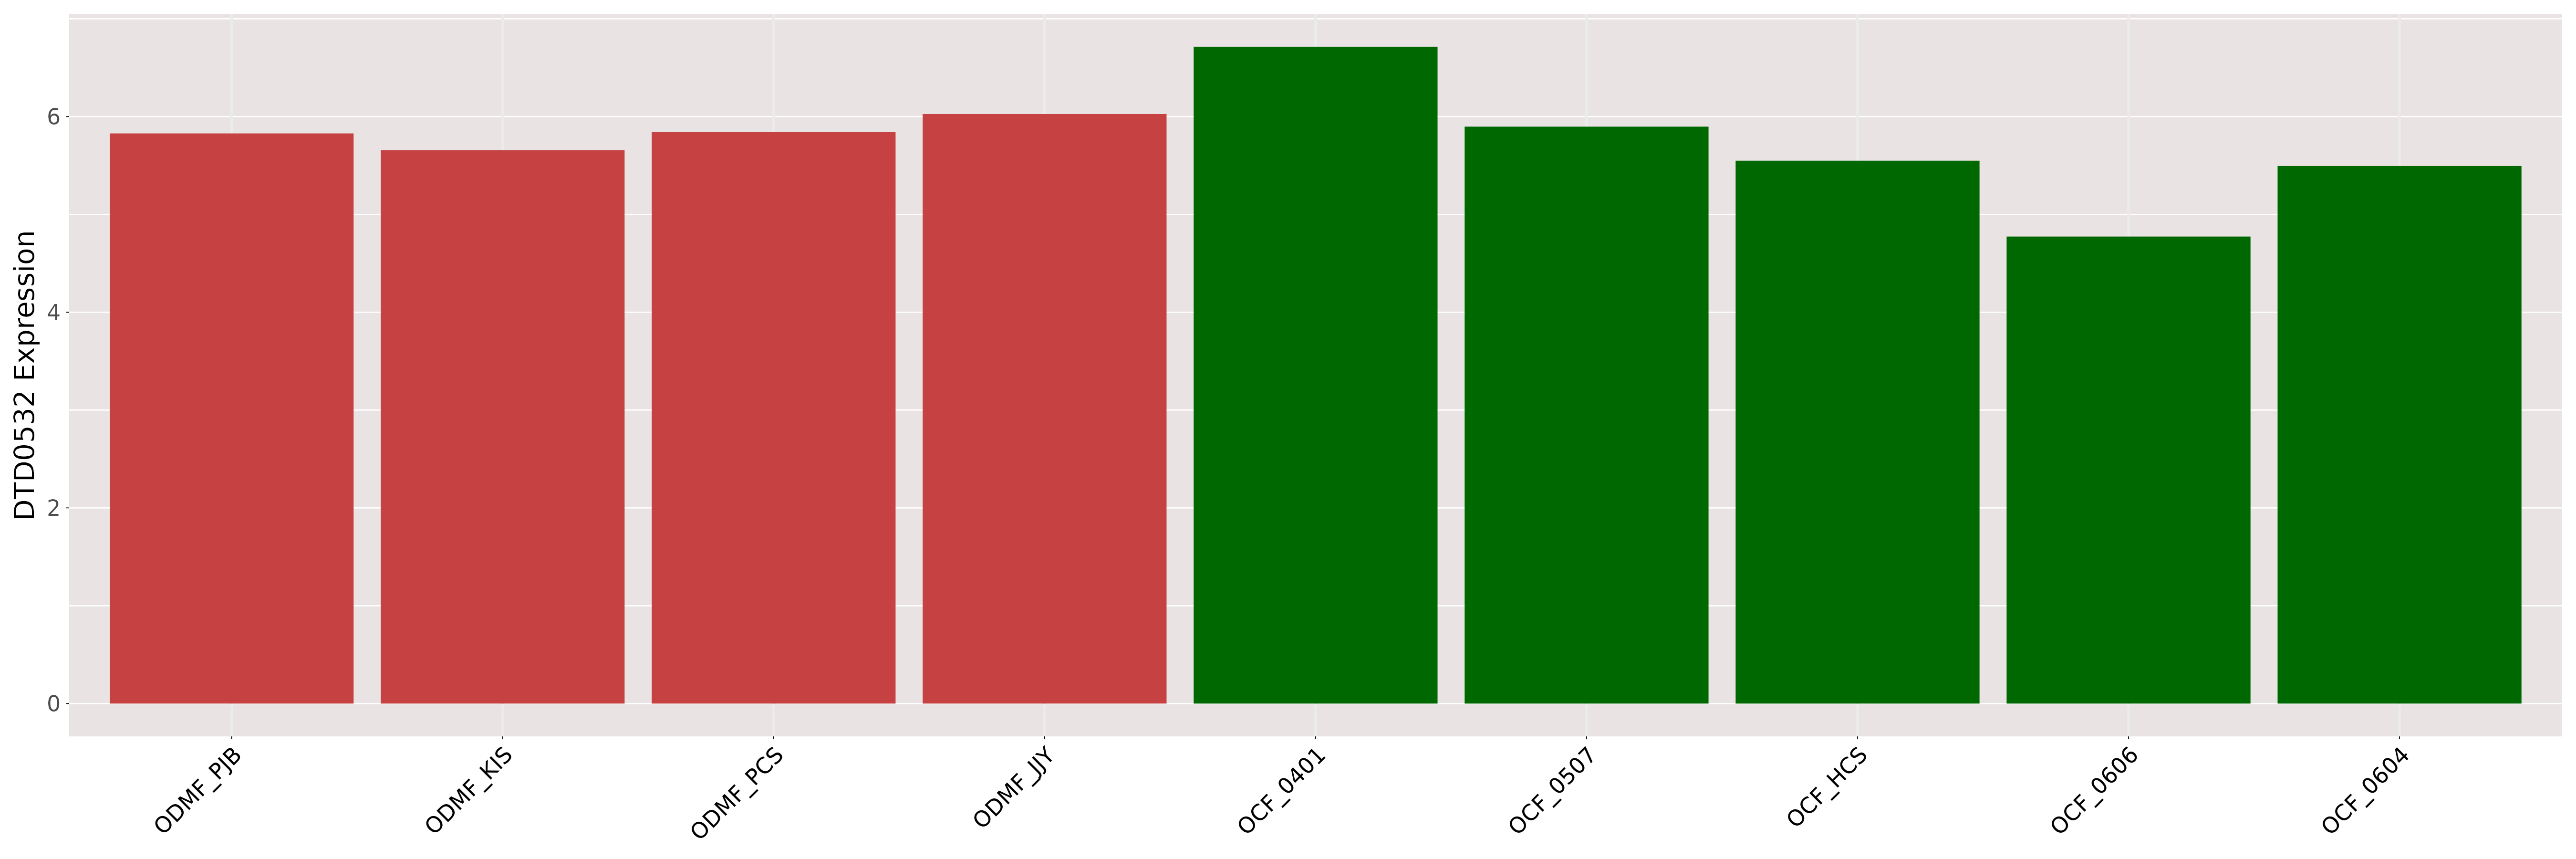
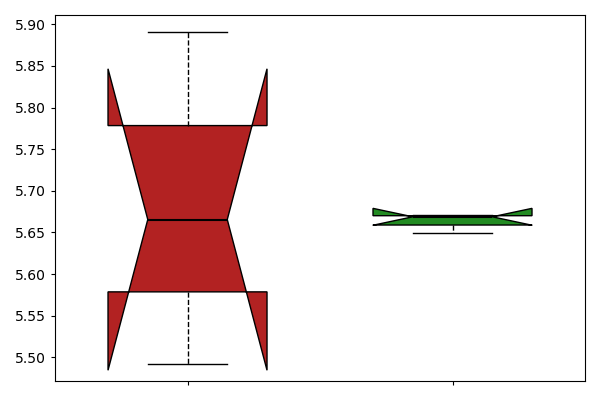
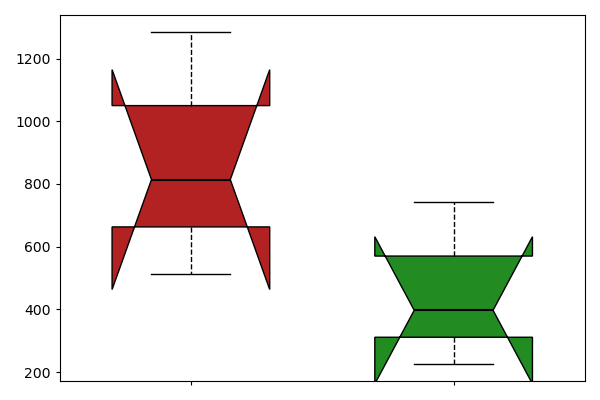
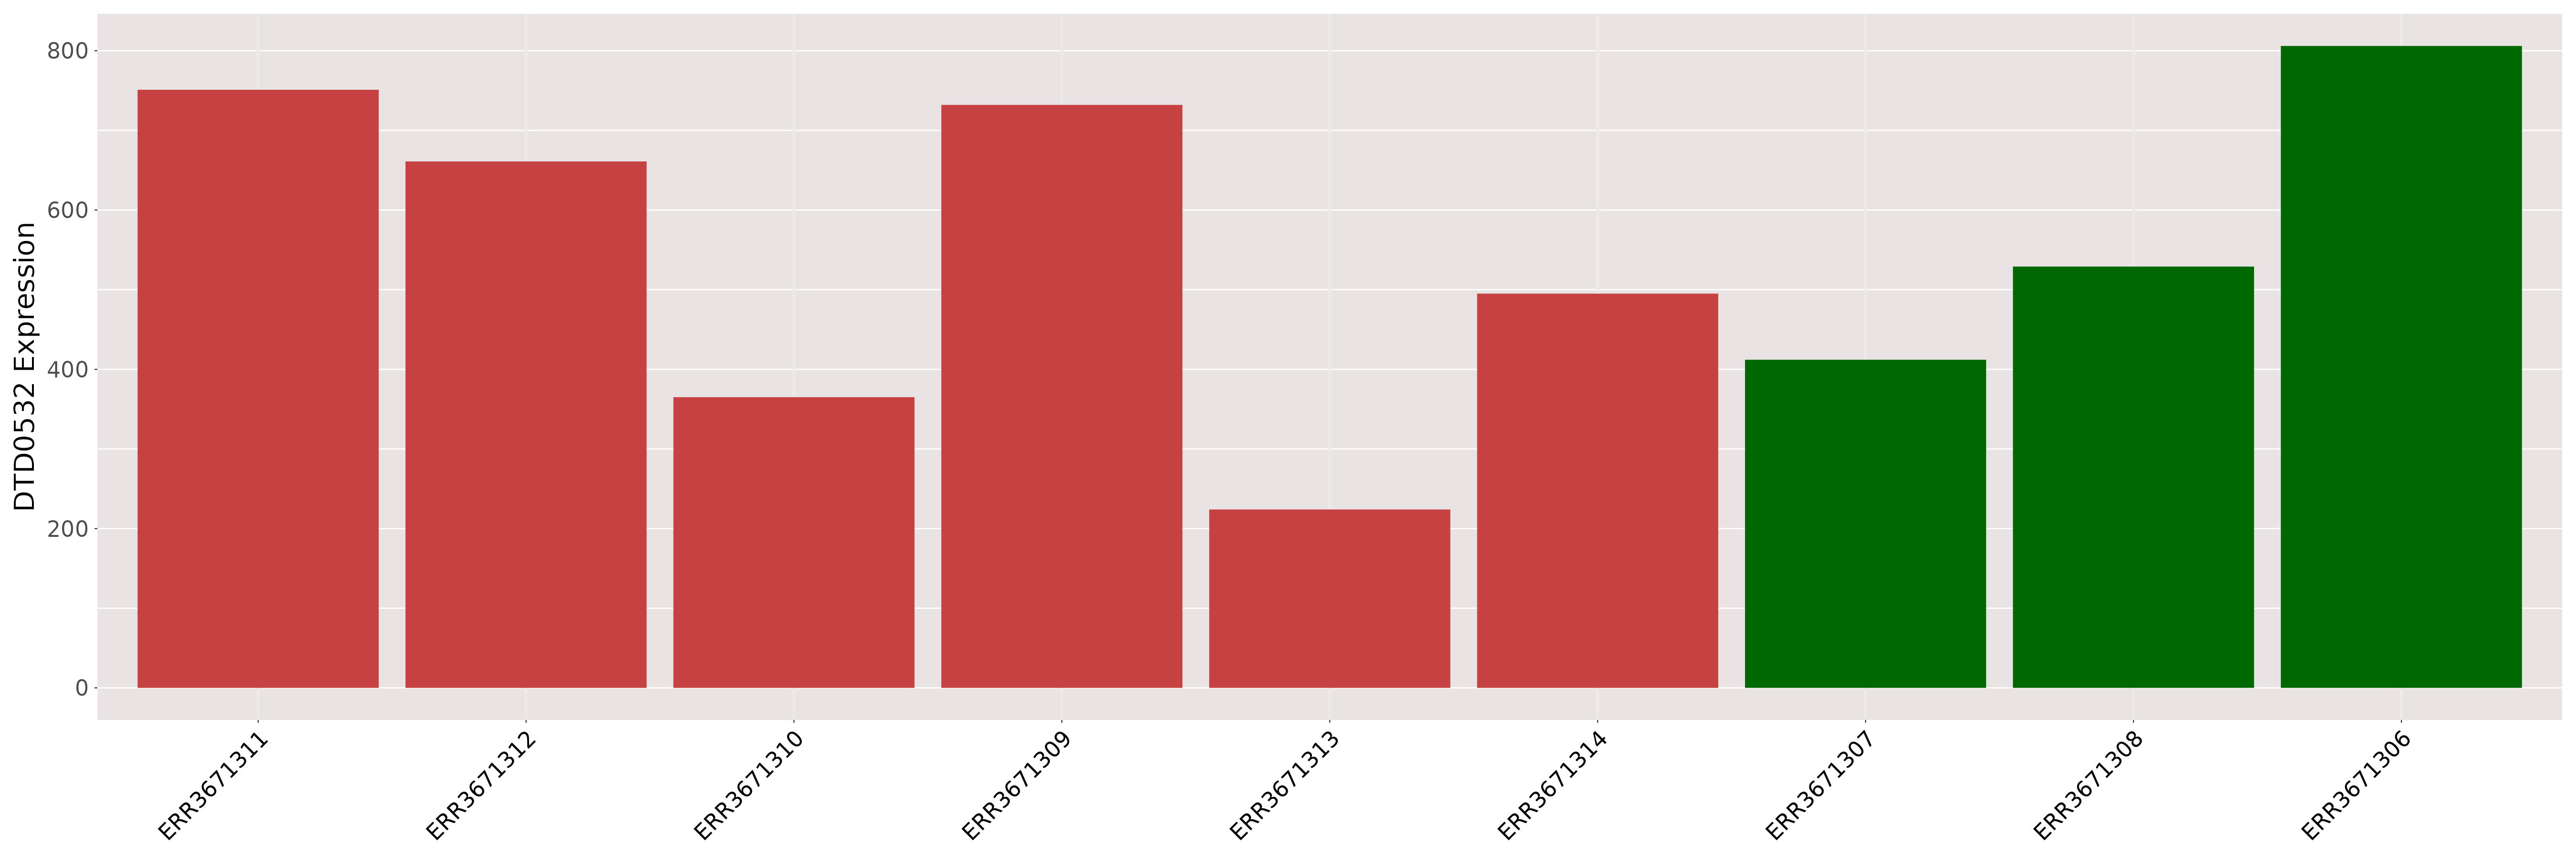
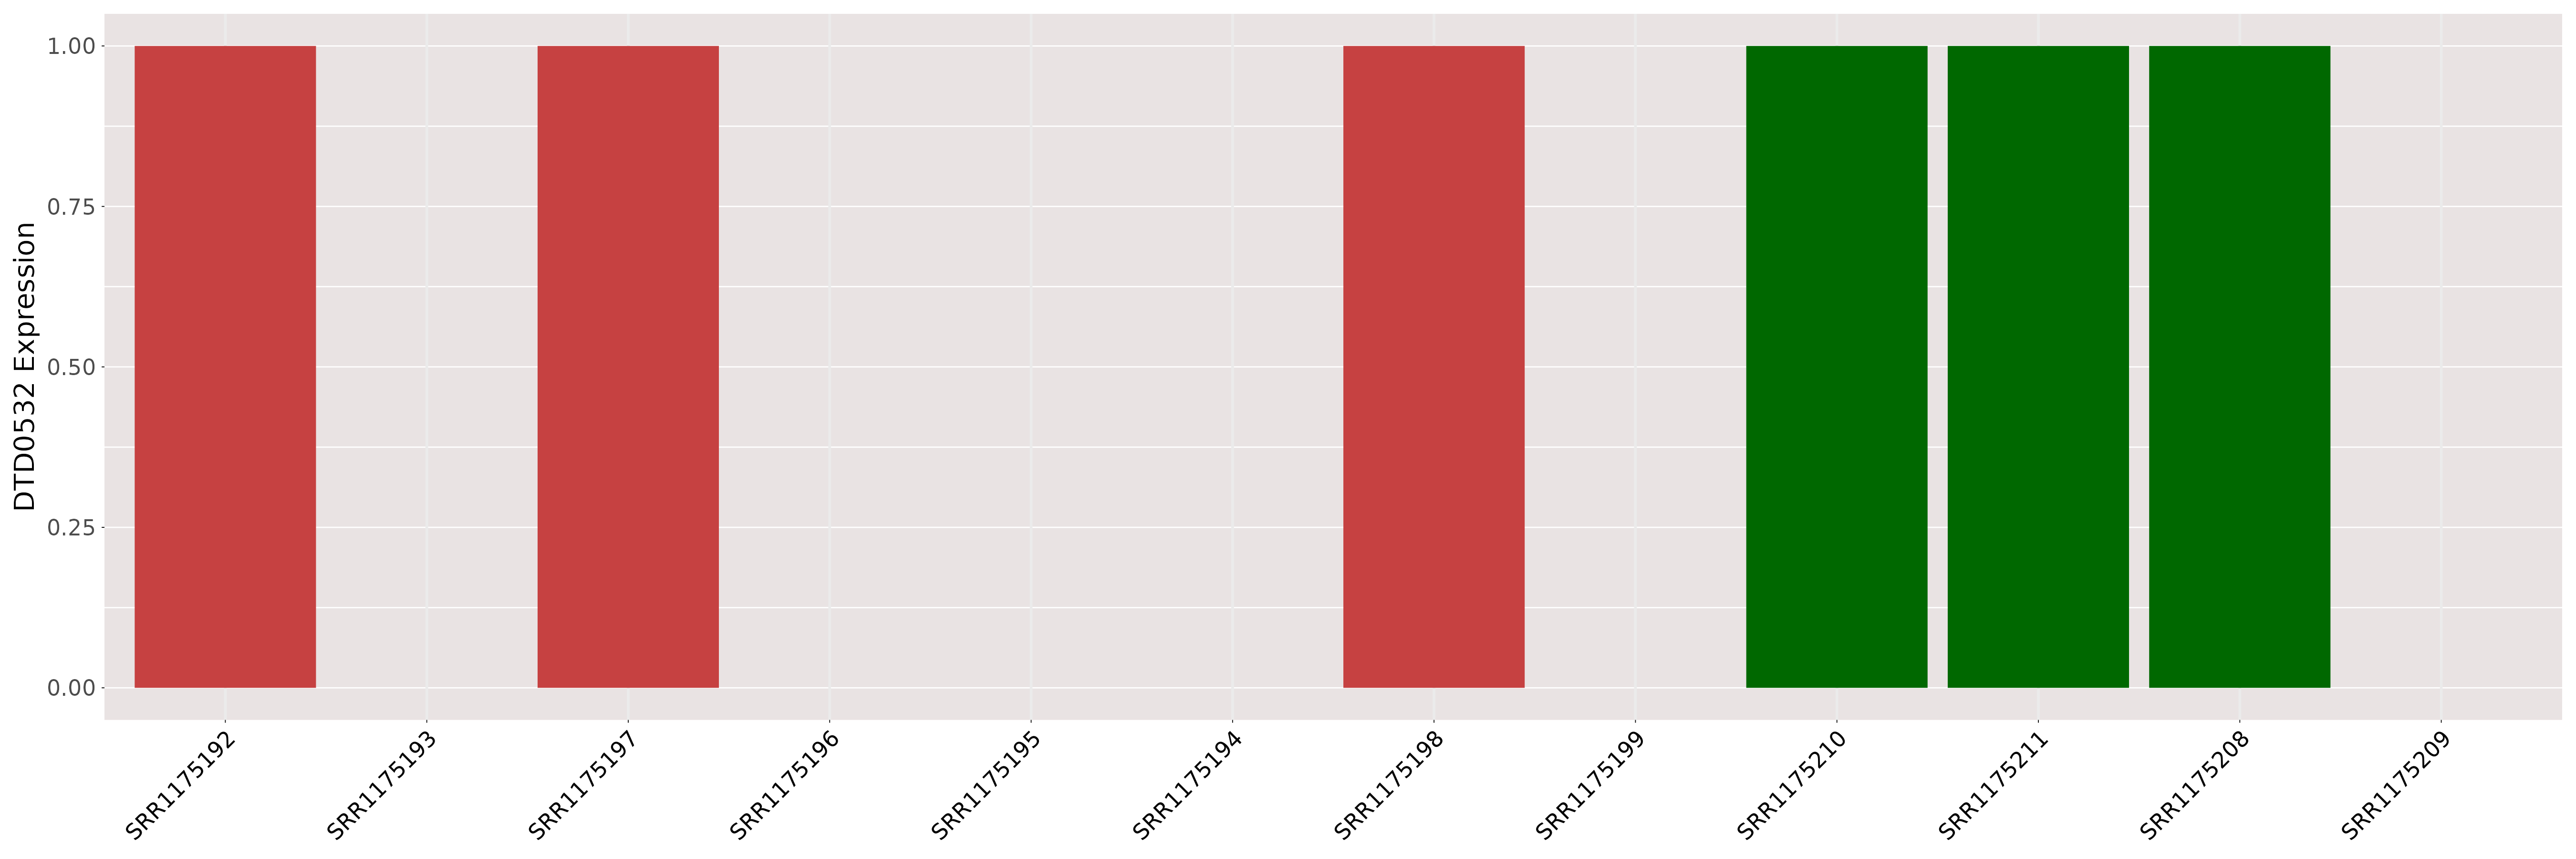
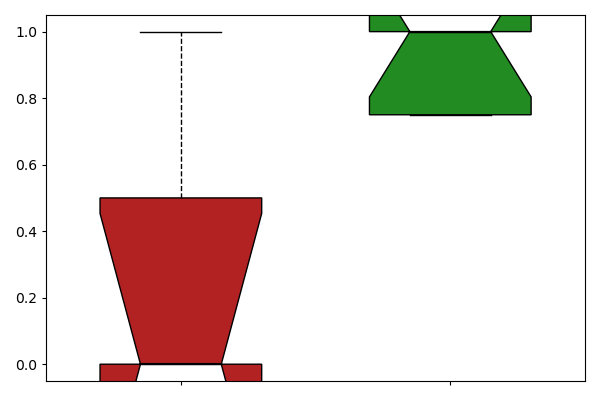
| The Studied Tissue | Colon | ||||
| The Specified Disease | Colorectal cancer [ICD-11:2B91] | ||||
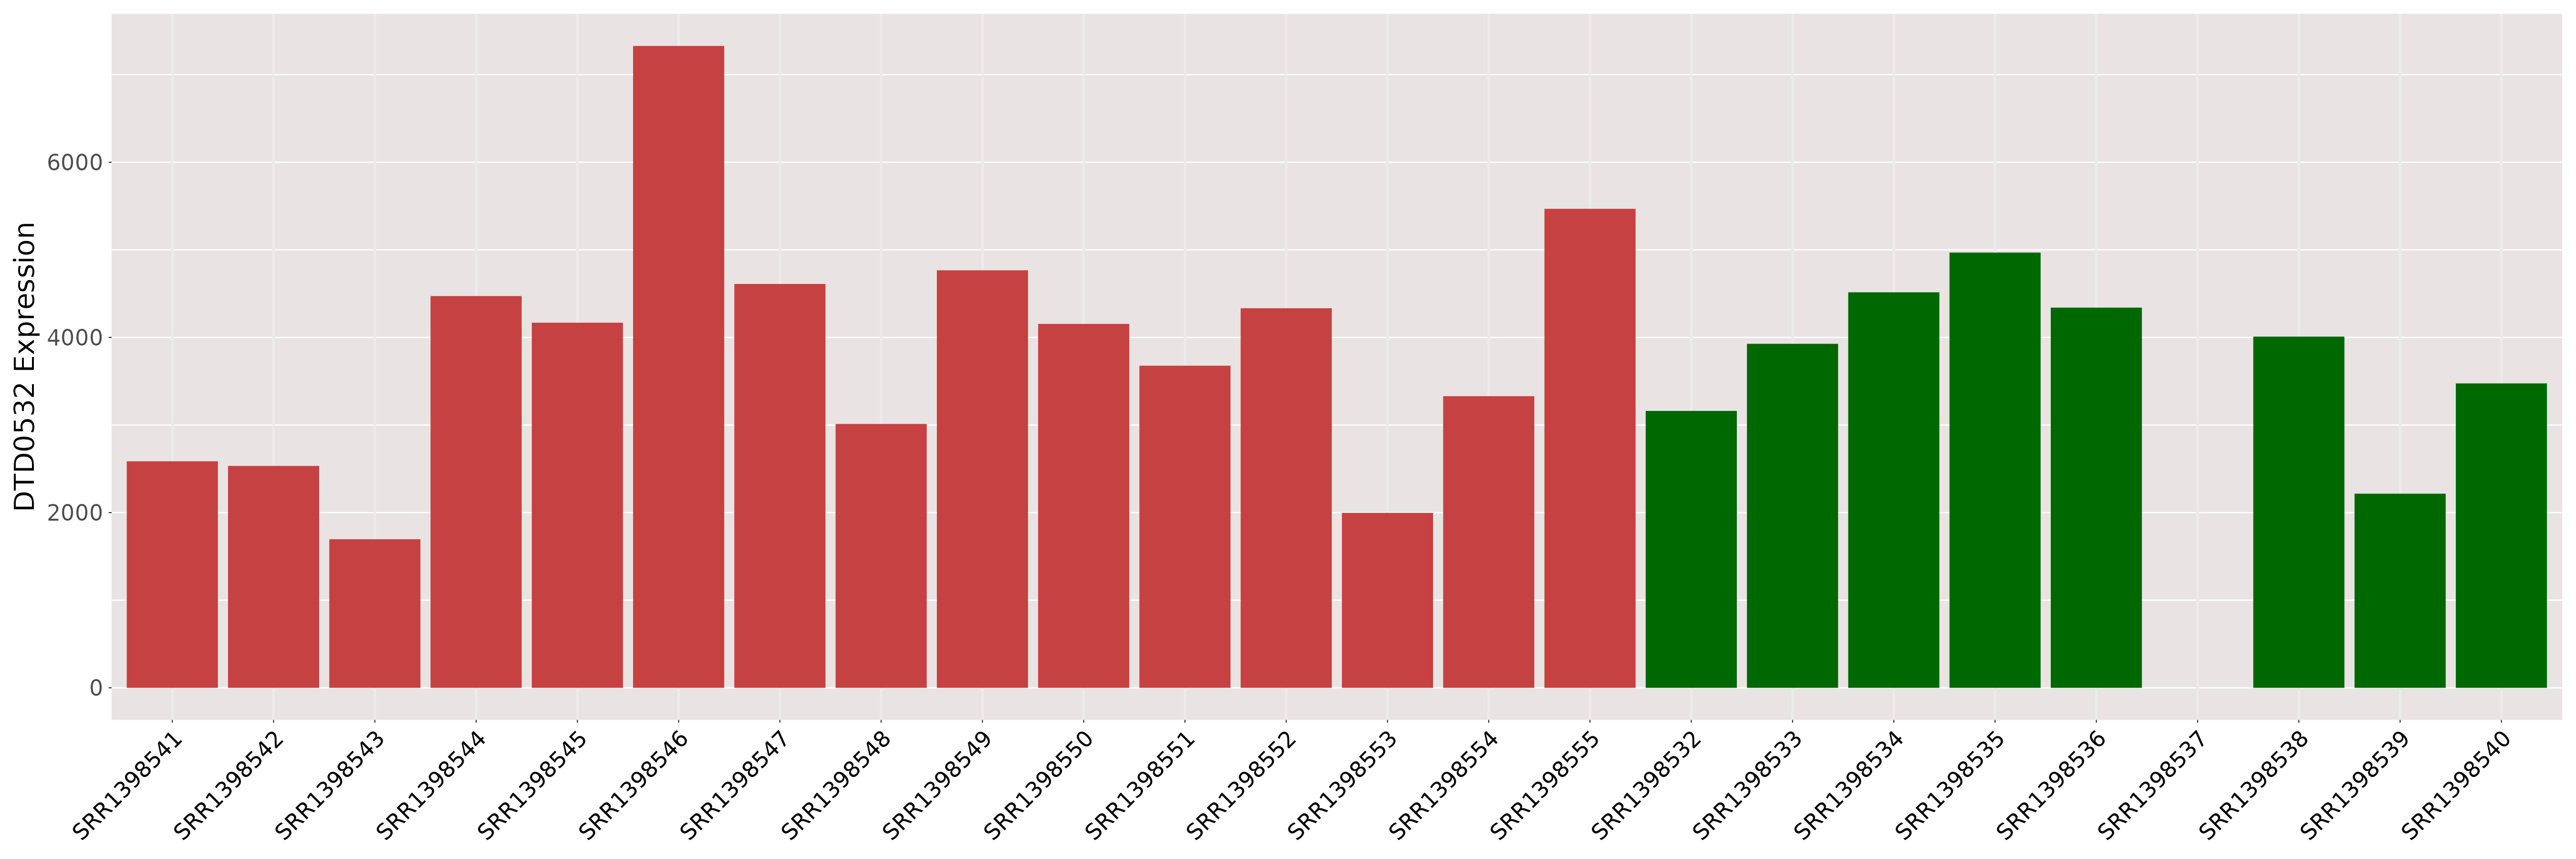
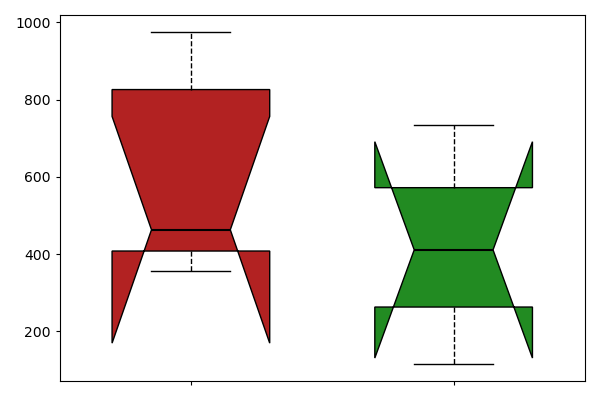
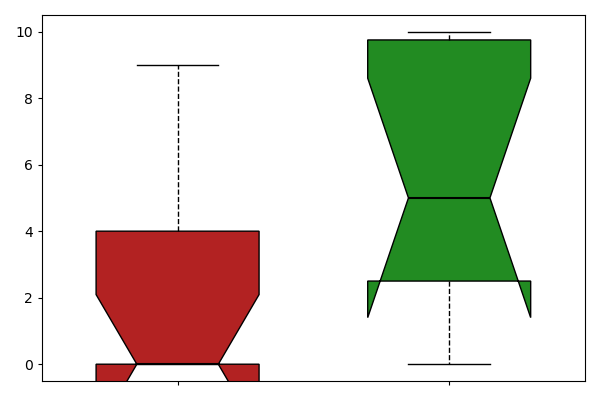
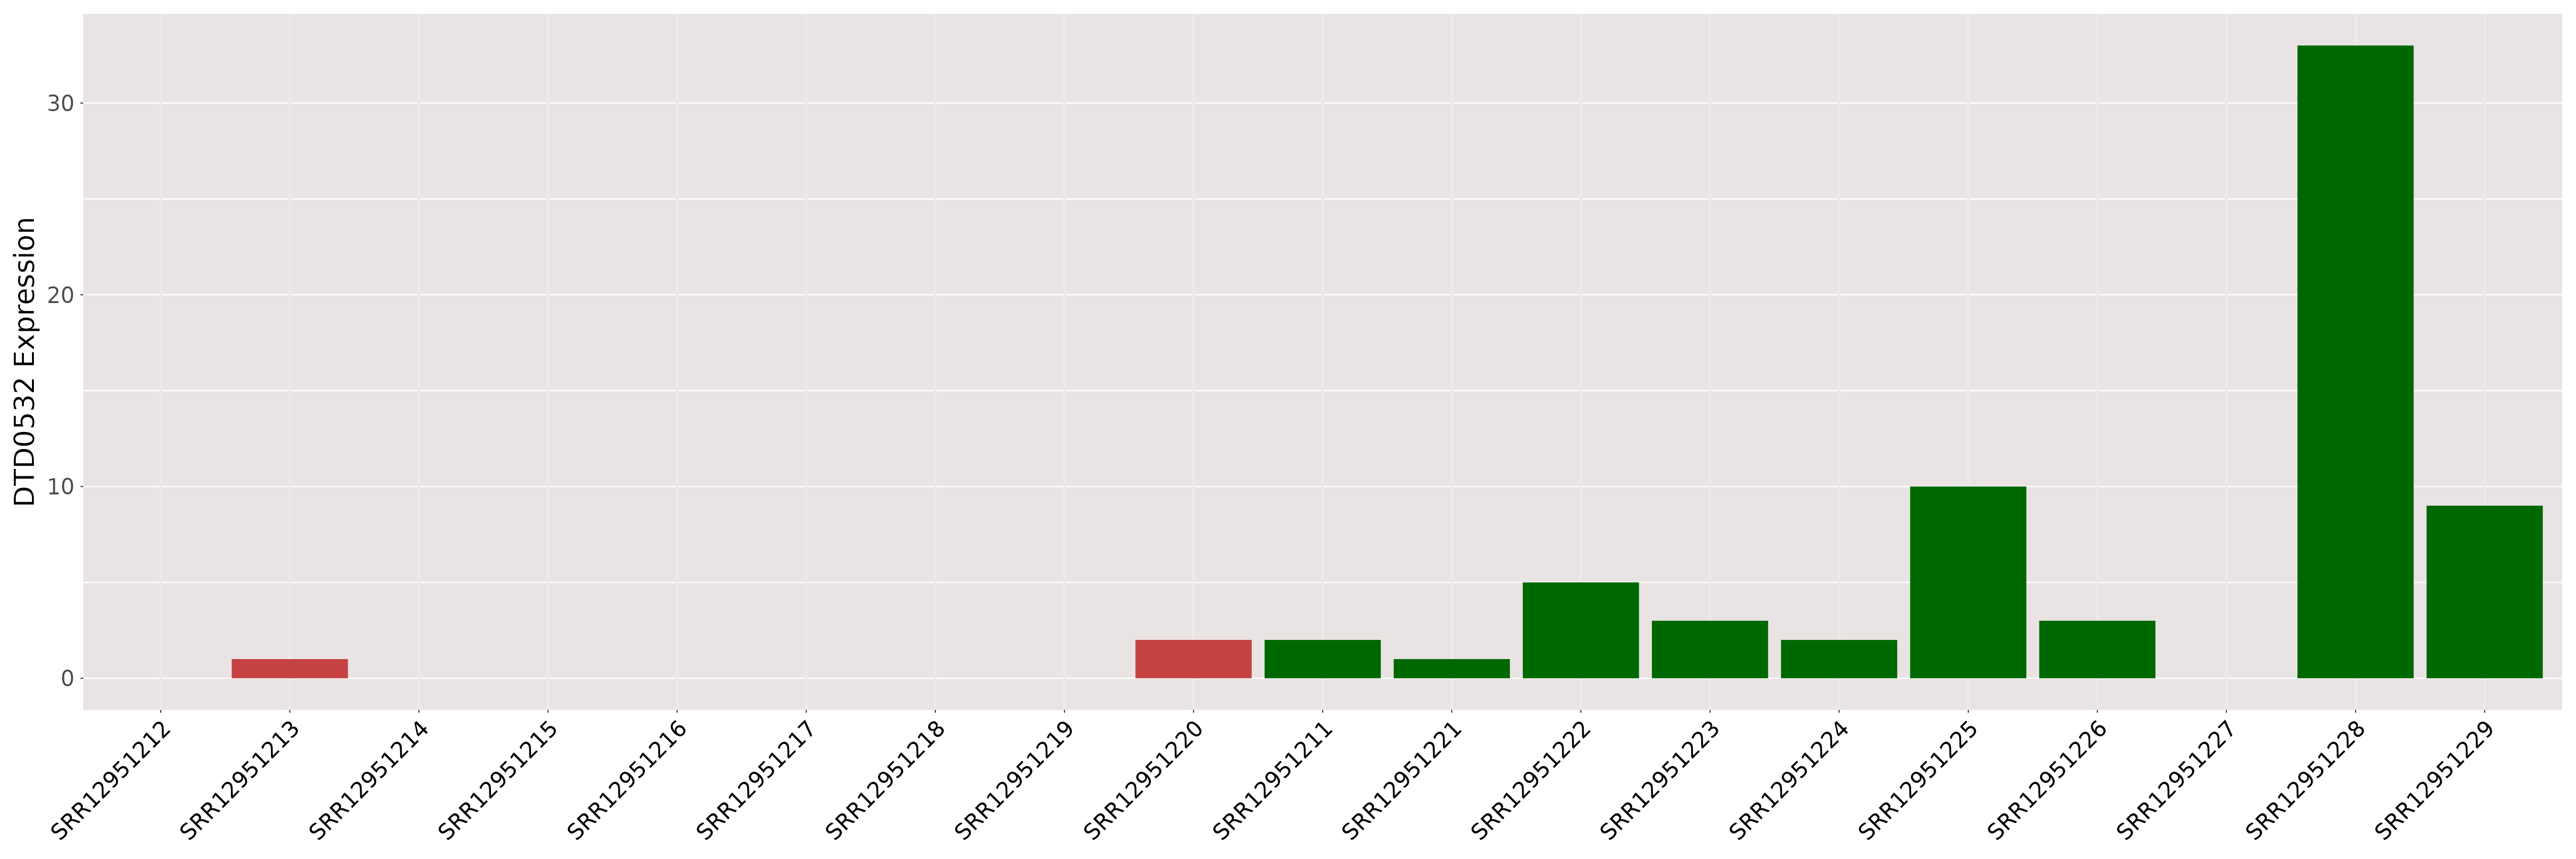
| The Expression Level of Disease Section Compare with the Healthy Individual Tissue | p-value:0.0048877606491107; Fold-change:inf; Z-score:6.331738236133037 | ||||
| DT expression in the diseased tissue of patients
DT expression in the normal tissue of healthy individuals
|
|||||
|
 Please Click the above Thumbnail to View/Download
the Expression Barchart for All Samples Please Click the above Thumbnail to View/Download
the Expression Barchart for All Samples
|
||||
| [+] ICD-11: 2C25 Malignant neoplasms of bronchus or lung | Click to Show/Hide the Full List | ||||
| The Studied Tissue | Saliva | ||||
| The Specified Disease | Lung cancer [ICD-11:2C25] | ||||
| The Expression Level of Disease Section Compare with the Healthy Individual Tissue | p-value:0.3906874693930706; Fold-change:1.2135244108479564; Z-score:0.3732250979492582 | ||||
| DT expression in the diseased tissue of patients
DT expression in the normal tissue of healthy individuals
|
|||||
|
 Please Click the above Thumbnail to View/Download
the Expression Barchart for All Samples Please Click the above Thumbnail to View/Download
the Expression Barchart for All Samples
|
||||
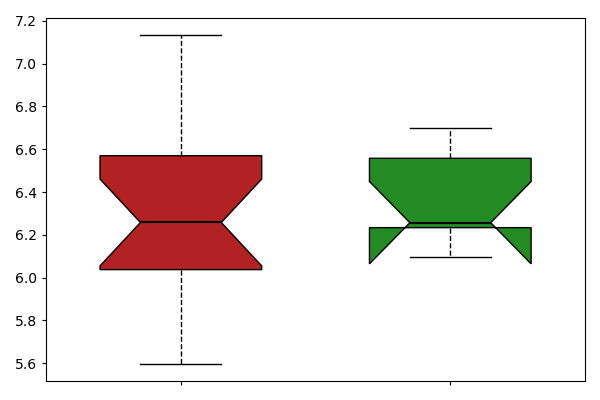
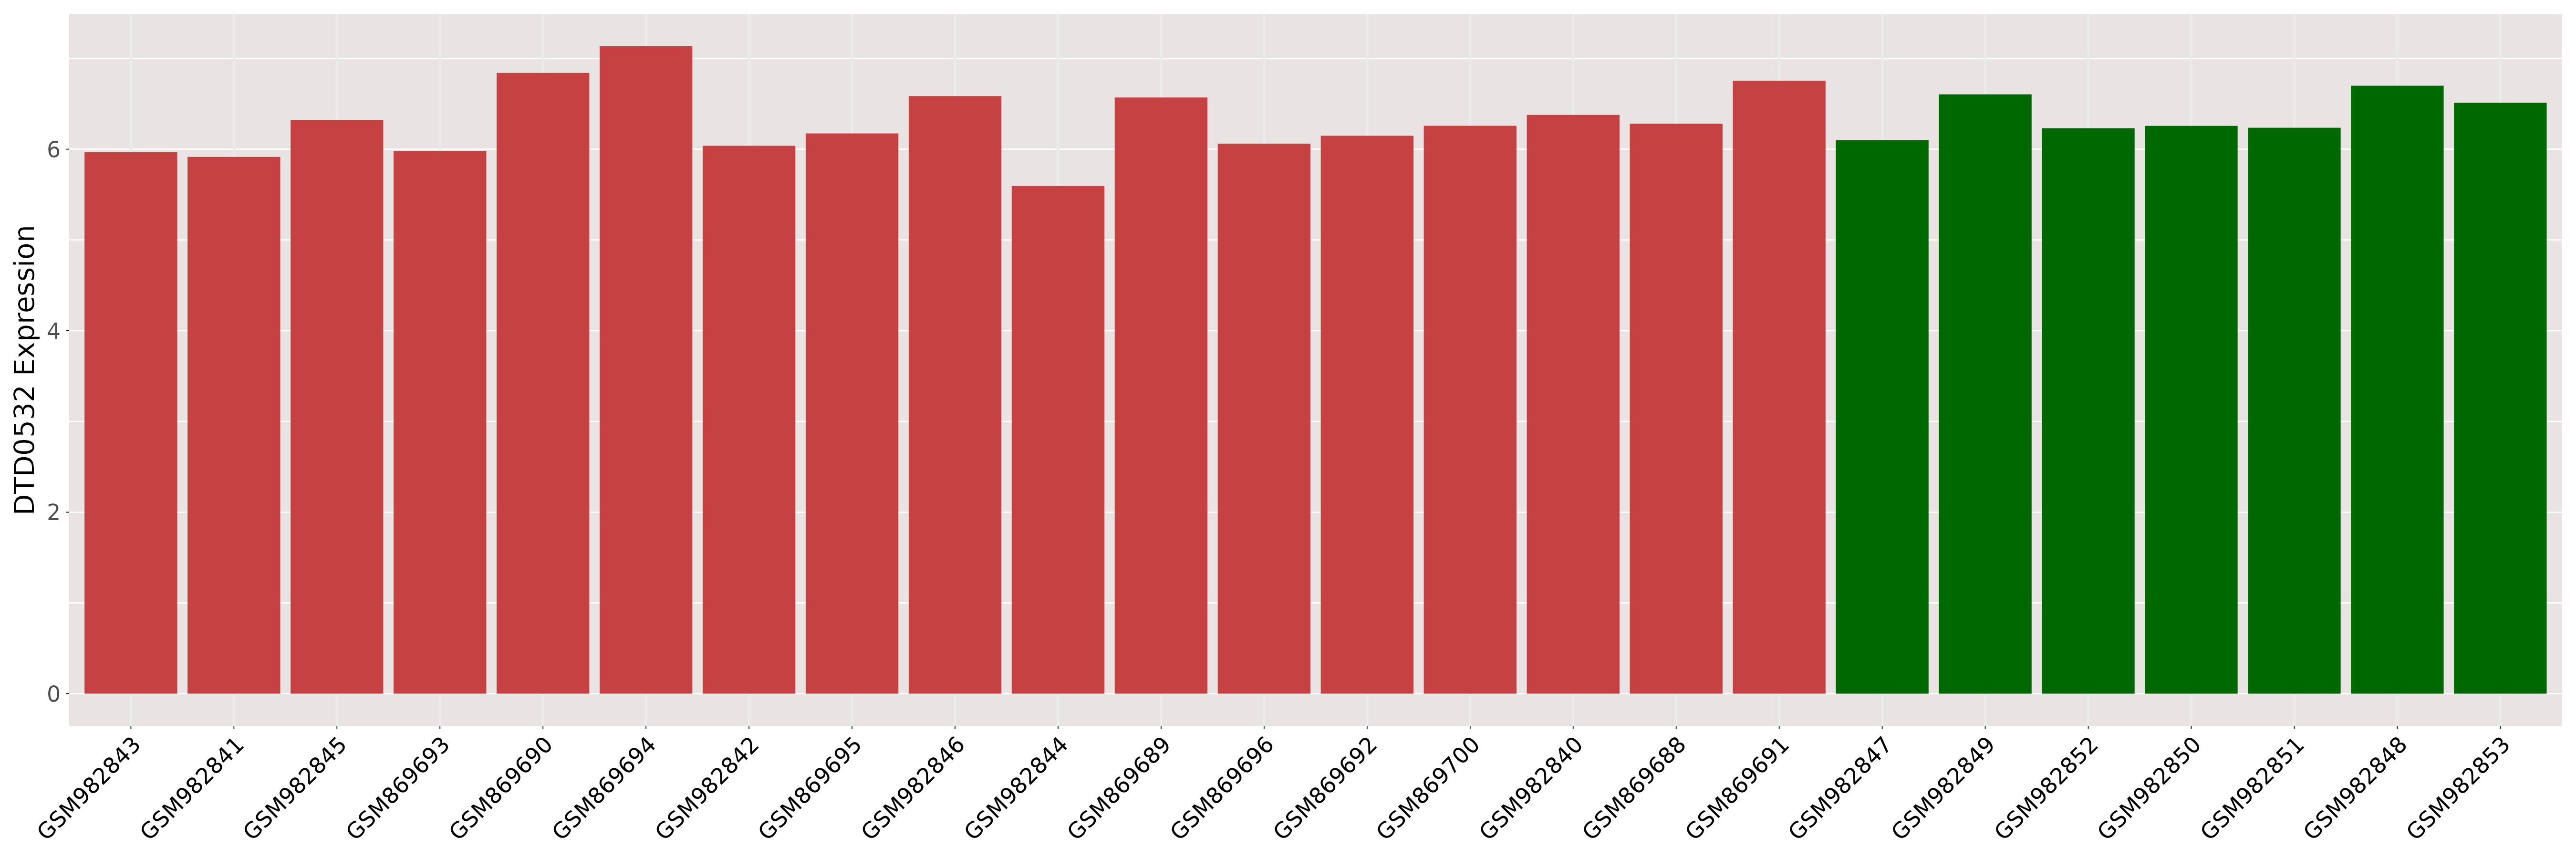
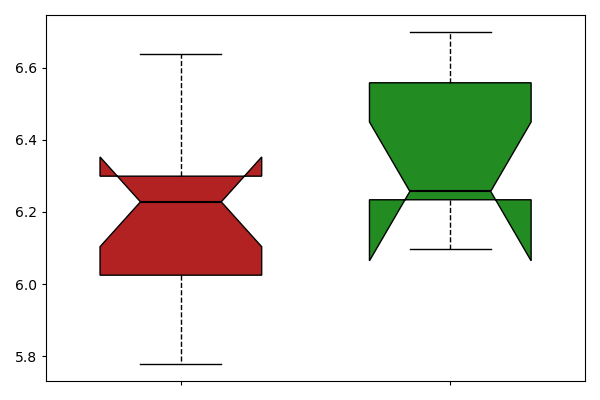
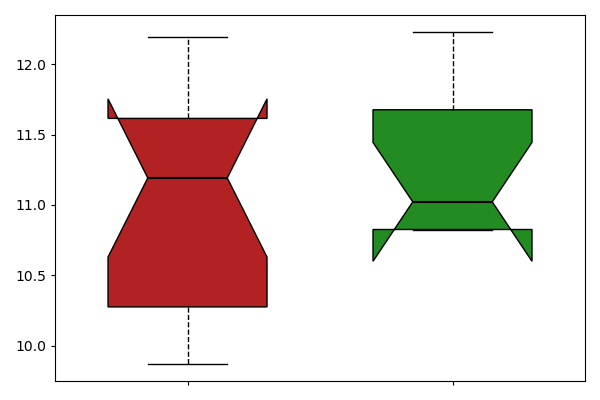
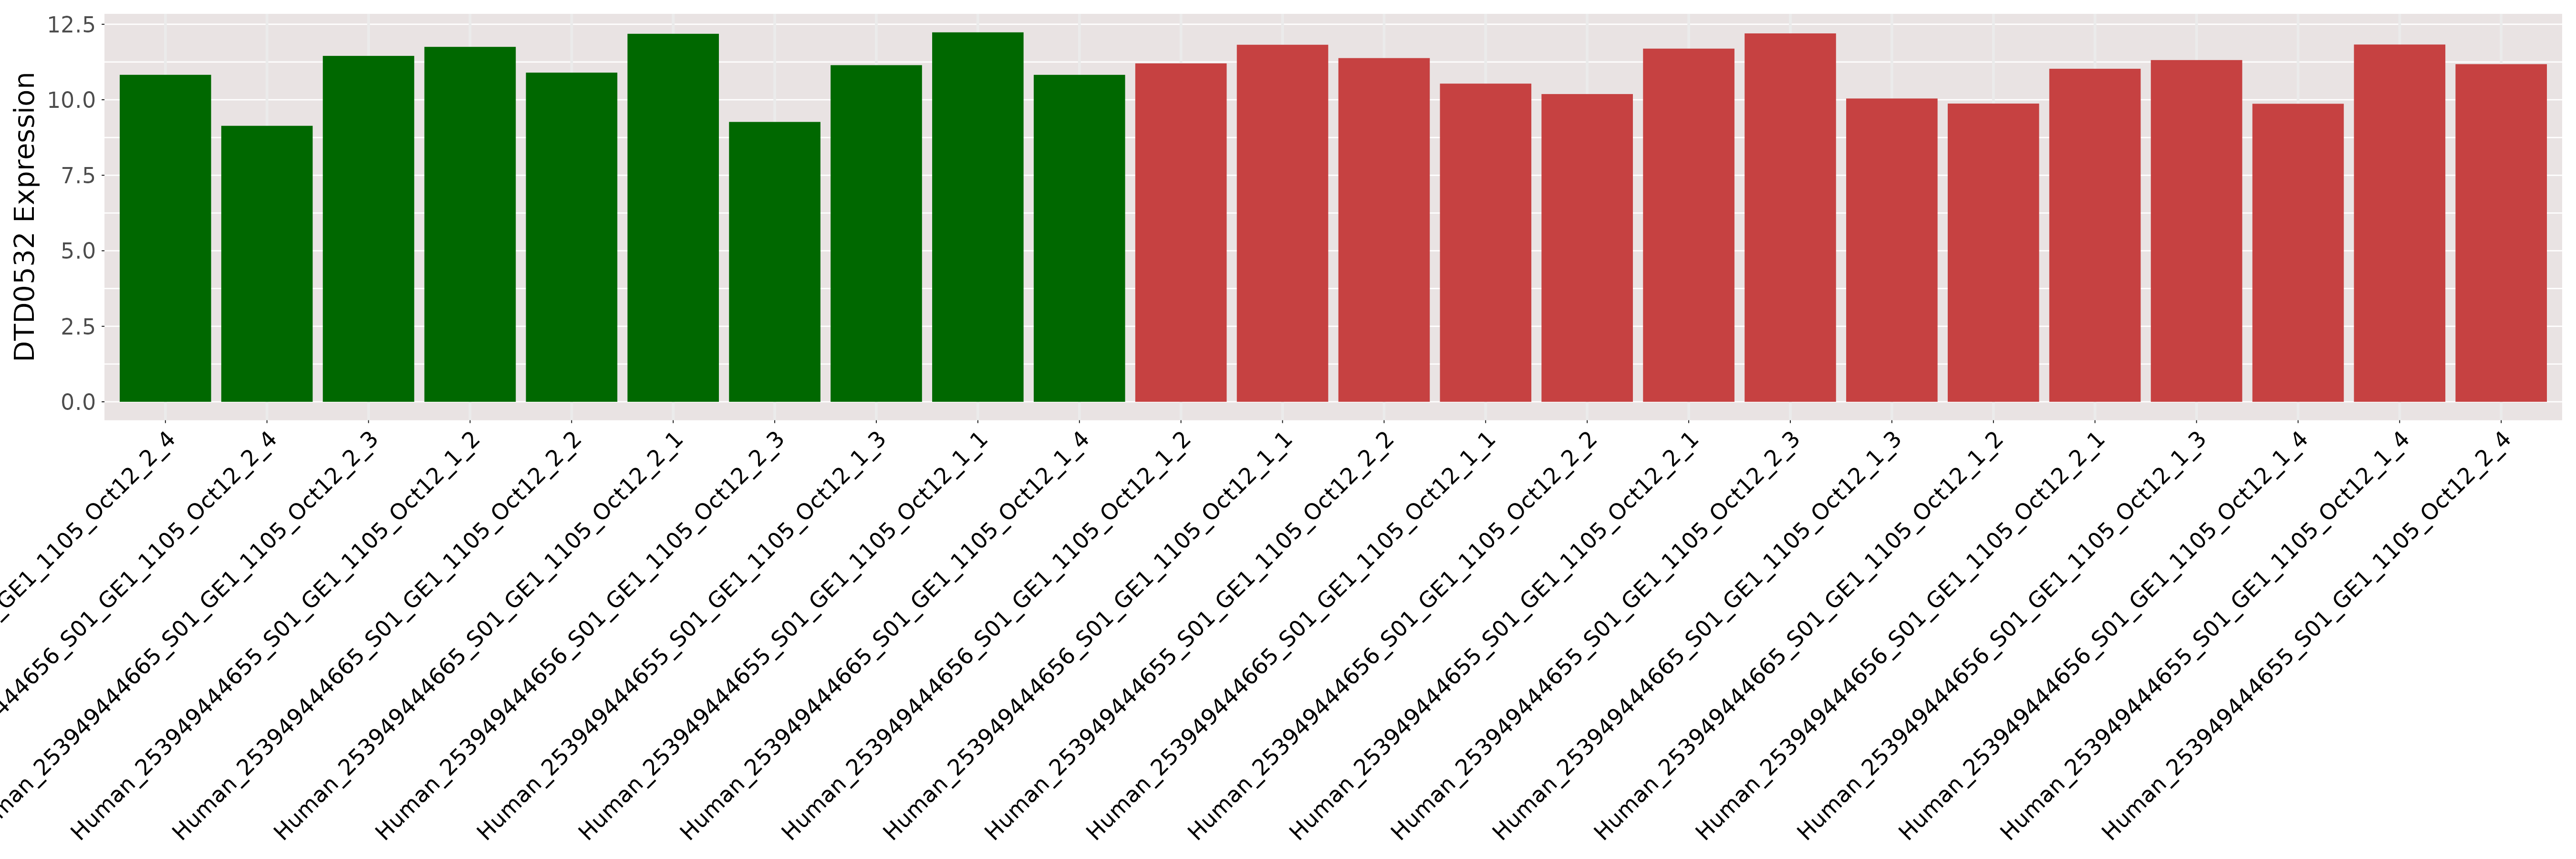
| [+] ICD-11: 2C25.0 Adenocarcinoma of bronchus or lung | Click to Show/Hide the Full List | ||||
| The Studied Tissue | Lung | ||||
| The Specified Disease | Lung adenocarcinoma [ICD-11:2C25] | ||||
| The Expression Level of Disease Section Compare with the Healthy Individual Tissue | p-value:0.0071260626189745; Fold-change:1.0320518376414098; Z-score:0.914108228733442 | ||||
| DT expression in the diseased tissue of patients
DT expression in the normal tissue of healthy individuals
|
|||||

|
 Please Click the above Thumbnail to View/Download
the Expression Barchart for All Samples Please Click the above Thumbnail to View/Download
the Expression Barchart for All Samples
|
||||
| [+] ICD-11: 2C25.0Z Non-small cell carcinoma of lung, unspecified | Click to Show/Hide the Full List | ||||
| The Studied Tissue | Lung | ||||
| The Specified Disease | Non small cell lung cancer [ICD-11:2C25] | ||||
| The Expression Level of Disease Section Compare with the Healthy Individual Tissue | p-value:0.1720714956227927; Fold-change:0.989432940255648; Z-score:-0.252119499 | ||||
| DT expression in the diseased tissue of patients
DT expression in the normal tissue of healthy individuals
|
|||||

|
 Please Click the above Thumbnail to View/Download
the Expression Barchart for All Samples Please Click the above Thumbnail to View/Download
the Expression Barchart for All Samples
|
||||
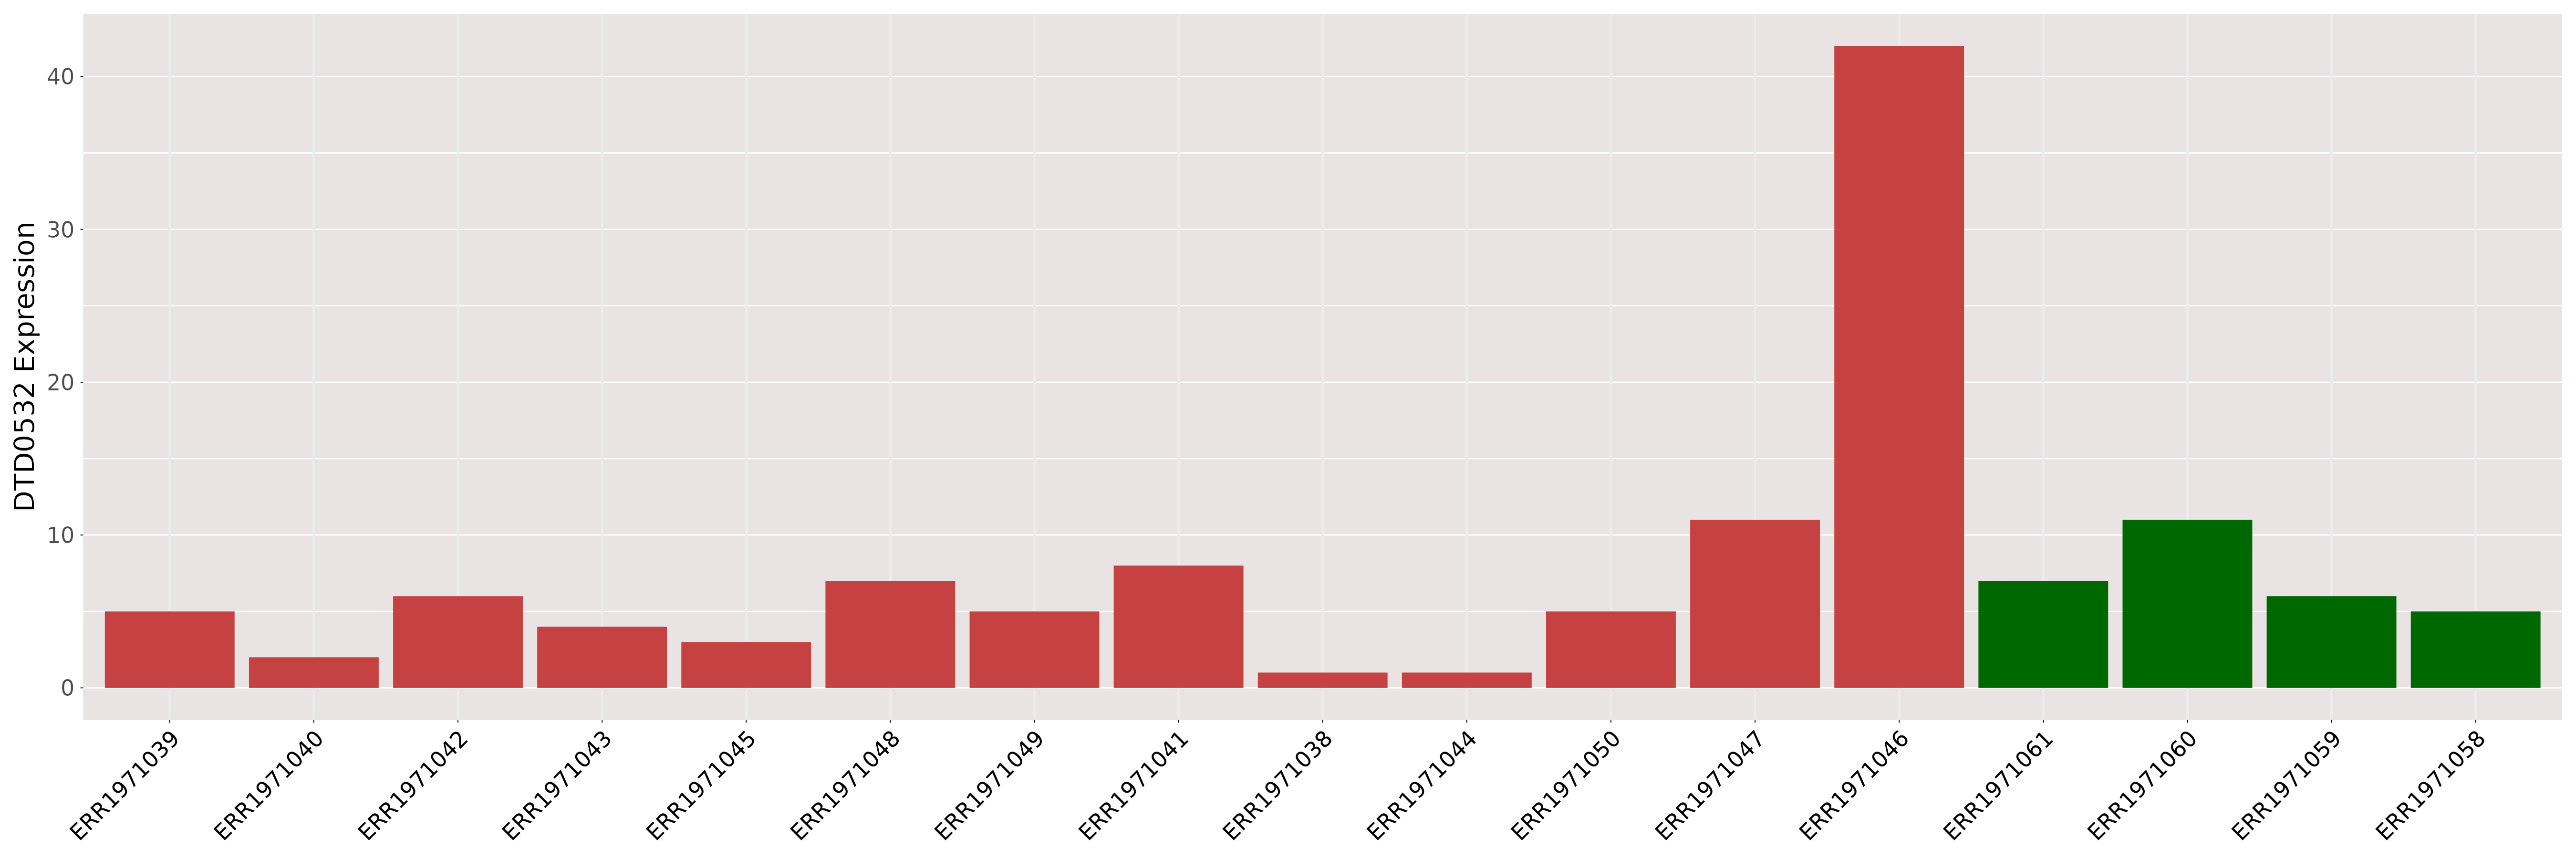
| [+] ICD-11: 2C25.1 Small cell carcinoma of bronchus or lung | Click to Show/Hide the Full List | ||||
| The Studied Tissue | Lung | ||||
| The Specified Disease | Small cell lung carcinoma [ICD-11:2C25] | ||||
| The Expression Level of Disease Section Compare with the Healthy Individual Tissue | p-value:0.377895993026118; Fold-change:1.3333333333333333; Z-score:3.7566763641553536 | ||||
| DT expression in the diseased tissue of patients
DT expression in the normal tissue of healthy individuals
|
|||||
|
 Please Click the above Thumbnail to View/Download
the Expression Barchart for All Samples Please Click the above Thumbnail to View/Download
the Expression Barchart for All Samples
|
||||
| [+] ICD-11: 2C31 Squamous cell carcinoma of skin | Click to Show/Hide the Full List | ||||
| The Studied Tissue | Skin | ||||
| The Specified Disease | Squamous cell carcinoma [ICD-11:2C31.Z] | ||||
| The Expression Level of Disease Section Compare with the Healthy Individual Tissue | p-value:0.2677957435305225; Fold-change:1.3846153846153846; Z-score:0.991325791891862 | ||||
| DT expression in the diseased tissue of patients
DT expression in the normal tissue of healthy individuals
|
|||||

|
 Please Click the above Thumbnail to View/Download
the Expression Barchart for All Samples Please Click the above Thumbnail to View/Download
the Expression Barchart for All Samples
|
||||
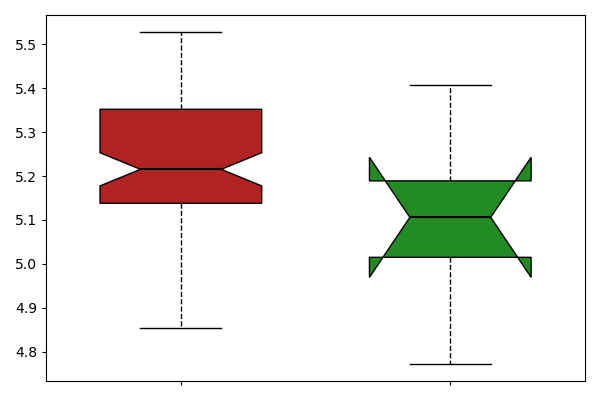
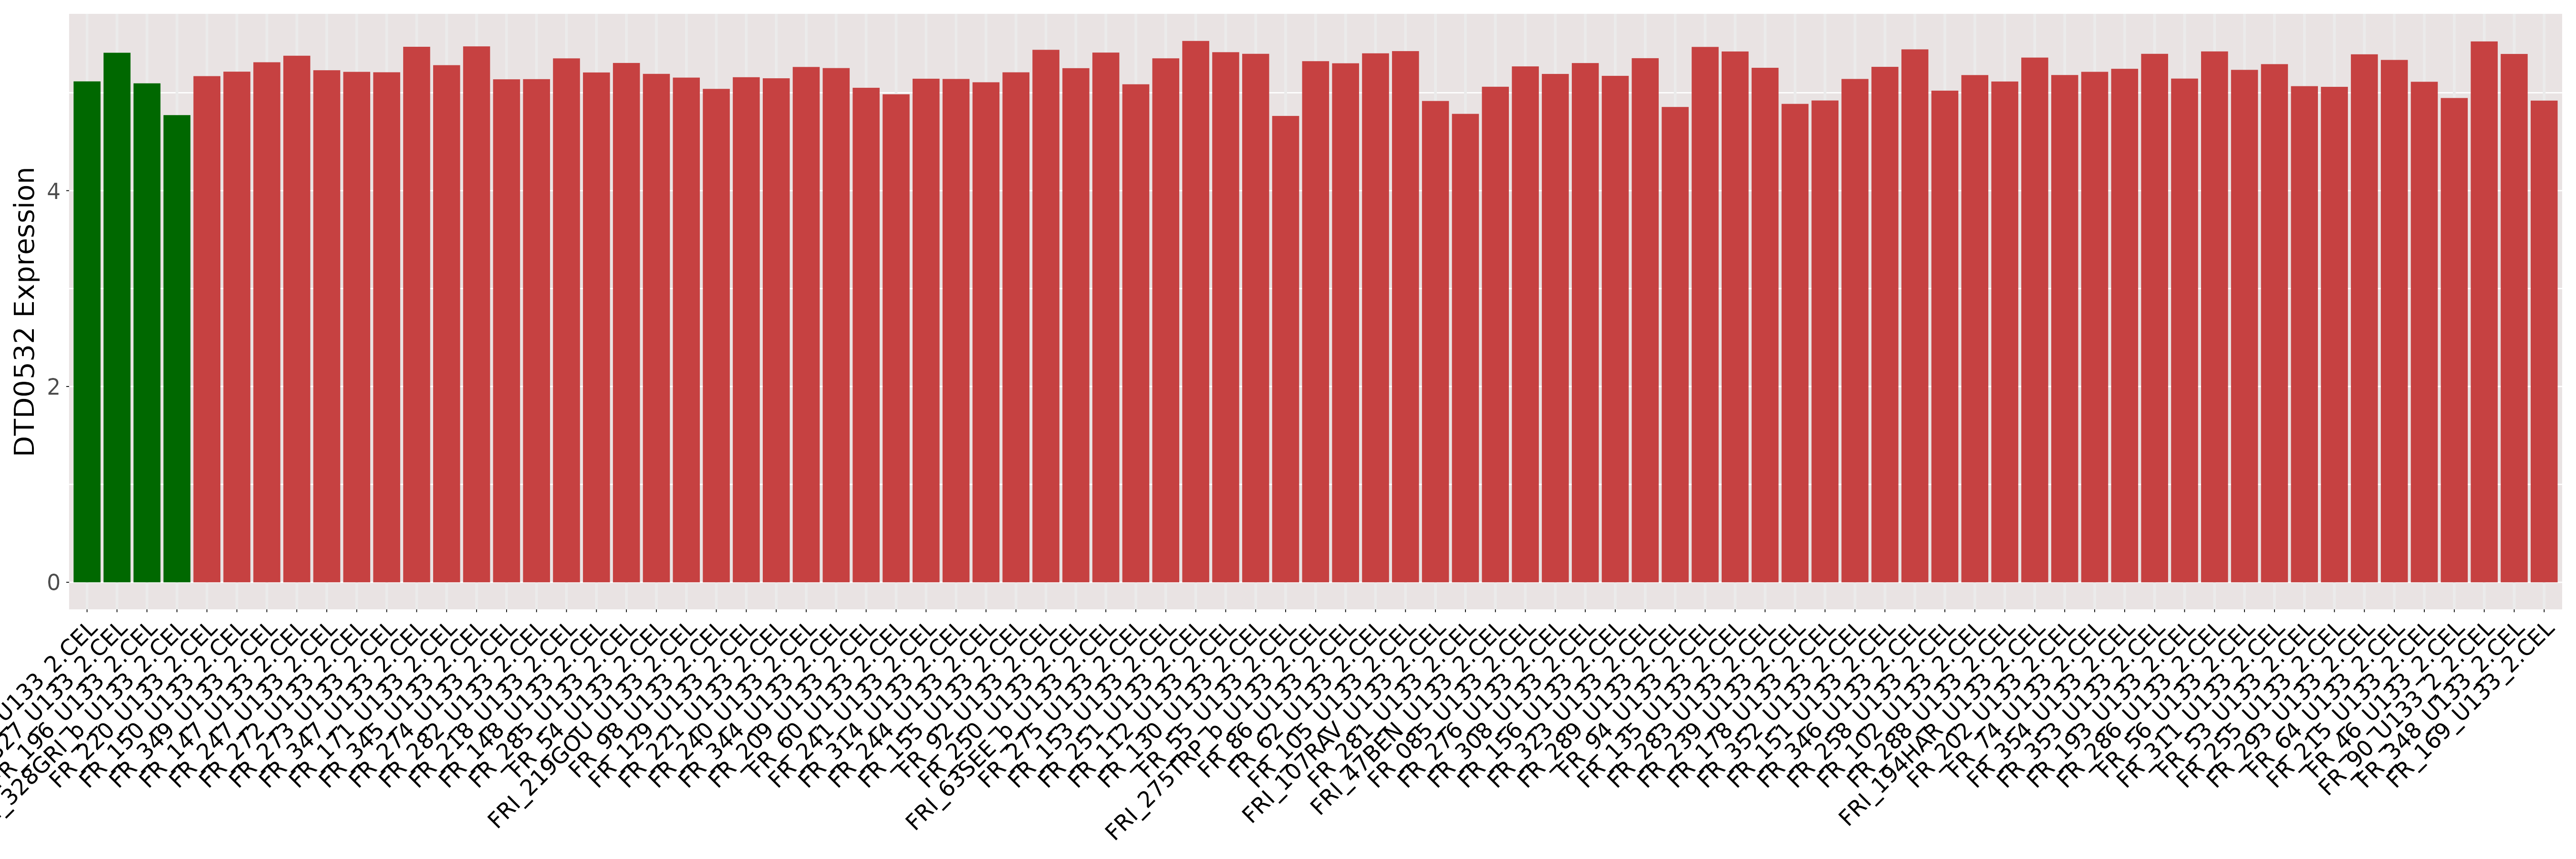
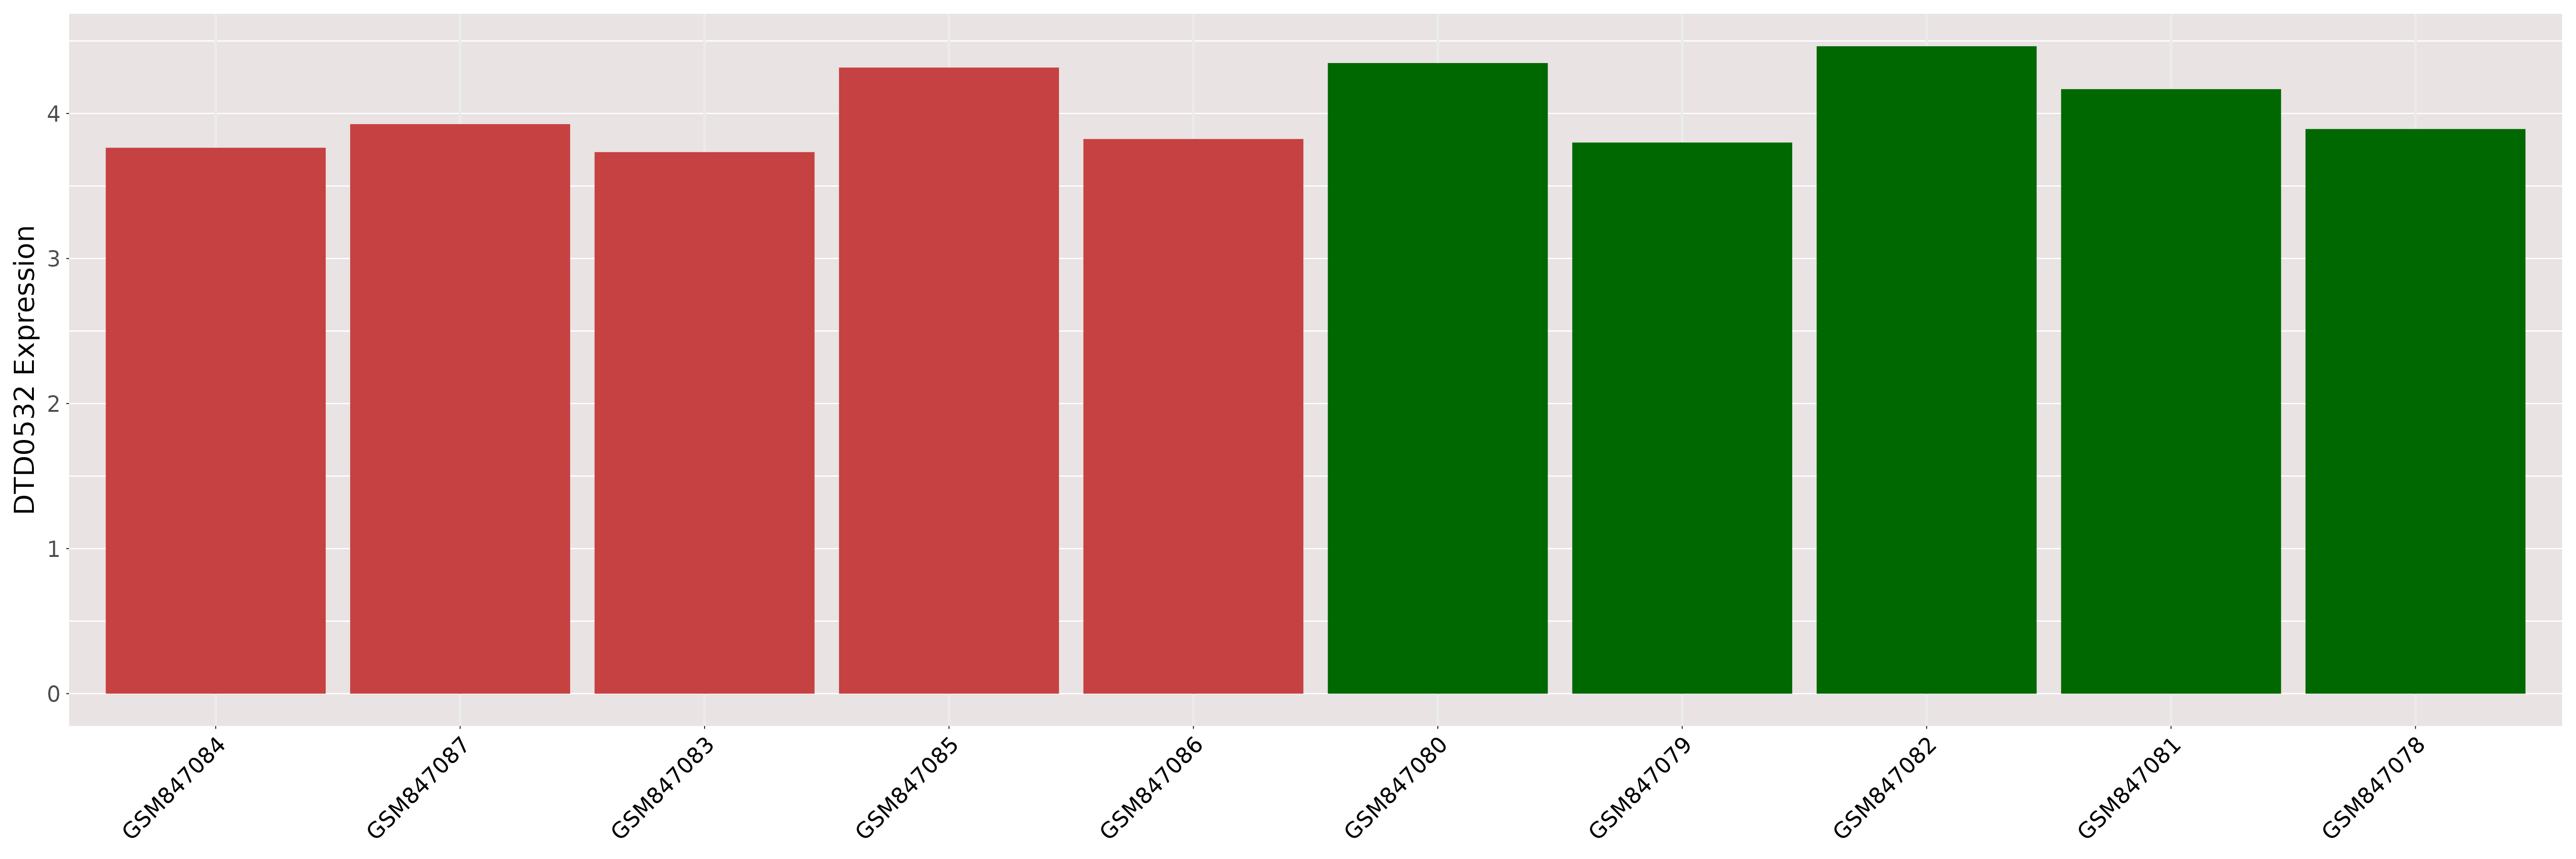
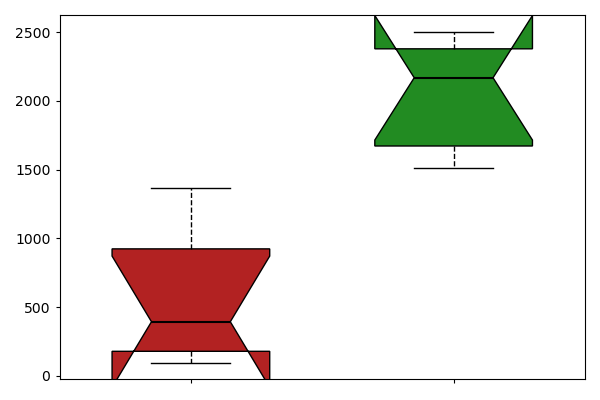
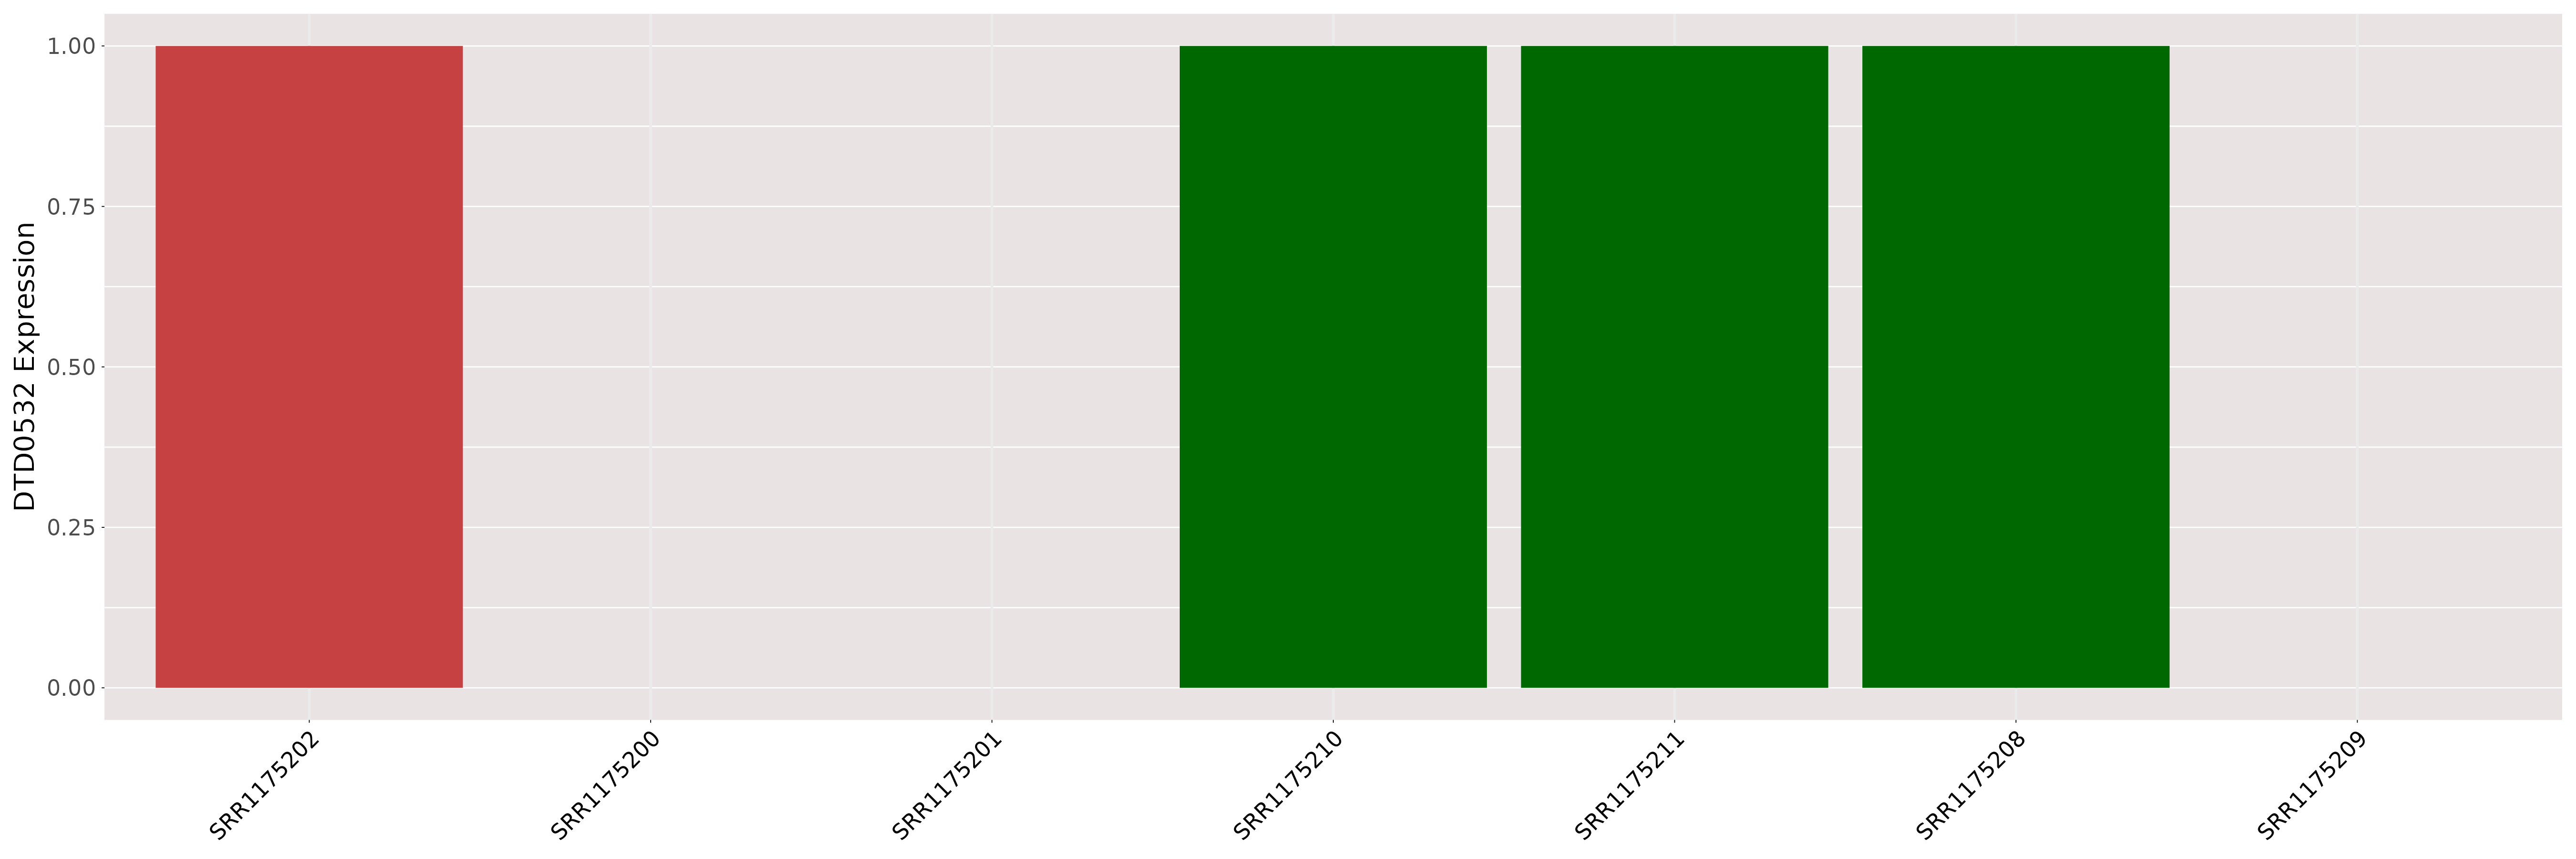
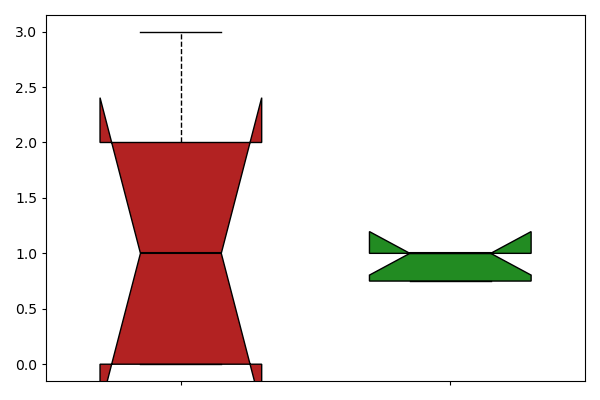
| [+] ICD-11: 2C90 Malignant neoplasm of kidney, except renal pelvis (clear cell type) | Click to Show/Hide the Full List | ||||
| The Studied Tissue | Kidney | ||||
| The Specified Disease | Clear cell renal carcinomas [ICD-11:2C90] | ||||
| The Expression Level of Disease Section Compare with the Healthy Individual Tissue | p-value:0.0018895248115863; Fold-change:0.9660775887537216; Z-score:-1.411321085 | ||||
| DT expression in the diseased tissue of patients
DT expression in the normal tissue of healthy individuals
|
|||||
|
|
|
||||
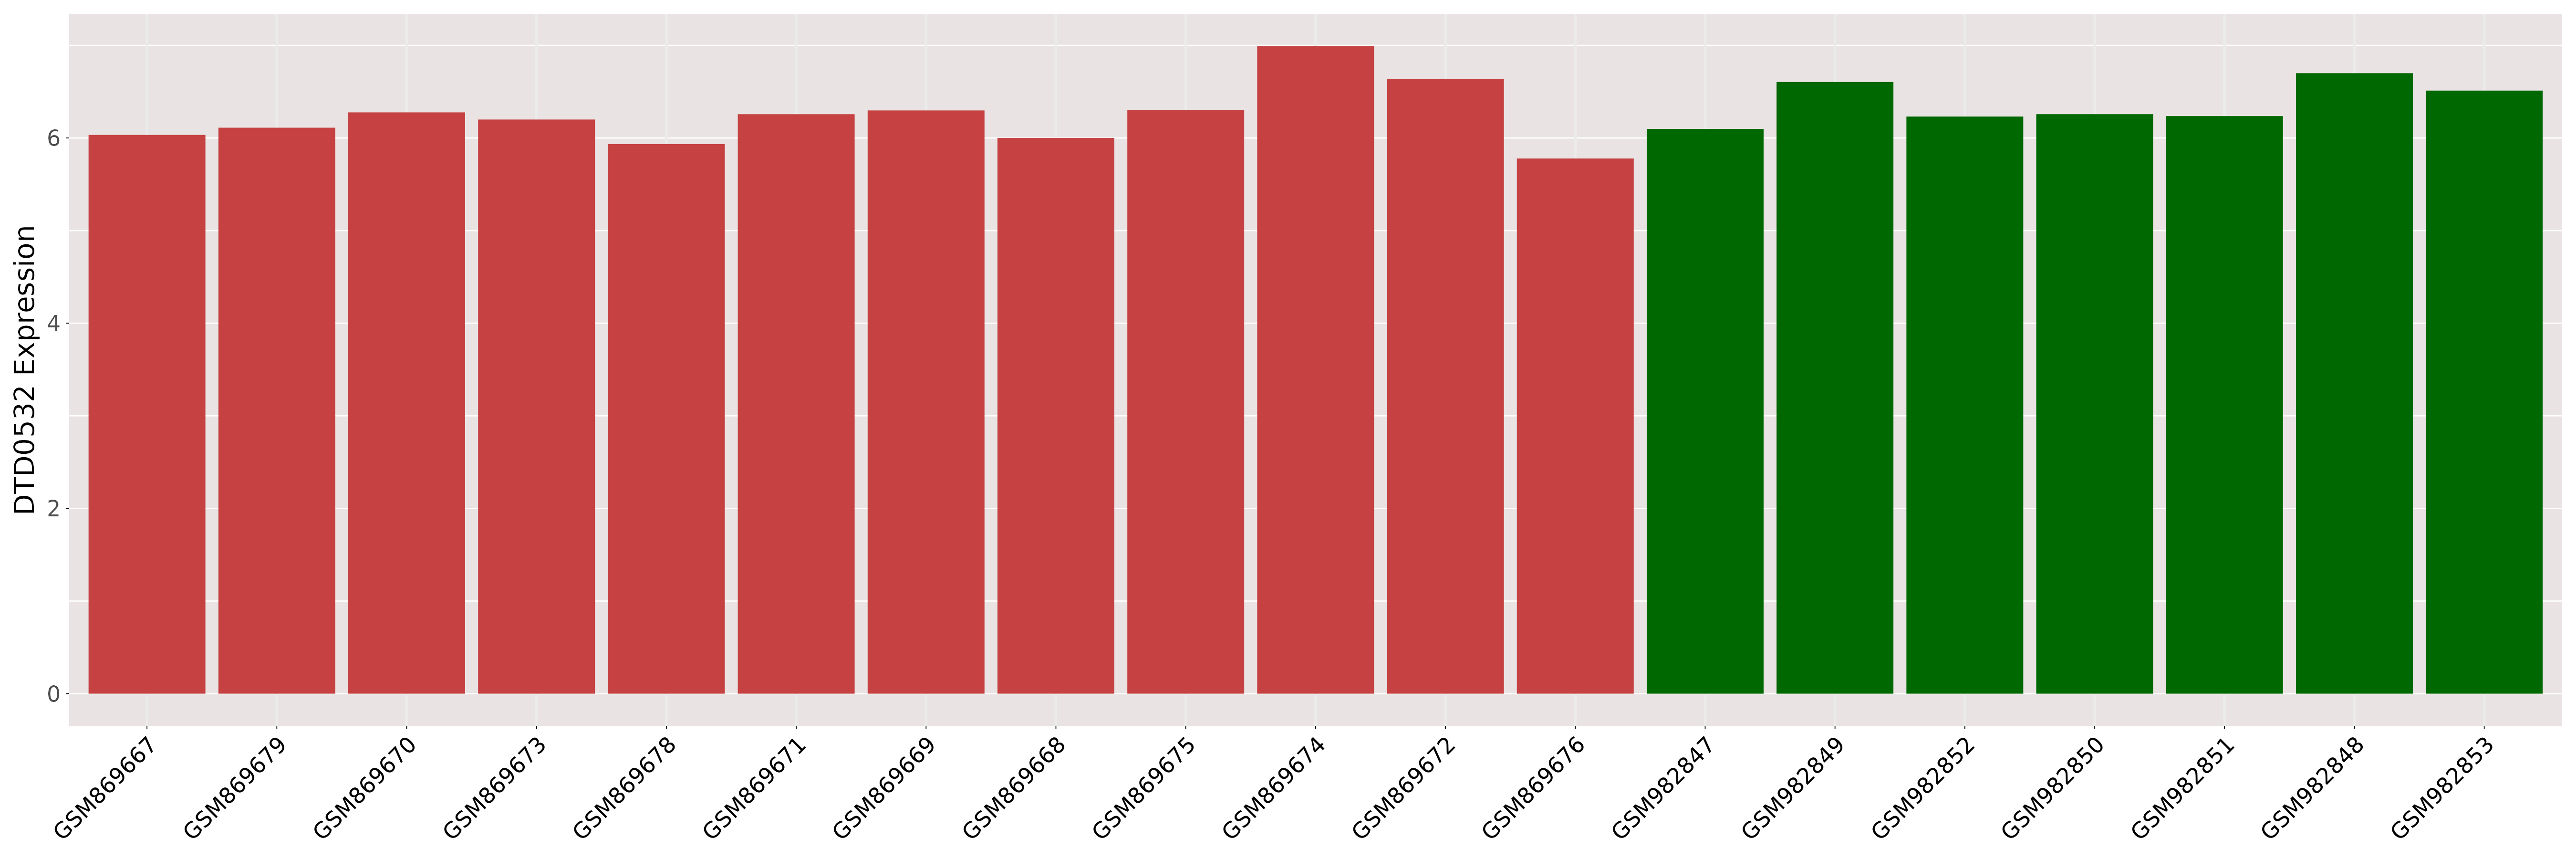
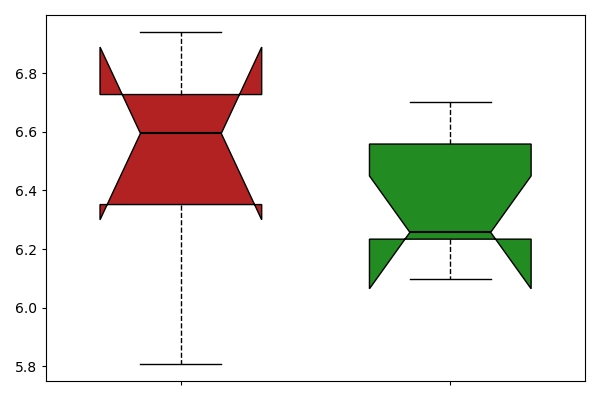
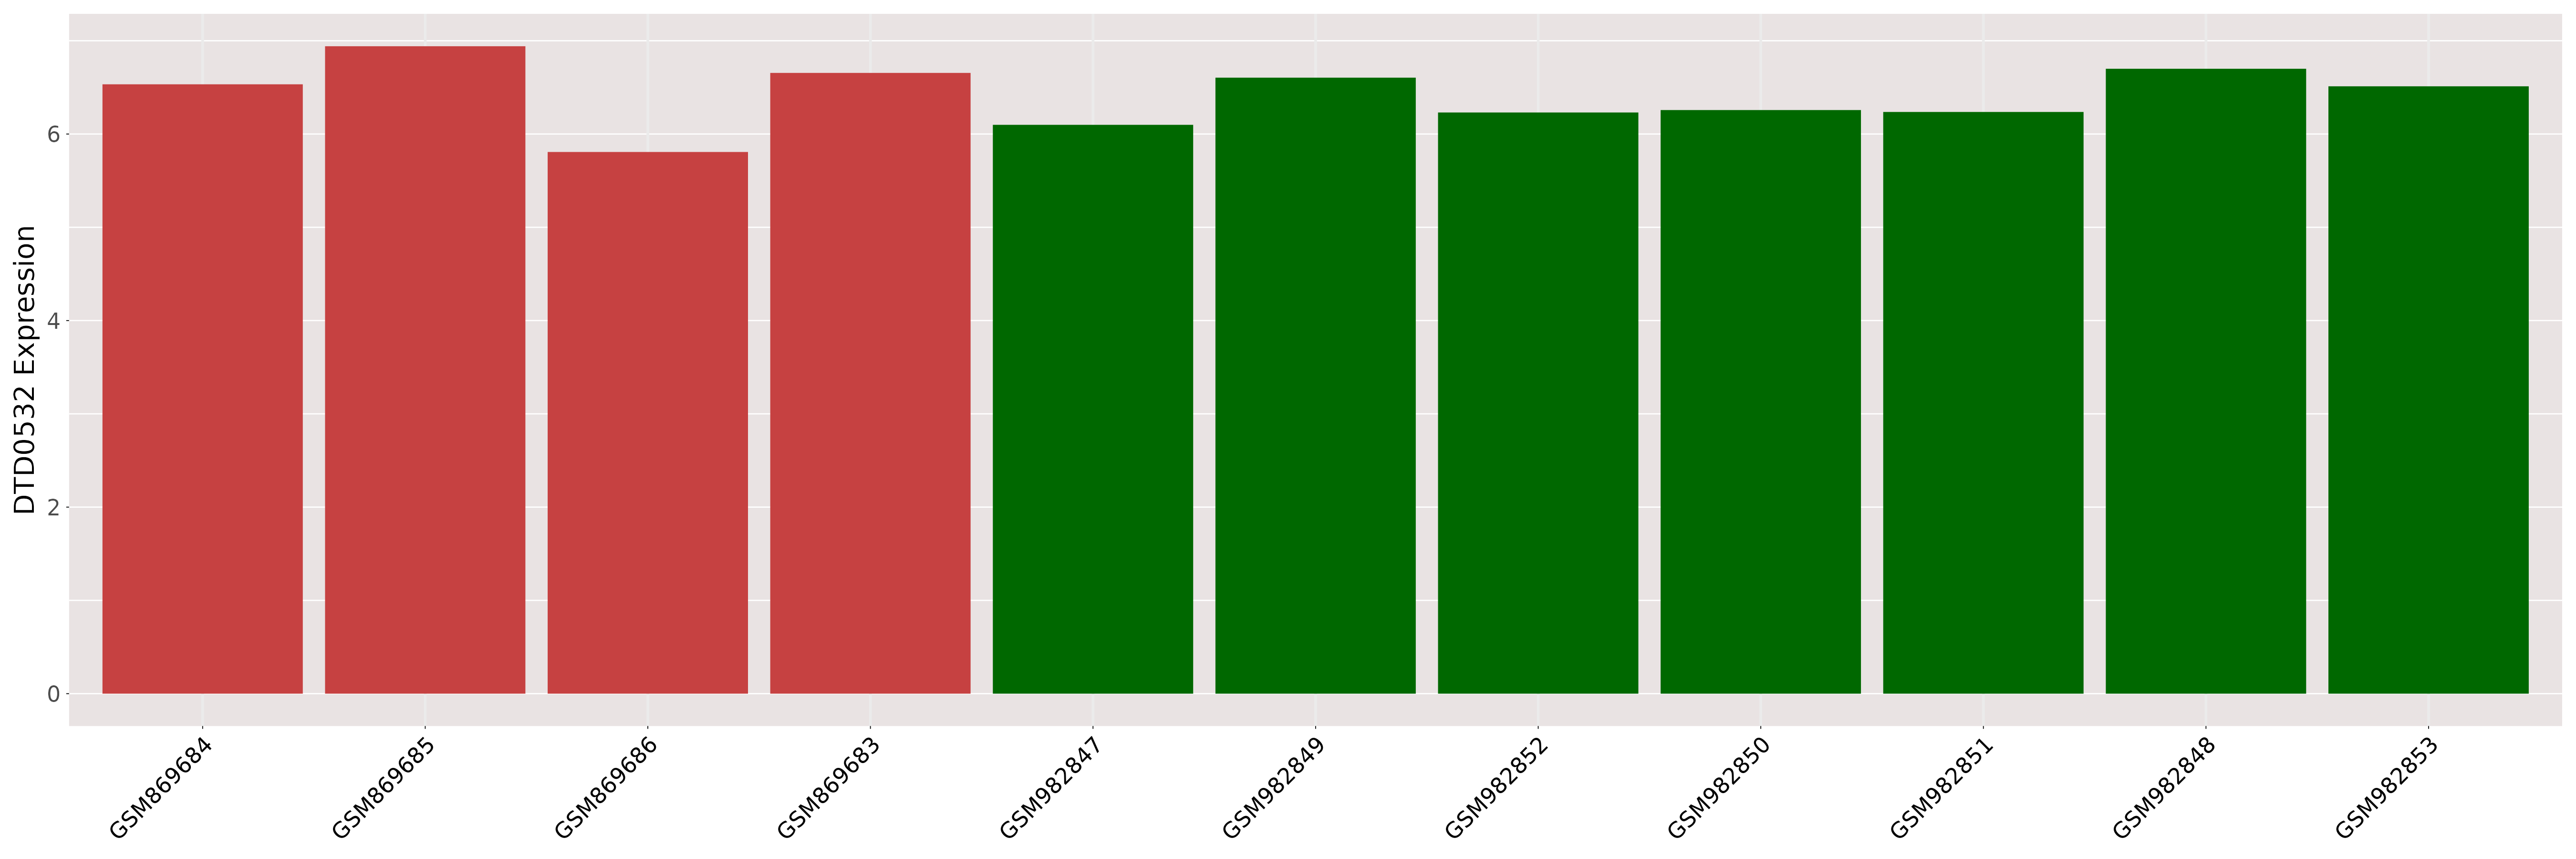
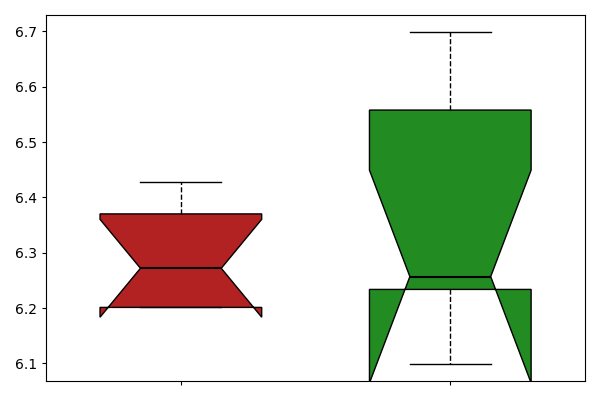
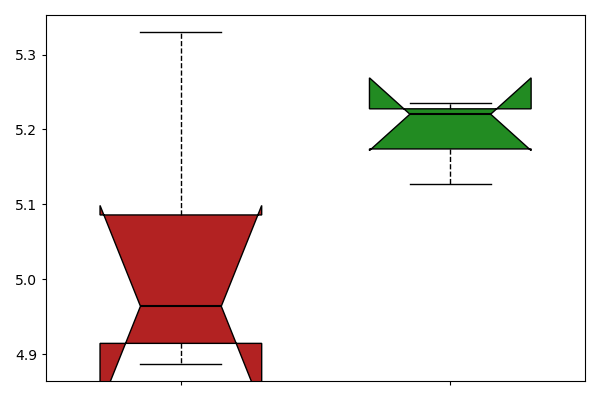
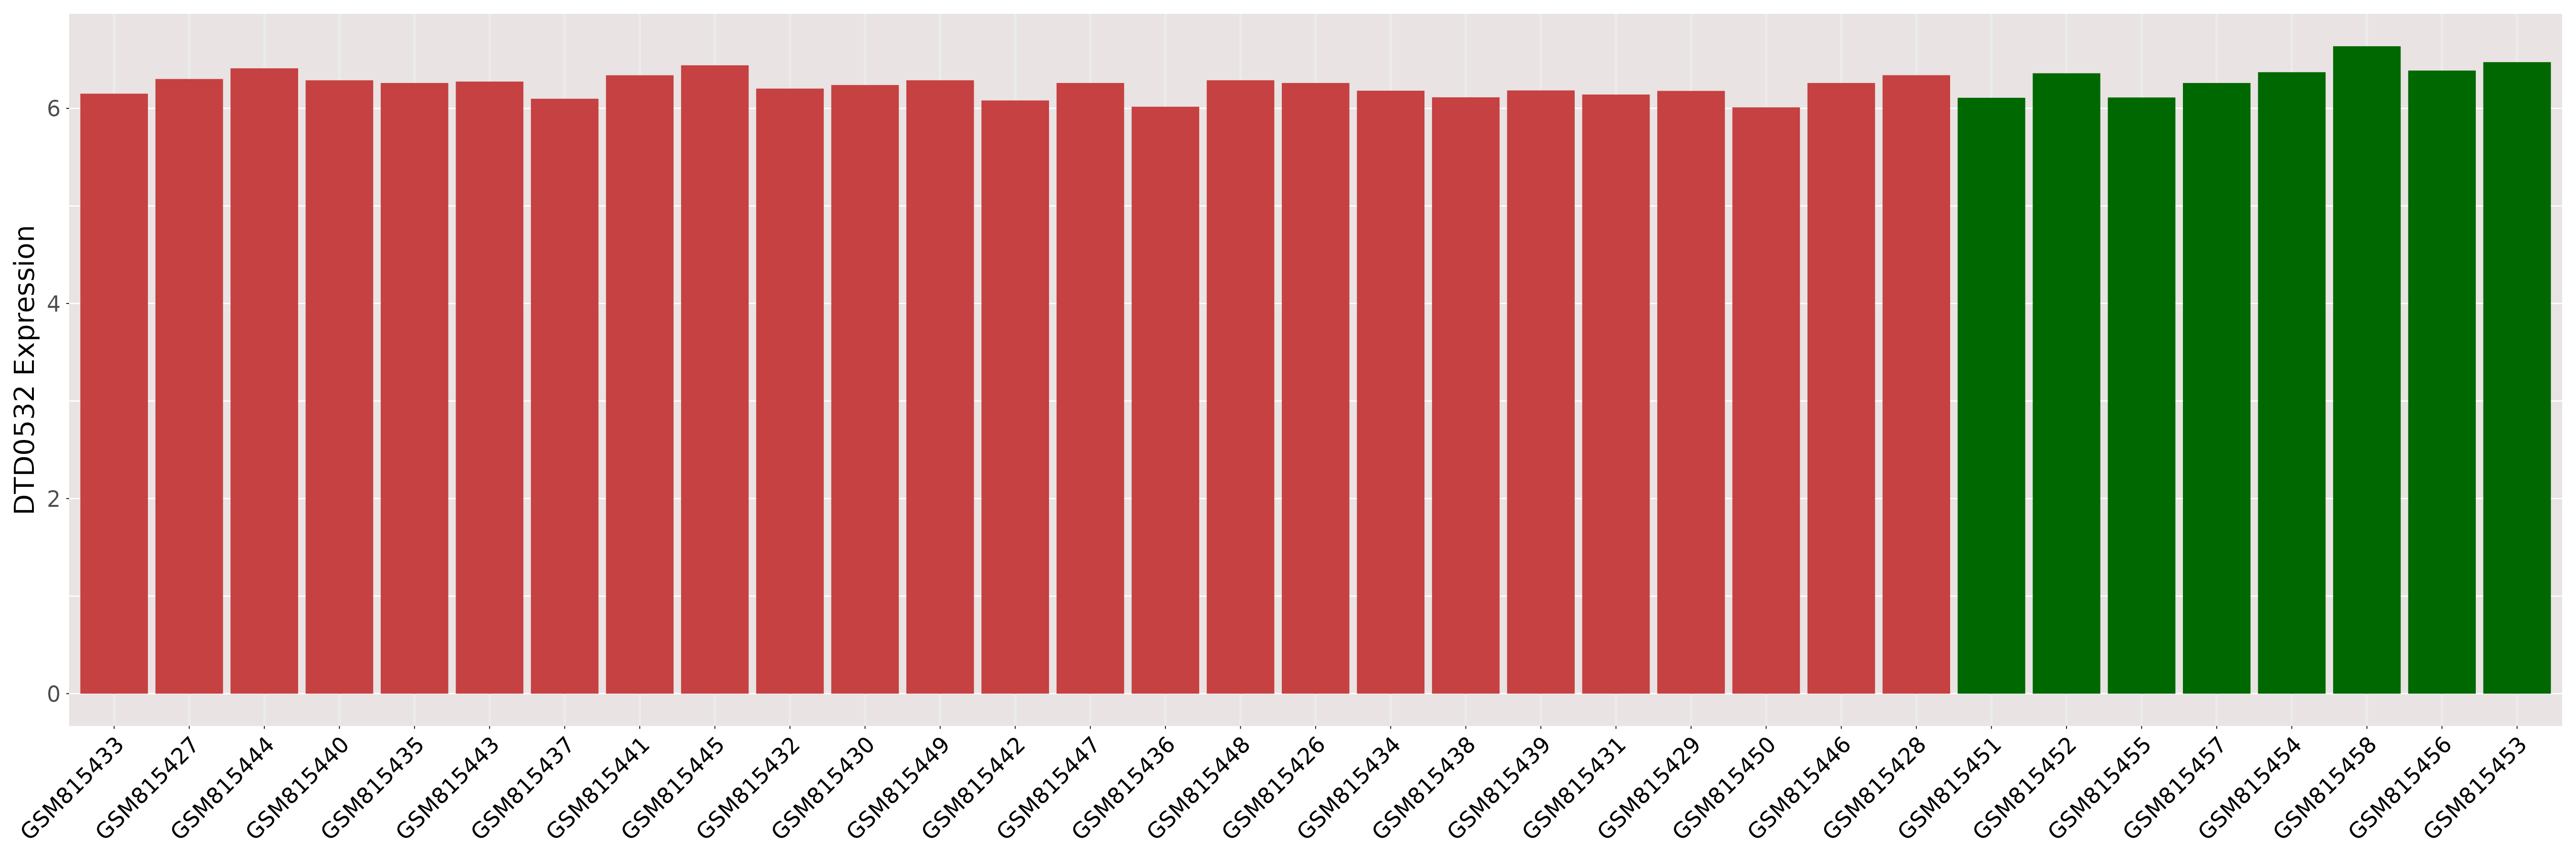
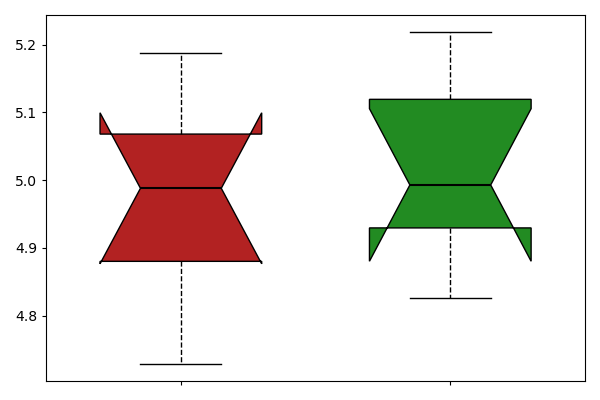
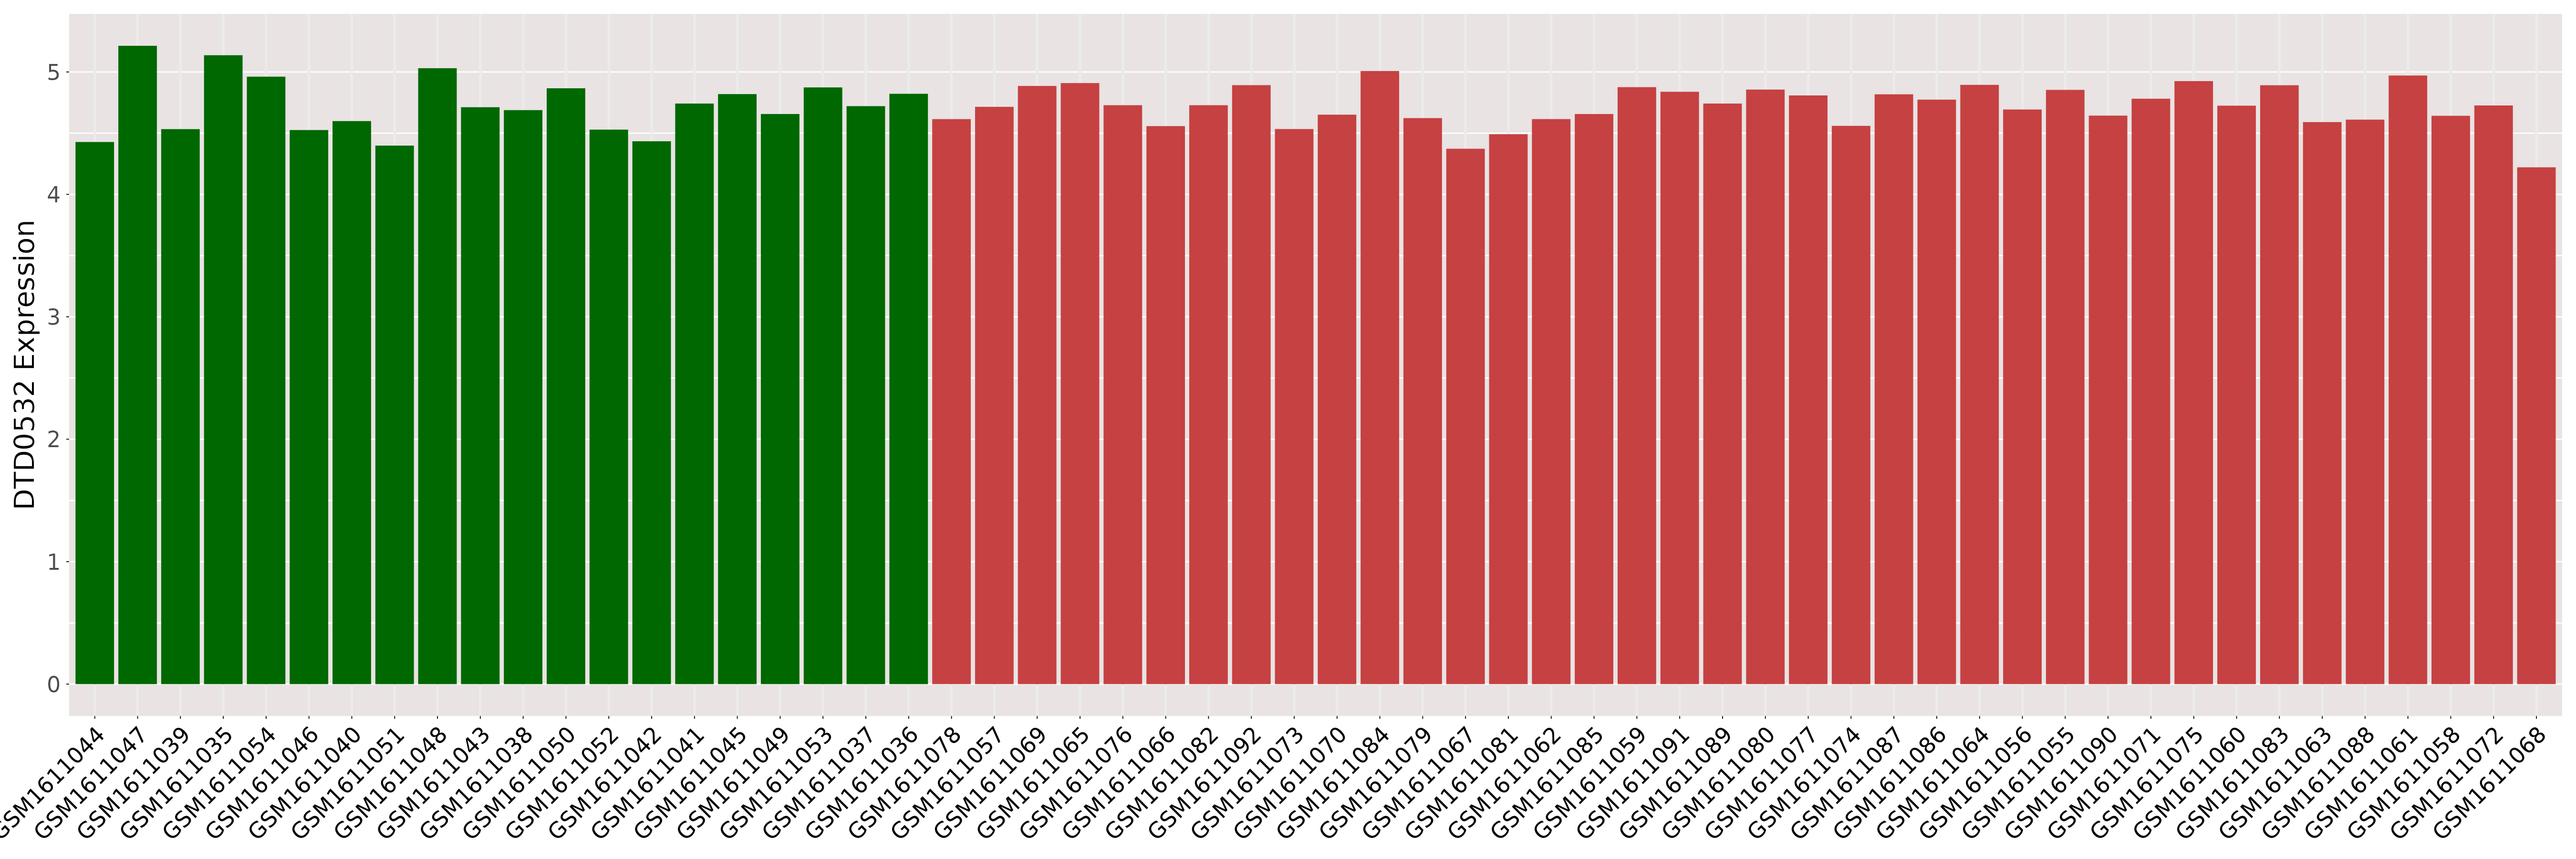
| [+] ICD-11: 2C90.0 Renal cell carcinoma of kidney, except renal pelvis (chromophobe type) | Click to Show/Hide the Full List | ||||
| The Studied Tissue | Kidney | ||||
| The Specified Disease | Chromophobe renal cell carcinoma [ICD-11:2C90.Y] | ||||
| The Expression Level of Disease Section Compare with the Healthy Individual Tissue | p-value:0.0010651028894753; Fold-change:1.042587739618384; Z-score:4.212435410381288 | ||||
| DT expression in the diseased tissue of patients
DT expression in the normal tissue of healthy individuals
|
|||||

|
 Please Click the above Thumbnail to View/Download
the Expression Barchart for All Samples Please Click the above Thumbnail to View/Download
the Expression Barchart for All Samples
|
||||
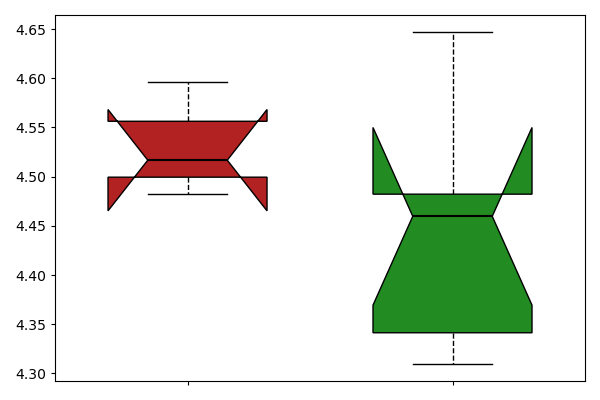
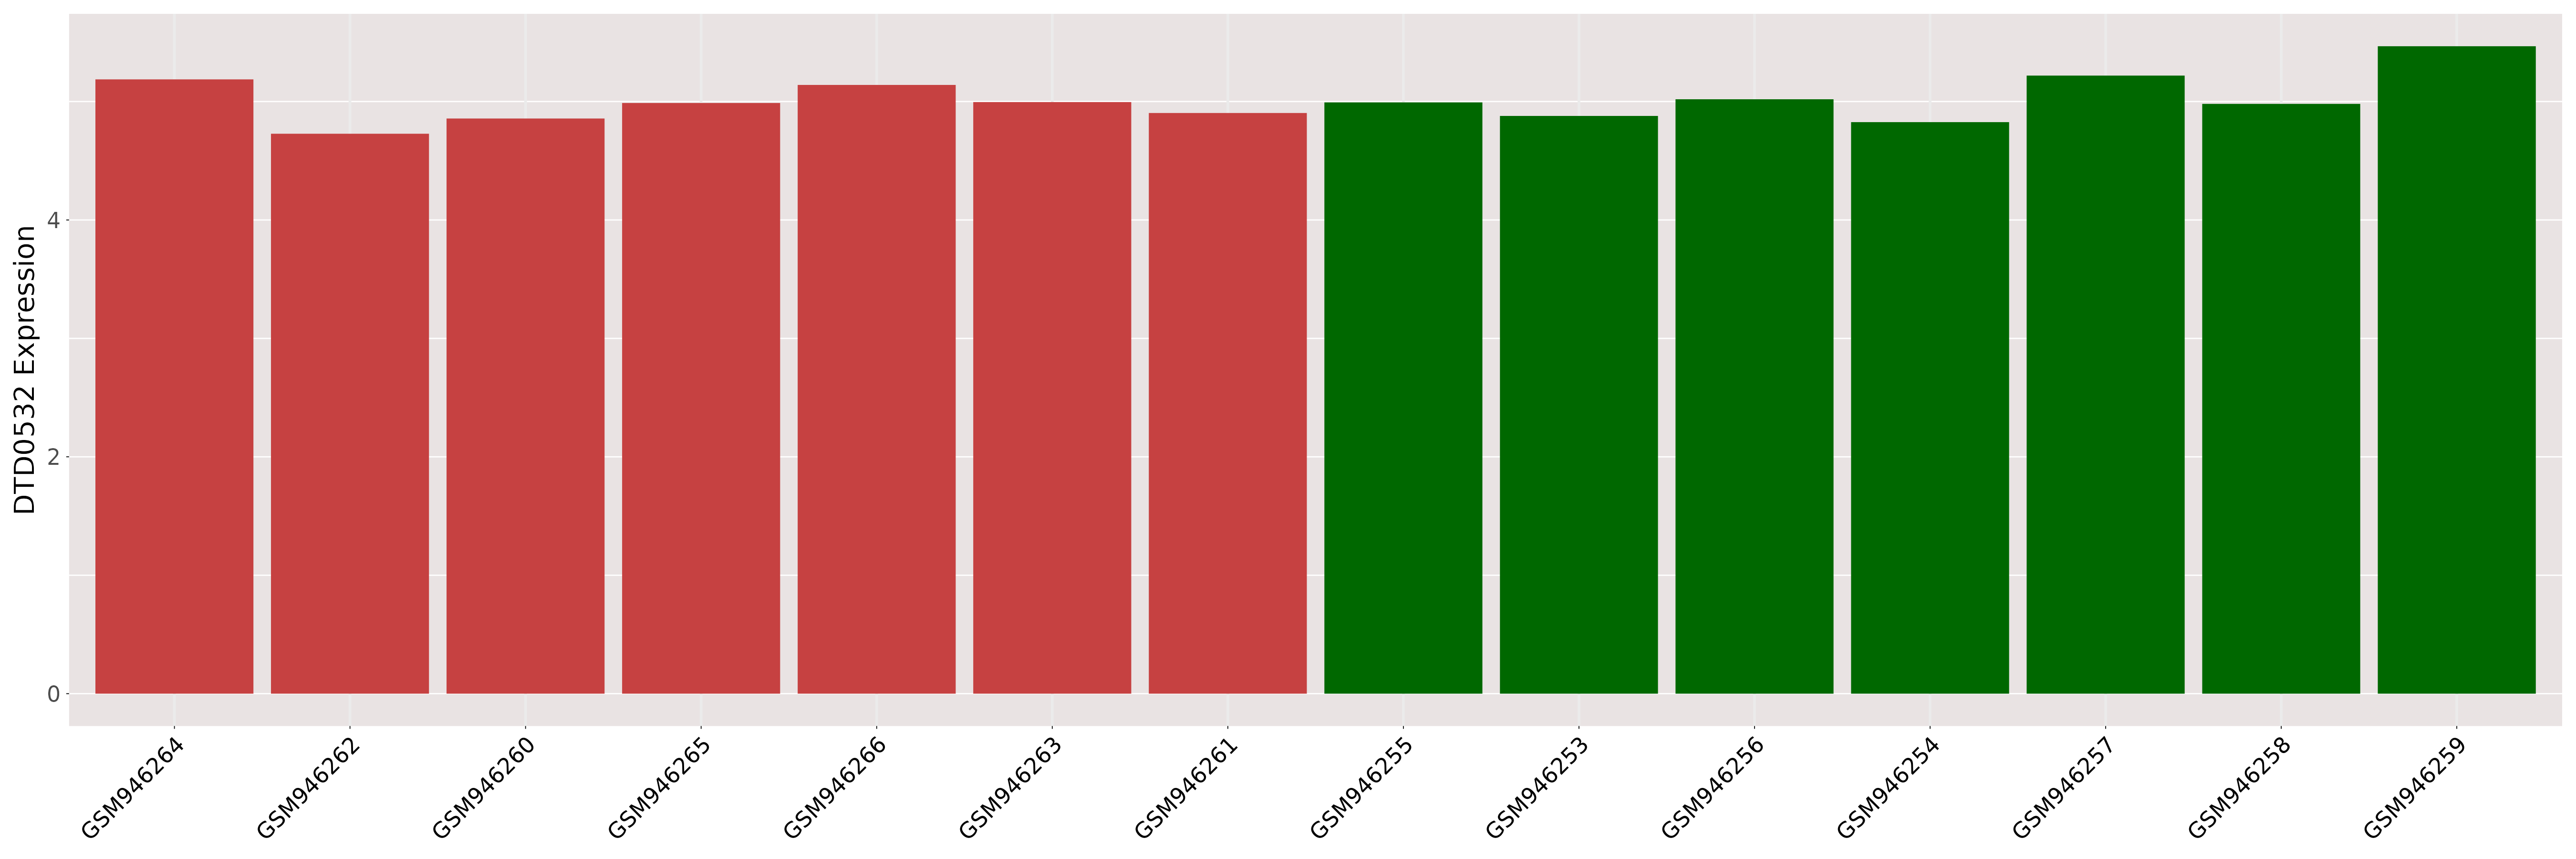
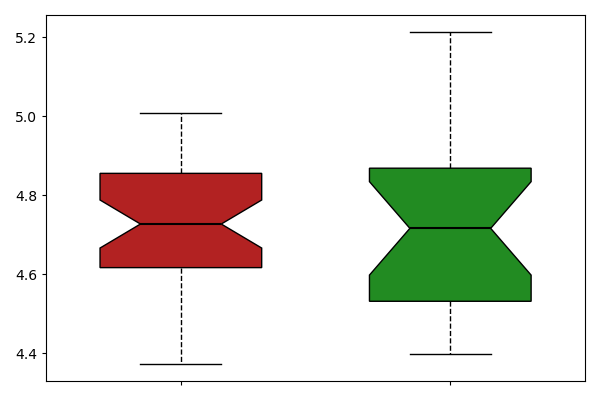
| [+] ICD-11: 2C90.0 Renal cell carcinoma of kidney, except renal pelvis (papillary type) | Click to Show/Hide the Full List | ||||
| The Studied Tissue | Kidney | ||||
| The Specified Disease | Papillary renal cell carcinoma [ICD-11:2C90.Y] | ||||
| The Expression Level of Disease Section Compare with the Healthy Individual Tissue | p-value:0.9837245977375249; Fold-change:0.9926295381366104; Z-score:0.0490371386153686 | ||||
| DT expression in the diseased tissue of patients
DT expression in the normal tissue of healthy individuals
|
|||||

|
 Please Click the above Thumbnail to View/Download
the Expression Barchart for All Samples Please Click the above Thumbnail to View/Download
the Expression Barchart for All Samples
|
||||
| [+] ICD-11: 2C90.Y Nephroblastoma (Wilms tumor) | Click to Show/Hide the Full List | ||||
| The Studied Tissue | Kidney | ||||
| The Specified Disease | Nephroblastoma [ICD-11:2C90.Y] | ||||
| The Expression Level of Disease Section Compare with the Healthy Individual Tissue | p-value:0.2551012118455571; Fold-change:0.9508630146899224; Z-score:-2.716359625 | ||||
| DT expression in the diseased tissue of patients
DT expression in the normal tissue of healthy individuals
|
|||||
|
 Please Click the above Thumbnail to View/Download
the Expression Barchart for All Samples Please Click the above Thumbnail to View/Download
the Expression Barchart for All Samples
|
||||
| [+] ICD-11: 2C94.2 Urothelial carcinoma of bladder | Click to Show/Hide the Full List | ||||
| The Studied Tissue | Bladder | ||||
| The Specified Disease | Urothelial carcinoma [ICD-11:2C94.2] | ||||
| The Expression Level of Disease Section Compare with the Healthy Individual Tissue | p-value:0.1861768442478204; Fold-change:1.0214118417878408; Z-score:0.4642652805890726 | ||||
| DT expression in the diseased tissue of patients
DT expression in the normal tissue of healthy individuals
|
|||||
|
 Please Click the above Thumbnail to View/Download
the Expression Barchart for All Samples Please Click the above Thumbnail to View/Download
the Expression Barchart for All Samples
|
||||
| [+] ICD-11: 2E86.0 Leiomyoma of uterus (uterine fibroid) | Click to Show/Hide the Full List | ||||
| The Studied Tissue | Uterus | ||||
| The Specified Disease | Uterine fibroid [ICD-11:2E86.0] | ||||
| The Expression Level of Disease Section Compare with the Healthy Individual Tissue | p-value:0.3202265722285036; Fold-change:1.0127881394853822; Z-score:0.6512785977811094 | ||||
| DT expression in the diseased tissue of patients
DT expression in the normal tissue of healthy individuals
|
|||||
|
 Please Click the above Thumbnail to View/Download
the Expression Barchart for All Samples Please Click the above Thumbnail to View/Download
the Expression Barchart for All Samples
|
||||
| [+] ICD-11: 2F32.0 Adenoma of colon (benign colon polyp) | Click to Show/Hide the Full List | ||||
| The Studied Tissue | Colon | ||||
| The Specified Disease | Colon adenoma [ICD-11:2F32.0] | ||||
| The Expression Level of Disease Section Compare with the Healthy Individual Tissue | p-value:0.5678232356985089; Fold-change:0.9975933310372378; Z-score:-0.189820645 | ||||
| DT expression in the diseased tissue of patients
DT expression in the normal tissue of healthy individuals
|
|||||
|
 Please Click the above Thumbnail to View/Download
the Expression Barchart for All Samples Please Click the above Thumbnail to View/Download
the Expression Barchart for All Samples
|
||||
| [+] ICD-11: 2F92 Benign neoplasm of kidney (renal oncocytoma) | Click to Show/Hide the Full List | ||||
| The Studied Tissue | Kidney | ||||
| The Specified Disease | Kidney oncocytoma [ICD-11:2F92] | ||||
| The Expression Level of Disease Section Compare with the Healthy Individual Tissue | p-value:0.2090095049446742; Fold-change:1.0295571880180376; Z-score:2.781134809010197 | ||||
| DT expression in the diseased tissue of patients
DT expression in the normal tissue of healthy individuals
|
|||||

|
 Please Click the above Thumbnail to View/Download
the Expression Barchart for All Samples Please Click the above Thumbnail to View/Download
the Expression Barchart for All Samples
|
||||
| ICD-11: 04 Disease of the immune system | |||||
| [+] ICD-11: 4B20 Sarcoidosis | Click to Show/Hide the Full List | ||||
| The Studied Tissue | Lung | ||||
| The Specified Disease | Sarcoidosis [ICD-11:4B20] | ||||
| The Expression Level of Disease Section Compare with the Healthy Individual Tissue | p-value:0.1128535302623092; Fold-change:0.9825050537622658; Z-score:-0.929153347 | ||||
| DT expression in the diseased tissue of patients
DT expression in the normal tissue of healthy individuals
|
|||||
|
 Please Click the above Thumbnail to View/Download
the Expression Barchart for All Samples Please Click the above Thumbnail to View/Download
the Expression Barchart for All Samples
|
||||
| ICD-11: 05 Endocrine, nutritional or metabolic disease | |||||
| [+] ICD-11: 5A11 Type 2 diabetes mellitus | Click to Show/Hide the Full List | ||||
| The Studied Tissue | Skeletal muscle | ||||
| The Specified Disease | Type 2 diabetes [ICD-11:5A11] | ||||
| The Expression Level of Disease Section Compare with the Healthy Individual Tissue | p-value:0.8431054523776362; Fold-change:0.9985388225951388; Z-score:-0.090663632 | ||||
| DT expression in the diseased tissue of patients
DT expression in the normal tissue of healthy individuals
|
|||||

|
 Please Click the above Thumbnail to View/Download
the Expression Barchart for All Samples Please Click the above Thumbnail to View/Download
the Expression Barchart for All Samples
|
||||
| The Studied Tissue | Islet of langerhans | ||||
| The Specified Disease | Type ii diabetes mellitus [ICD-11:5A11] | ||||
| The Expression Level of Disease Section Compare with the Healthy Individual Tissue | p-value:0.3906623313981733; Fold-change:1.14; Z-score:1.132471352583109 | ||||
| DT expression in the diseased tissue of patients
DT expression in the normal tissue of healthy individuals
|
|||||

|
 Please Click the above Thumbnail to View/Download
the Expression Barchart for All Samples Please Click the above Thumbnail to View/Download
the Expression Barchart for All Samples
|
||||
| [+] ICD-11: 5A14 Diabetes mellitus, type unspecified | Click to Show/Hide the Full List | ||||
| The Studied Tissue | Skeletal muscle | ||||
| The Specified Disease | Diabetes mellitus [ICD-11:5A14] | ||||
| The Expression Level of Disease Section Compare with the Healthy Individual Tissue | p-value:0.6883590681843018; Fold-change:1.0514388266012928; Z-score:0.215658021854675 | ||||
| DT expression in the diseased tissue of patients
DT expression in the normal tissue of healthy individuals
|
|||||
|
 Please Click the above Thumbnail to View/Download
the Expression Barchart for All Samples Please Click the above Thumbnail to View/Download
the Expression Barchart for All Samples
|
||||
| [+] ICD-11: 5C50.E0 Classical organic aciduria (Methylmalonic acidemia) | Click to Show/Hide the Full List | ||||
| The Studied Tissue | Kidney | ||||
| The Specified Disease | Methylmalonic acidemia [ICD-11:5C50.E0] | ||||
| The Expression Level of Disease Section Compare with the Healthy Individual Tissue | p-value:0.8730154377416672; Fold-change:0.9994226210392771; Z-score:1.6136641626629065 | ||||
| DT expression in the diseased tissue of patients
DT expression in the normal tissue of healthy individuals
|
|||||
|
 Please Click the above Thumbnail to View/Download
the Expression Barchart for All Samples Please Click the above Thumbnail to View/Download
the Expression Barchart for All Samples
|
||||
| [+] ICD-11: 5C57.1 X-linked adrenoleukodystrophy | Click to Show/Hide the Full List | ||||
| The Studied Tissue | Dermis | ||||
| The Specified Disease | X linked cerebral adrenoleukodystrophy [ICD-11:5C57.1] | ||||
| The Expression Level of Disease Section Compare with the Healthy Individual Tissue | p-value:0.2188361455657724; Fold-change:0.91749869904628; Z-score:-0.776390882 | ||||
| DT expression in the diseased tissue of patients
DT expression in the normal tissue of healthy individuals
|
|||||
|
 Please Click the above Thumbnail to View/Download
the Expression Barchart for All Samples Please Click the above Thumbnail to View/Download
the Expression Barchart for All Samples
|
||||
| ICD-11: 06 Mental, behavioural or neurodevelopmental disorder | |||||
| [+] ICD-11: 6A02 Autism spectrum disorder | Click to Show/Hide the Full List | ||||
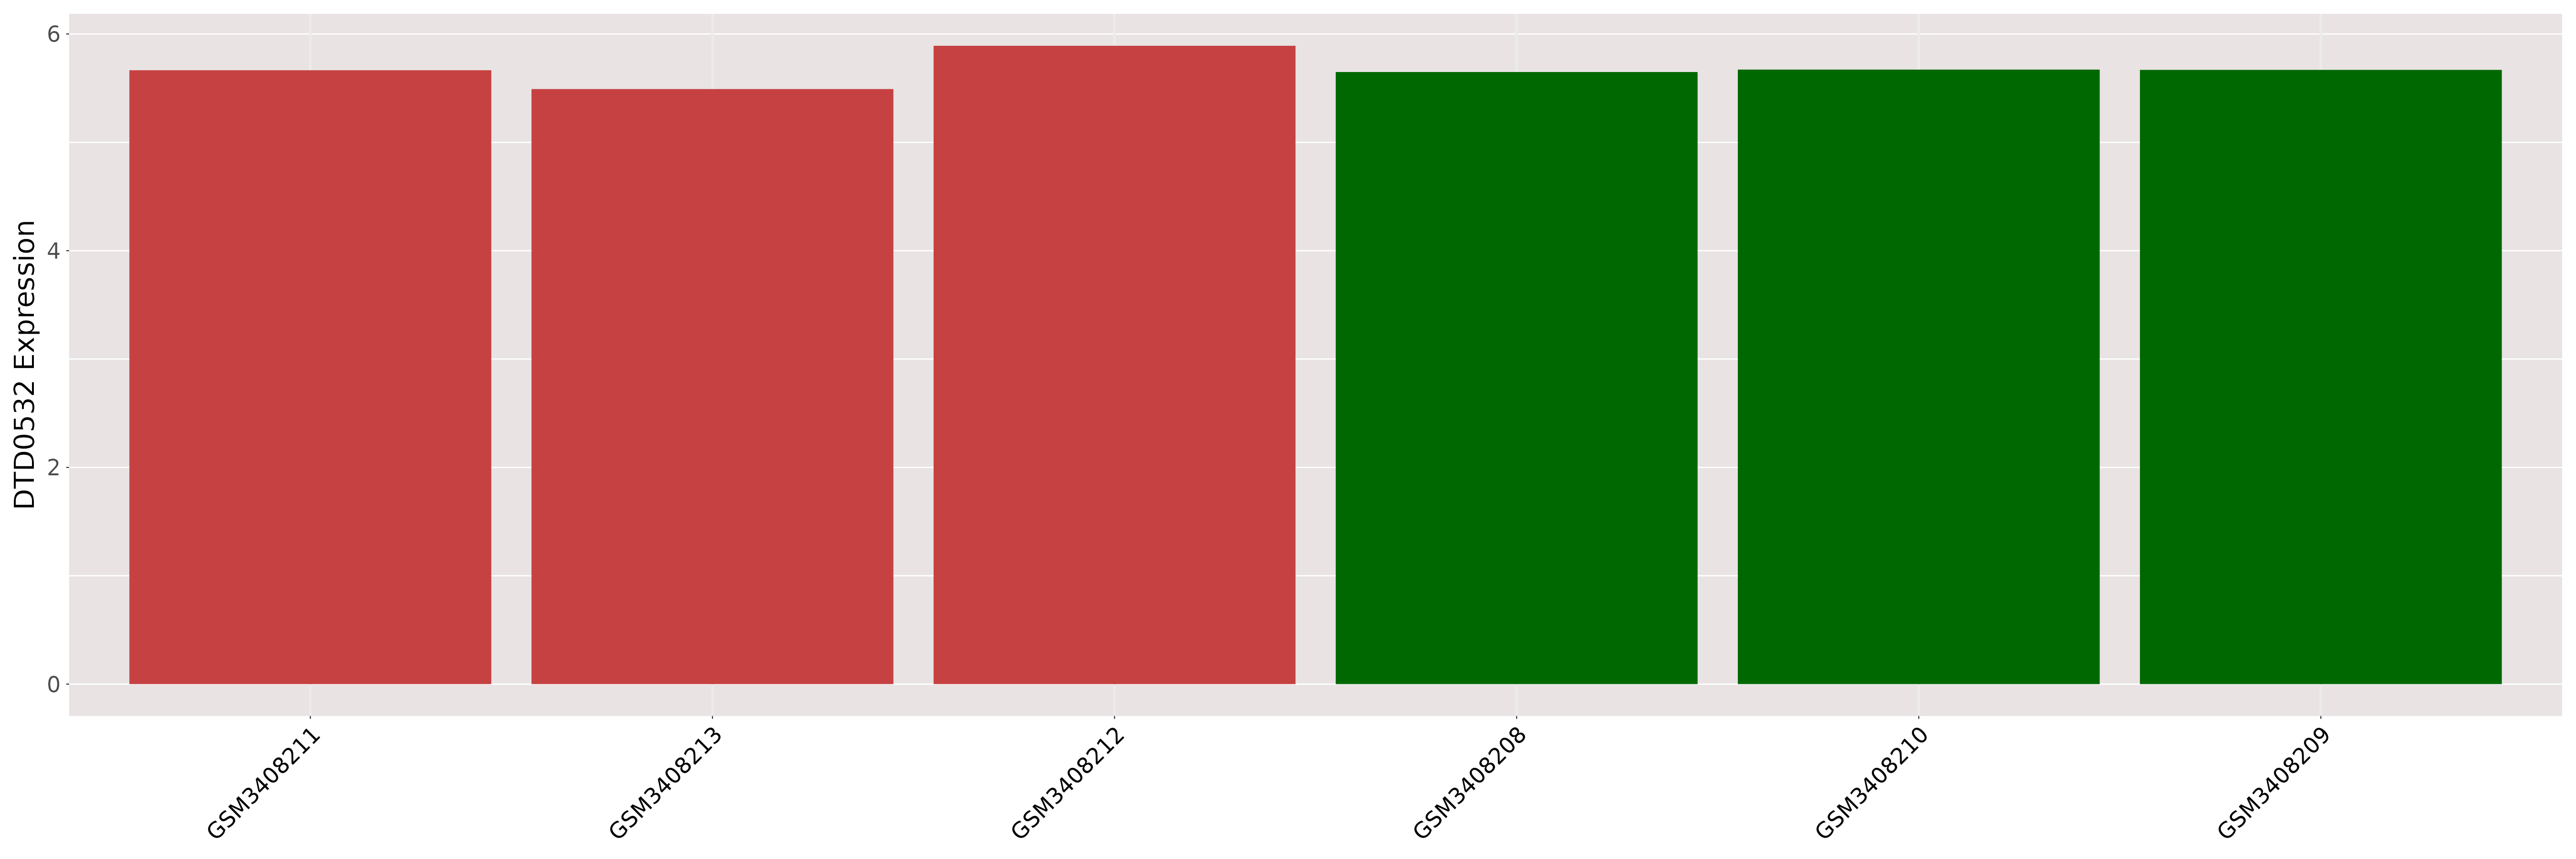
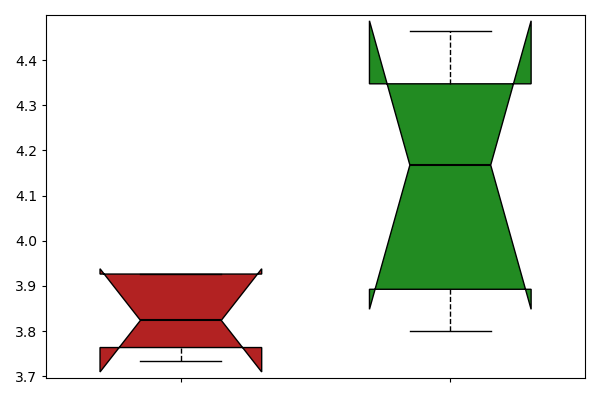
| The Studied Tissue | Brain | ||||
| The Specified Disease | Autism [ICD-11:6A02] | ||||
| The Expression Level of Disease Section Compare with the Healthy Individual Tissue | p-value:0.0003660120612513; Fold-change:0.1818810511756569; Z-score:-3.37306737 | ||||
| DT expression in the diseased tissue of patients
DT expression in the normal tissue of healthy individuals
|
|||||
|
 Please Click the above Thumbnail to View/Download
the Expression Barchart for All Samples Please Click the above Thumbnail to View/Download
the Expression Barchart for All Samples
|
||||
| [+] ICD-11: 6A20 Schizophrenia | Click to Show/Hide the Full List | ||||
| The Studied Tissue | Brodmann (1909) area 9 | ||||
| The Specified Disease | Schizophrenia [ICD-11:6A20] | ||||
| The Expression Level of Disease Section Compare with the Healthy Individual Tissue | p-value:0.0737292330812887; Fold-change:0.690625; Z-score:-1.85092087 | ||||
| DT expression in the diseased tissue of patients
DT expression in the normal tissue of healthy individuals
|
|||||
_area_9-1.png)
|
_area_9.png) Please Click the above Thumbnail to View/Download
the Expression Barchart for All Samples Please Click the above Thumbnail to View/Download
the Expression Barchart for All Samples
|
||||
| The Studied Tissue | Brodmann (1909) area 11 | ||||
| The Specified Disease | Schizophrenia [ICD-11:6A20] | ||||
| The Expression Level of Disease Section Compare with the Healthy Individual Tissue | p-value:0.5024934763408159; Fold-change:1.072566371681416; Z-score:-0.269636511 | ||||
| DT expression in the diseased tissue of patients
DT expression in the normal tissue of healthy individuals
|
|||||
_area_11-1.png)
|
_area_11.png) Please Click the above Thumbnail to View/Download
the Expression Barchart for All Samples Please Click the above Thumbnail to View/Download
the Expression Barchart for All Samples
|
||||
| The Studied Tissue | Brodmann (1909) area 24 | ||||
| The Specified Disease | Schizophrenia [ICD-11:6A20] | ||||
| The Expression Level of Disease Section Compare with the Healthy Individual Tissue | p-value:0.000583869805203; Fold-change:0.551440329218107; Z-score:-2.365502074 | ||||
| DT expression in the diseased tissue of patients
DT expression in the normal tissue of healthy individuals
|
|||||
_area_24-1.png)
|
_area_24.png) Please Click the above Thumbnail to View/Download
the Expression Barchart for All Samples Please Click the above Thumbnail to View/Download
the Expression Barchart for All Samples
|
||||
| [+] ICD-11: 6A60 Bipolar type I disorder (Bipolar disorder) | Click to Show/Hide the Full List | ||||
| The Studied Tissue | Brodmann (1909) area 9 | ||||
| The Specified Disease | Bipolar disorder [ICD-11:6A60] | ||||
| The Expression Level of Disease Section Compare with the Healthy Individual Tissue | p-value:0.1715830726820909; Fold-change:0.525; Z-score:-2.381566482 | ||||
| DT expression in the diseased tissue of patients
DT expression in the normal tissue of healthy individuals
|
|||||
_area_9-1.png)
|
_area_9.png) Please Click the above Thumbnail to View/Download
the Expression Barchart for All Samples Please Click the above Thumbnail to View/Download
the Expression Barchart for All Samples
|
||||
| The Studied Tissue | Brodmann (1909) area 11 | ||||
| The Specified Disease | Bipolar disorder [ICD-11:6A60] | ||||
| The Expression Level of Disease Section Compare with the Healthy Individual Tissue | p-value:0.0871471287081693; Fold-change:0.8743362831858407; Z-score:-0.768381346 | ||||
| DT expression in the diseased tissue of patients
DT expression in the normal tissue of healthy individuals
|
|||||
_area_11-1.png)
|
_area_11.png) Please Click the above Thumbnail to View/Download
the Expression Barchart for All Samples Please Click the above Thumbnail to View/Download
the Expression Barchart for All Samples
|
||||
| The Studied Tissue | Brodmann (1909) area 24 | ||||
| The Specified Disease | Bipolar disorder [ICD-11:6A60] | ||||
| The Expression Level of Disease Section Compare with the Healthy Individual Tissue | p-value:0.0676164368932062; Fold-change:0.5802469135802469; Z-score:-1.749438723 | ||||
| DT expression in the diseased tissue of patients
DT expression in the normal tissue of healthy individuals
|
|||||
_area_24-1.png)
|
_area_24.png) Please Click the above Thumbnail to View/Download
the Expression Barchart for All Samples Please Click the above Thumbnail to View/Download
the Expression Barchart for All Samples
|
||||
| The Studied Tissue | Dorsolateral prefrontal cortex | ||||
| The Specified Disease | Bipolar disorder [ICD-11:6A60] | ||||
| The Expression Level of Disease Section Compare with the Healthy Individual Tissue | p-value:0.3447688761265955; Fold-change:0.8460891505466779; Z-score:-0.2139871 | ||||
| DT expression in the diseased tissue of patients
DT expression in the normal tissue of healthy individuals
|
|||||

|
 Please Click the above Thumbnail to View/Download
the Expression Barchart for All Samples Please Click the above Thumbnail to View/Download
the Expression Barchart for All Samples
|
||||
| ICD-11: 08 Disease of the nervous system | |||||
| [+] ICD-11: 8A20 Alzheimer disease | Click to Show/Hide the Full List | ||||
| The Studied Tissue | Frontal cortex | ||||
| The Specified Disease | Alzheimer's disease [ICD-11:8A20] | ||||
| The Expression Level of Disease Section Compare with the Healthy Individual Tissue | p-value:0.5158481611777646; Fold-change:1.000098458367833; Z-score:0.2123738738044808 | ||||
| DT expression in the diseased tissue of patients
DT expression in the normal tissue of healthy individuals
|
|||||
|
 Please Click the above Thumbnail to View/Download
the Expression Barchart for All Samples Please Click the above Thumbnail to View/Download
the Expression Barchart for All Samples
|
||||
| The Studied Tissue | Hippocampus | ||||
| The Specified Disease | Alzheimer's disease [ICD-11:8A20] | ||||
| The Expression Level of Disease Section Compare with the Healthy Individual Tissue | p-value:0.035714888087134; Fold-change:0.9504311241683028; Z-score:-1.243618939 | ||||
| DT expression in the diseased tissue of patients
DT expression in the normal tissue of healthy individuals
|
|||||

|
 Please Click the above Thumbnail to View/Download
the Expression Barchart for All Samples Please Click the above Thumbnail to View/Download
the Expression Barchart for All Samples
|
||||
| The Studied Tissue | Middle temporal gyrus | ||||
| The Specified Disease | Alzheimer's disease [ICD-11:8A20] | ||||
| The Expression Level of Disease Section Compare with the Healthy Individual Tissue | p-value:0.6598264103625935; Fold-change:1.0495134830110875; Z-score:-0.1277388 | ||||
| DT expression in the diseased tissue of patients
DT expression in the normal tissue of healthy individuals
|
|||||
|
 Please Click the above Thumbnail to View/Download
the Expression Barchart for All Samples Please Click the above Thumbnail to View/Download
the Expression Barchart for All Samples
|
||||
| The Studied Tissue | Postcentral gyrus | ||||
| The Specified Disease | Alzheimer's disease [ICD-11:8A20] | ||||
| The Expression Level of Disease Section Compare with the Healthy Individual Tissue | p-value:0.1229843820738415; Fold-change:0.9436262659374064; Z-score:-0.357100866 | ||||
| DT expression in the diseased tissue of patients
DT expression in the normal tissue of healthy individuals
|
|||||

|
 Please Click the above Thumbnail to View/Download
the Expression Barchart for All Samples Please Click the above Thumbnail to View/Download
the Expression Barchart for All Samples
|
||||
| The Studied Tissue | Posterior cingulate cortex | ||||
| The Specified Disease | Alzheimer's disease [ICD-11:8A20] | ||||
| The Expression Level of Disease Section Compare with the Healthy Individual Tissue | p-value:0.5969171042801745; Fold-change:0.9906398135085176; Z-score:-0.238464284 | ||||
| DT expression in the diseased tissue of patients
DT expression in the normal tissue of healthy individuals
|
|||||
|
 Please Click the above Thumbnail to View/Download
the Expression Barchart for All Samples Please Click the above Thumbnail to View/Download
the Expression Barchart for All Samples
|
||||
| The Studied Tissue | Primary visual cortex | ||||
| The Specified Disease | Alzheimer's disease [ICD-11:8A20] | ||||
| The Expression Level of Disease Section Compare with the Healthy Individual Tissue | p-value:0.5874487305360288; Fold-change:1.0037945542405111; Z-score:0.1927575090312439 | ||||
| DT expression in the diseased tissue of patients
DT expression in the normal tissue of healthy individuals
|
|||||

|
 Please Click the above Thumbnail to View/Download
the Expression Barchart for All Samples Please Click the above Thumbnail to View/Download
the Expression Barchart for All Samples
|
||||
| The Studied Tissue | Superior frontal gyrus | ||||
| The Specified Disease | Alzheimer's disease [ICD-11:8A20] | ||||
| The Expression Level of Disease Section Compare with the Healthy Individual Tissue | p-value:0.0002405488633683; Fold-change:0.888499207159182; Z-score:-0.951081825 | ||||
| DT expression in the diseased tissue of patients
DT expression in the normal tissue of healthy individuals
|
|||||
|
 Please Click the above Thumbnail to View/Download
the Expression Barchart for All Samples Please Click the above Thumbnail to View/Download
the Expression Barchart for All Samples
|
||||
| The Studied Tissue | Temporal cortex | ||||
| The Specified Disease | Alzheimer's disease [ICD-11:8A20] | ||||
| The Expression Level of Disease Section Compare with the Healthy Individual Tissue | p-value:0.9489416574699832; Fold-change:1.0043329697981092; Z-score:-0.022129939 | ||||
| DT expression in the diseased tissue of patients
DT expression in the normal tissue of healthy individuals
|
|||||
|
 Please Click the above Thumbnail to View/Download
the Expression Barchart for All Samples Please Click the above Thumbnail to View/Download
the Expression Barchart for All Samples
|
||||
| [+] ICD-11: 8C70.3 Facioscapulohumeral muscular dystrophy | Click to Show/Hide the Full List | ||||
| The Studied Tissue | Muscle | ||||
| The Specified Disease | Facioscapulohumeral dystrophy [ICD-11:8C70.3] | ||||
| The Expression Level of Disease Section Compare with the Healthy Individual Tissue | p-value:0.4528281079491845; Fold-change:1.0578049401578813; Z-score:0.3137391179058664 | ||||
| DT expression in the diseased tissue of patients
DT expression in the normal tissue of healthy individuals
|
|||||

|
 Please Click the above Thumbnail to View/Download
the Expression Barchart for All Samples Please Click the above Thumbnail to View/Download
the Expression Barchart for All Samples
|
||||
| The Studied Tissue | Myoblast | ||||
| The Specified Disease | Facioscapulohumeral dystrophy [ICD-11:8C70.3] | ||||
| The Expression Level of Disease Section Compare with the Healthy Individual Tissue | p-value:0.1562838758843697; Fold-change:0.1079545454545454; Z-score:-0.814503376 | ||||
| DT expression in the diseased tissue of patients
DT expression in the normal tissue of healthy individuals
|
|||||

|
 Please Click the above Thumbnail to View/Download
the Expression Barchart for All Samples Please Click the above Thumbnail to View/Download
the Expression Barchart for All Samples
|
||||
| The Studied Tissue | Myotube | ||||
| The Specified Disease | Facioscapulohumeral dystrophy [ICD-11:8C70.3] | ||||
| The Expression Level of Disease Section Compare with the Healthy Individual Tissue | p-value:0.4099165573436605; Fold-change:1.1265206812652069; Z-score:0.6028426852968873 | ||||
| DT expression in the diseased tissue of patients
DT expression in the normal tissue of healthy individuals
|
|||||
|
 Please Click the above Thumbnail to View/Download
the Expression Barchart for All Samples Please Click the above Thumbnail to View/Download
the Expression Barchart for All Samples
|
||||
| [+] ICD-11: 8C71.0 Myotonic dystrophy | Click to Show/Hide the Full List | ||||
| The Studied Tissue | Heart left ventricle | ||||
| The Specified Disease | Myotonic dystrophy [ICD-11:8C71.0] | ||||
| The Expression Level of Disease Section Compare with the Healthy Individual Tissue | p-value:0.2010493667799807; Fold-change:2.0503778337531484; Z-score:1.575535160556424 | ||||
| DT expression in the diseased tissue of patients
DT expression in the normal tissue of healthy individuals
|
|||||
|
 Please Click the above Thumbnail to View/Download
the Expression Barchart for All Samples Please Click the above Thumbnail to View/Download
the Expression Barchart for All Samples
|
||||
| ICD-11: 11 Disease of the circulatory system | |||||
| [+] ICD-11: BD10 Congestive heart failure | Click to Show/Hide the Full List | ||||
| The Studied Tissue | Skeletal muscle tissue | ||||
| The Specified Disease | Heart failure [ICD-11:BD10] | ||||
| The Expression Level of Disease Section Compare with the Healthy Individual Tissue | p-value:0.774543403140671; Fold-change:1.0926275992438563; Z-score:-0.219100865 | ||||
| DT expression in the diseased tissue of patients
DT expression in the normal tissue of healthy individuals
|
|||||

|
 Please Click the above Thumbnail to View/Download
the Expression Barchart for All Samples Please Click the above Thumbnail to View/Download
the Expression Barchart for All Samples
|
||||
| [+] ICD-11: BD10 Congestive heart failure (post-ischemic) | Click to Show/Hide the Full List | ||||
| The Studied Tissue | Left ventricle | ||||
| The Specified Disease | Post ischemic heart failure [ICD-11:BD10] | ||||
| The Expression Level of Disease Section Compare with the Healthy Individual Tissue | p-value:0.6212000974788168; Fold-change:0.9823988556492074; Z-score:-0.261989922 | ||||
| DT expression in the diseased tissue of patients
DT expression in the normal tissue of healthy individuals
|
|||||
|
 Please Click the above Thumbnail to View/Download
the Expression Barchart for All Samples Please Click the above Thumbnail to View/Download
the Expression Barchart for All Samples
|
||||
| ICD-11: 13 Disease of the digestive system | |||||
| [+] ICD-11: DB91 Acute or subacute hepatic failure | Click to Show/Hide the Full List | ||||
| The Studied Tissue | Liver | ||||
| The Specified Disease | Acute liver failure [ICD-11:DB91.Z] | ||||
| The Expression Level of Disease Section Compare with the Healthy Individual Tissue | p-value:0.9968189077034298; Fold-change:1; Z-score:-0.001088323 | ||||
| DT expression in the diseased tissue of patients
DT expression in the normal tissue of healthy individuals
|
|||||
|
 Please Click the above Thumbnail to View/Download
the Expression Barchart for All Samples Please Click the above Thumbnail to View/Download
the Expression Barchart for All Samples
|
||||
| [+] ICD-11: DB92.1 Non-alcoholic steatohepatitis | Click to Show/Hide the Full List | ||||
| The Studied Tissue | Liver | ||||
| The Specified Disease | Non alcoholic steatohepatitis [ICD-11:DB92.1] | ||||
| The Expression Level of Disease Section Compare with the Healthy Individual Tissue | p-value:0.9680275091886564; Fold-change:0.9881133074081516; Z-score:0.0215617272627932 | ||||
| DT expression in the diseased tissue of patients
DT expression in the normal tissue of healthy individuals
|
|||||

|
 Please Click the above Thumbnail to View/Download
the Expression Barchart for All Samples Please Click the above Thumbnail to View/Download
the Expression Barchart for All Samples
|
||||
| [+] ICD-11: DD70 Crohn disease | Click to Show/Hide the Full List | ||||
| The Studied Tissue | Ileum | ||||
| The Specified Disease | Crohn's disease [ICD-11:DD70.Z] | ||||
| The Expression Level of Disease Section Compare with the Healthy Individual Tissue | p-value:0.7391895596896982; Fold-change:1.6; Z-score:0.0532779211573359 | ||||
| DT expression in the diseased tissue of patients
DT expression in the normal tissue of healthy individuals
|
|||||

|
 Please Click the above Thumbnail to View/Download
the Expression Barchart for All Samples Please Click the above Thumbnail to View/Download
the Expression Barchart for All Samples
|
||||
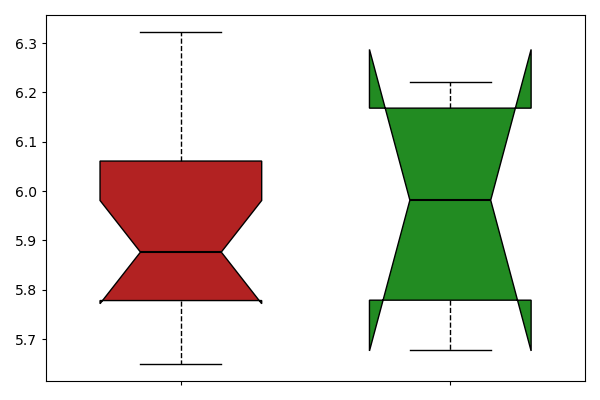
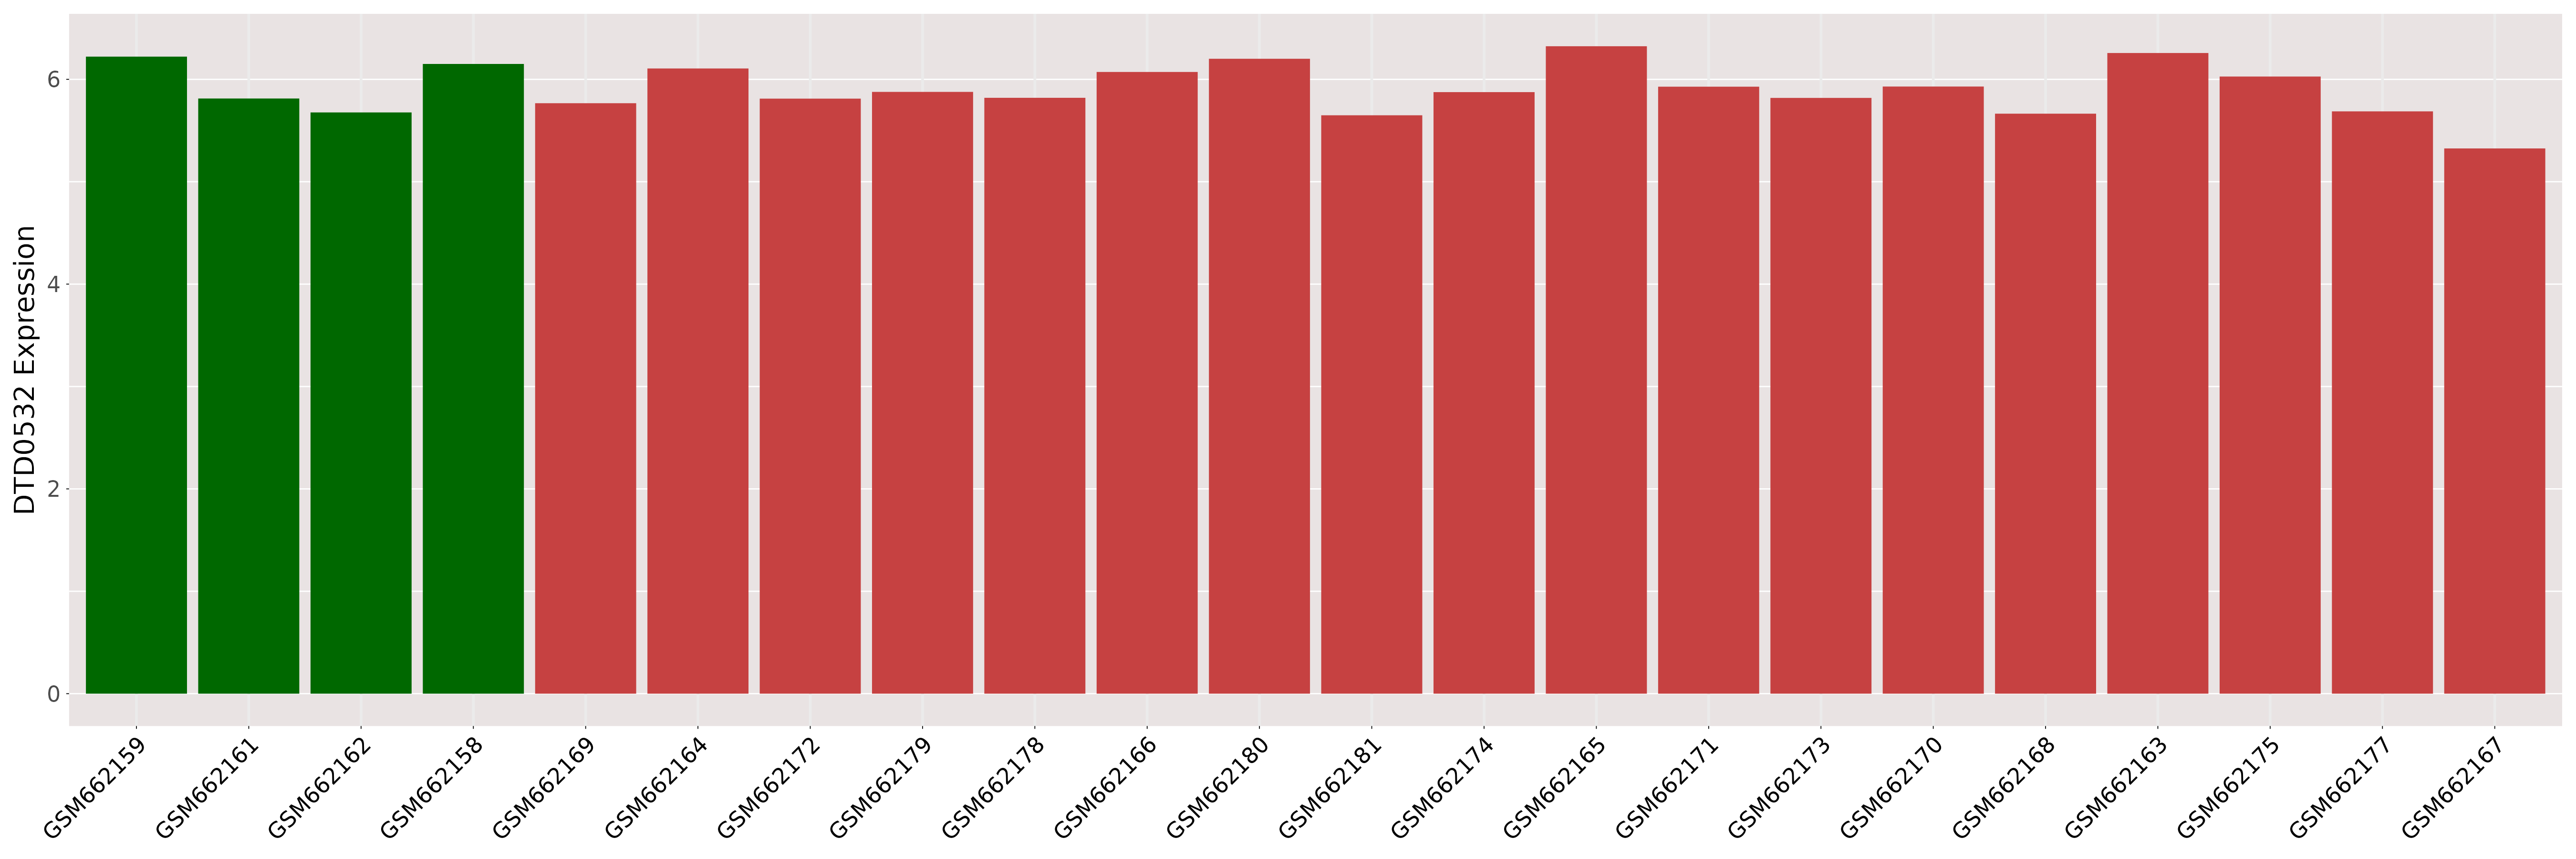
| The Studied Tissue | Colonic mucosa | ||||
| The Specified Disease | Crohn's disease [ICD-11:DD70.Z] | ||||
| The Expression Level of Disease Section Compare with the Healthy Individual Tissue | p-value:0.5264208273771798; Fold-change:0.9777343621059168; Z-score:-0.293103022 | ||||
| DT expression in the diseased tissue of patients
DT expression in the normal tissue of healthy individuals
|
|||||

|
 Please Click the above Thumbnail to View/Download
the Expression Barchart for All Samples Please Click the above Thumbnail to View/Download
the Expression Barchart for All Samples
|
||||
| [+] ICD-11: DD71 Ulcerative colitis | Click to Show/Hide the Full List | ||||
| The Studied Tissue | Caecum | ||||
| The Specified Disease | Active ulcerative colitis [ICD-11:DD71.Z] | ||||
| The Expression Level of Disease Section Compare with the Healthy Individual Tissue | p-value:0.2383689161560959; Fold-change:0.9762007145780998; Z-score:-0.81977298 | ||||
| DT expression in the diseased tissue of patients
DT expression in the normal tissue of healthy individuals
|
|||||
|
 Please Click the above Thumbnail to View/Download
the Expression Barchart for All Samples Please Click the above Thumbnail to View/Download
the Expression Barchart for All Samples
|
||||
| The Studied Tissue | Left colon | ||||
| The Specified Disease | Active ulcerative colitis [ICD-11:DD71.Z] | ||||
| The Expression Level of Disease Section Compare with the Healthy Individual Tissue | p-value:0.9423724043018492; Fold-change:1.0054008962134429; Z-score:-0.083831172 | ||||
| DT expression in the diseased tissue of patients
DT expression in the normal tissue of healthy individuals
|
|||||

|
 Please Click the above Thumbnail to View/Download
the Expression Barchart for All Samples Please Click the above Thumbnail to View/Download
the Expression Barchart for All Samples
|
||||
| The Studied Tissue | Rectum | ||||
| The Specified Disease | Active ulcerative colitis [ICD-11:DD71.Z] | ||||
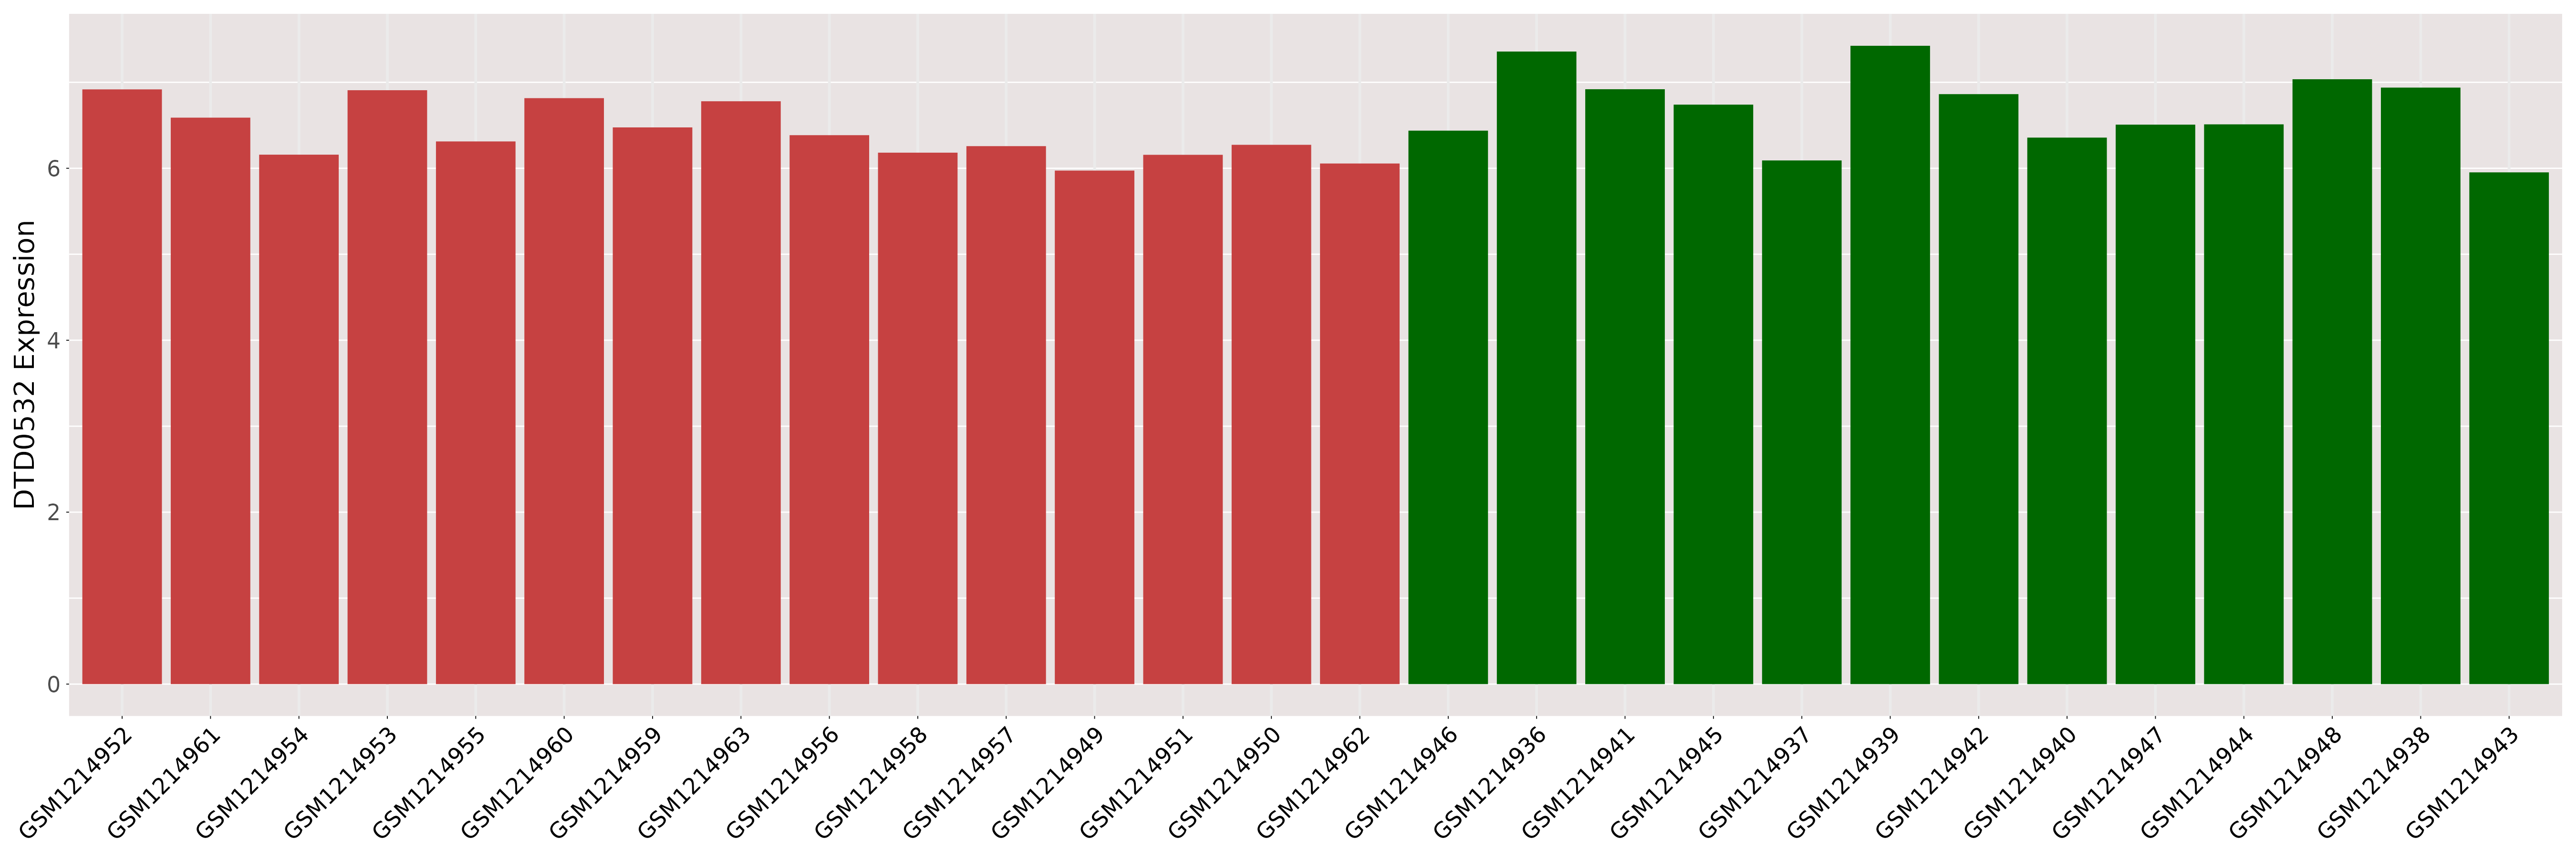
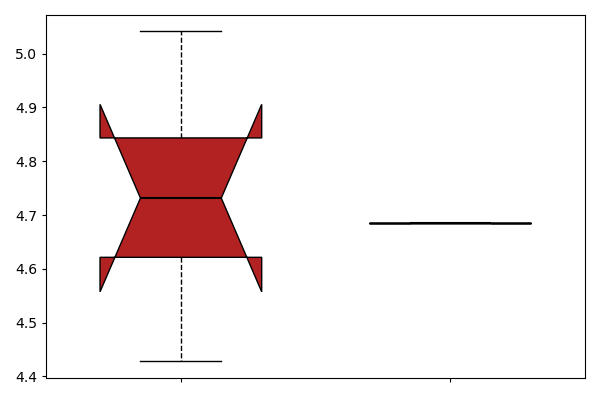
| The Expression Level of Disease Section Compare with the Healthy Individual Tissue | p-value:0.2491283266730848; Fold-change:1.05063124125272; Z-score:2.315316928726484 | ||||
| DT expression in the diseased tissue of patients
DT expression in the normal tissue of healthy individuals
|
|||||
|
 Please Click the above Thumbnail to View/Download
the Expression Barchart for All Samples Please Click the above Thumbnail to View/Download
the Expression Barchart for All Samples
|
||||
| The Studied Tissue | Transverse colon | ||||
| The Specified Disease | Active ulcerative colitis [ICD-11:DD71.Z] | ||||
| The Expression Level of Disease Section Compare with the Healthy Individual Tissue | p-value:0.6813246081189008; Fold-change:1.0196356942733775; Z-score:0.594053899674831 | ||||
| DT expression in the diseased tissue of patients
DT expression in the normal tissue of healthy individuals
|
|||||
|
|
|
||||
| [+] ICD-11: DD7Z Inflammatory bowel disease, unspecified | Click to Show/Hide the Full List | ||||
| The Studied Tissue | Colon | ||||
| The Specified Disease | Inflammatory bowel disease [ICD-11:DD7Z] | ||||
| The Expression Level of Disease Section Compare with the Healthy Individual Tissue | p-value:0.4627414006244514; Fold-change:1.0032824351636984; Z-score:-0.26607988 | ||||
| DT expression in the diseased tissue of patients
DT expression in the normal tissue of healthy individuals
|
|||||

|
 Please Click the above Thumbnail to View/Download
the Expression Barchart for All Samples Please Click the above Thumbnail to View/Download
the Expression Barchart for All Samples
|
||||
| The Studied Tissue | Sigmoid colon | ||||
| The Specified Disease | Inflammatory bowel disease [ICD-11:DD7Z] | ||||
| The Expression Level of Disease Section Compare with the Healthy Individual Tissue | p-value:0.700431620898092; Fold-change:0.999836053487786; Z-score:-0.075920373 | ||||
| DT expression in the diseased tissue of patients
DT expression in the normal tissue of healthy individuals
|
|||||

|
 Please Click the above Thumbnail to View/Download
the Expression Barchart for All Samples Please Click the above Thumbnail to View/Download
the Expression Barchart for All Samples
|
||||
| ICD-11: 14 Disease of the skin | |||||
| [+] ICD-11: EA80 Atopic dermatitis | Click to Show/Hide the Full List | ||||
| The Studied Tissue | Skin | ||||
| The Specified Disease | Atopic eczema [ICD-11:EA80] | ||||
| The Expression Level of Disease Section Compare with the Healthy Individual Tissue | p-value:0.0362691027160343; Fold-change:0.9834791467757528; Z-score:-0.64180943 | ||||
| DT expression in the diseased tissue of patients
DT expression in the normal tissue of healthy individuals
|
|||||
|
 Please Click the above Thumbnail to View/Download
the Expression Barchart for All Samples Please Click the above Thumbnail to View/Download
the Expression Barchart for All Samples
|
||||
| [+] ICD-11: EA91 Lichen planus (oral mucosal involvement) | Click to Show/Hide the Full List | ||||
| The Studied Tissue | Mouth mucosa | ||||
| The Specified Disease | Oral lichen planus [ICD-11:EA91.42] | ||||
| The Expression Level of Disease Section Compare with the Healthy Individual Tissue | p-value:0.4328284389695034; Fold-change:0.9990132958569852; Z-score:-0.378882777 | ||||
| DT expression in the diseased tissue of patients
DT expression in the normal tissue of healthy individuals
|
|||||
|
 Please Click the above Thumbnail to View/Download
the Expression Barchart for All Samples Please Click the above Thumbnail to View/Download
the Expression Barchart for All Samples
|
||||
| [+] ICD-11: ED90.0 Rosacea | Click to Show/Hide the Full List | ||||
| The Studied Tissue | Skin | ||||
| The Specified Disease | Rosacea [ICD-11:ED90.0] | ||||
| The Expression Level of Disease Section Compare with the Healthy Individual Tissue | p-value:0.8098887228962209; Fold-change:1.002326353073339; Z-score:-0.054951818 | ||||
| DT expression in the diseased tissue of patients
DT expression in the normal tissue of healthy individuals
|
|||||
|
 Please Click the above Thumbnail to View/Download
the Expression Barchart for All Samples Please Click the above Thumbnail to View/Download
the Expression Barchart for All Samples
|
||||
| [+] ICD-11: EK90.0 Actinic keratosis | Click to Show/Hide the Full List | ||||
| The Studied Tissue | Skin | ||||
| The Specified Disease | Actinic keratosis [ICD-11:EK90.0] | ||||
| The Expression Level of Disease Section Compare with the Healthy Individual Tissue | p-value:0.9370476235456484; Fold-change:0.7692307692307693; Z-score:0.1681806664853422 | ||||
| DT expression in the diseased tissue of patients
DT expression in the normal tissue of healthy individuals
|
|||||

|
 Please Click the above Thumbnail to View/Download
the Expression Barchart for All Samples Please Click the above Thumbnail to View/Download
the Expression Barchart for All Samples
|
||||
| ICD-11: 15 Disease of the musculoskeletal system/connective tissue | |||||
| [+] ICD-11: FA0Z Osteoarthritis, unspecified site | Click to Show/Hide the Full List | ||||
| The Studied Tissue | Bone | ||||
| The Specified Disease | Osteoarthritis [ICD-11:FA0Z] | ||||
| The Expression Level of Disease Section Compare with the Healthy Individual Tissue | p-value:0.9185038085481008; Fold-change:1.015425179501804; Z-score:0.0365065241285003 | ||||
| DT expression in the diseased tissue of patients
DT expression in the normal tissue of healthy individuals
|
|||||
|
 Please Click the above Thumbnail to View/Download
the Expression Barchart for All Samples Please Click the above Thumbnail to View/Download
the Expression Barchart for All Samples
|
||||
| ICD-11: 20 Developmental anomaly | |||||
| [+] ICD-11: LA88.2 Tetralogy of Fallot | Click to Show/Hide the Full List | ||||
| The Studied Tissue | Heart ventricle | ||||
| The Specified Disease | Tetralogy of fallot [ICD-11:LA88.2] | ||||
| The Expression Level of Disease Section Compare with the Healthy Individual Tissue | p-value:0.7024280347232987; Fold-change:0.8050847457627118; Z-score:-0.265959799 | ||||
| DT expression in the diseased tissue of patients
DT expression in the normal tissue of healthy individuals
|
|||||
|
 Please Click the above Thumbnail to View/Download
the Expression Barchart for All Samples Please Click the above Thumbnail to View/Download
the Expression Barchart for All Samples
|
||||
| [+] ICD-11: LB70.00 Unicoronal craniosynostosis | Click to Show/Hide the Full List | ||||
| The Studied Tissue | Skull | ||||
| The Specified Disease | Coronal craniosynostosis [ICD-11:LB70.00] | ||||
| DT expression in the diseased tissue of patients
DT expression in the normal tissue of healthy individuals
|
|||||

|
 Please Click the above Thumbnail to View/Download
the Expression Barchart for All Samples Please Click the above Thumbnail to View/Download
the Expression Barchart for All Samples
|
||||
| [+] ICD-11: LB70.02 Lambdoid craniosynostosis | Click to Show/Hide the Full List | ||||
| The Studied Tissue | Skull | ||||
| The Specified Disease | Lambdoid craniosynostosis [ICD-11:LB70.3] | ||||
| DT expression in the diseased tissue of patients
DT expression in the normal tissue of healthy individuals
|
|||||
|
 Please Click the above Thumbnail to View/Download
the Expression Barchart for All Samples Please Click the above Thumbnail to View/Download
the Expression Barchart for All Samples
|
||||
| [+] ICD-11: LB70.03 Metopic craniosynostosis | Click to Show/Hide the Full List | ||||
| The Studied Tissue | Skull | ||||
| The Specified Disease | Metopic craniosynostosis [ICD-11:LB70.2] | ||||
| DT expression in the diseased tissue of patients
DT expression in the normal tissue of healthy individuals
|
|||||

|
 Please Click the above Thumbnail to View/Download
the Expression Barchart for All Samples Please Click the above Thumbnail to View/Download
the Expression Barchart for All Samples
|
||||
| [+] ICD-11: LB70.0Y Sagittal craniosynostosis | Click to Show/Hide the Full List | ||||
| The Studied Tissue | Skull | ||||
| The Specified Disease | Sagittal craniosynostosis [ICD-11:LB70.1] | ||||
| The Expression Level of Disease Section Compare with the Healthy Individual Tissue | p-value:0.5389182882887396; Fold-change:1; Z-score:0.8999999999999999 | ||||
| DT expression in the diseased tissue of patients
DT expression in the normal tissue of healthy individuals
|
|||||
|
 Please Click the above Thumbnail to View/Download
the Expression Barchart for All Samples Please Click the above Thumbnail to View/Download
the Expression Barchart for All Samples
|
||||
| [+] ICD-11: LC02 Sebaceous naevus (nevus sebaceus of Jadassohn) | Click to Show/Hide the Full List | ||||
| The Studied Tissue | Skin | ||||
| The Specified Disease | Sebaceous of jadassohn nevus [ICD-11:LD2D.Y] | ||||
| The Expression Level of Disease Section Compare with the Healthy Individual Tissue | p-value:0.2677957435305225; Fold-change:1.3846153846153846; Z-score:0.991325791891862 | ||||
| DT expression in the diseased tissue of patients
DT expression in the normal tissue of healthy individuals
|
|||||
|
 Please Click the above Thumbnail to View/Download
the Expression Barchart for All Samples Please Click the above Thumbnail to View/Download
the Expression Barchart for All Samples
|
||||
| ICD-11: 25 Codes for special purposes | |||||
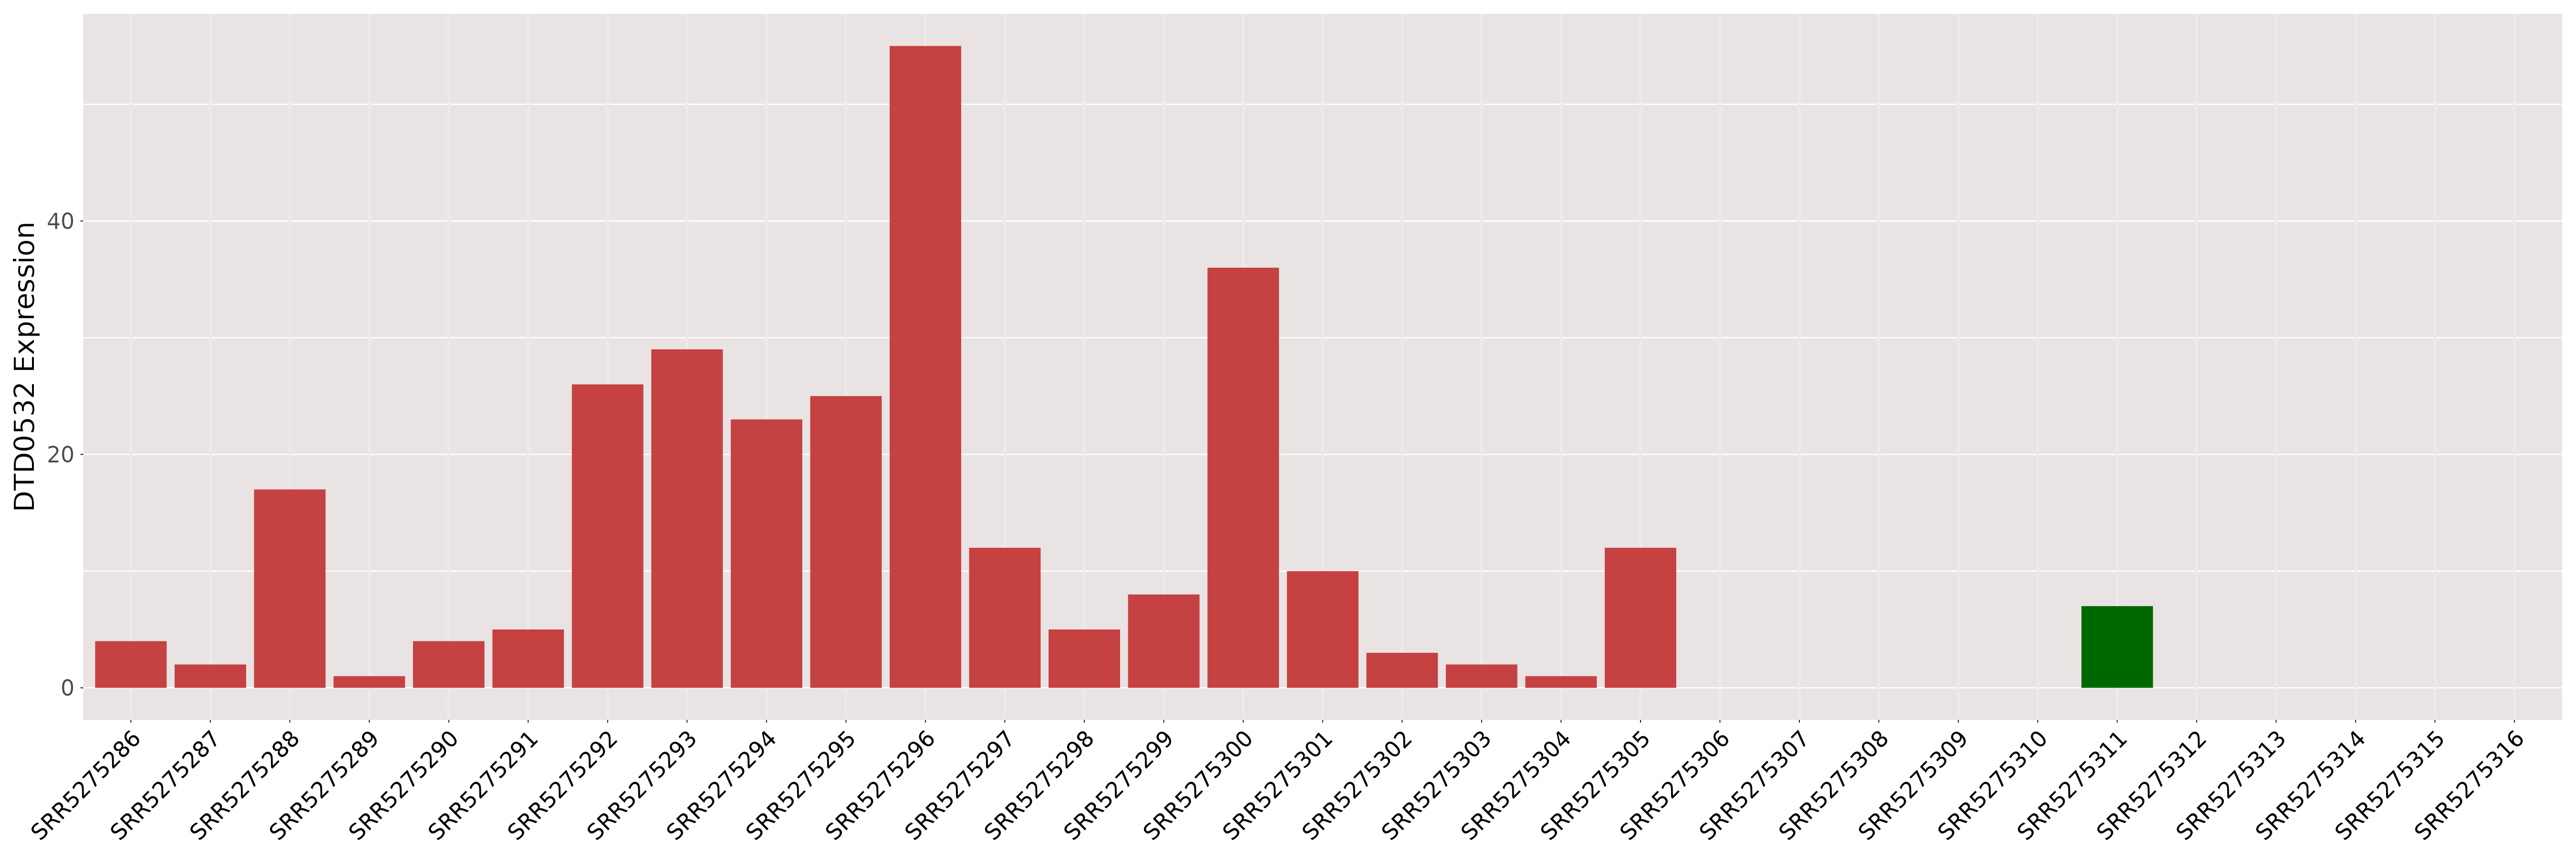
| [+] ICD-11: RA01 COVID-19 | Click to Show/Hide the Full List | ||||
| The Studied Tissue | Lung | ||||
| The Specified Disease | Covid [ICD-11:RA01.0] | ||||
| DT expression in the diseased tissue of patients
DT expression in the normal tissue of healthy individuals
|
|||||
|
 Please Click the above Thumbnail to View/Download
the Expression Barchart for All Samples Please Click the above Thumbnail to View/Download
the Expression Barchart for All Samples
|
||||
| The Studied Tissue | Colon | ||||
| The Specified Disease | Covid [ICD-11:RA01.0] | ||||
| DT expression in the diseased tissue of patients
DT expression in the normal tissue of healthy individuals
|
|||||

|
 Please Click the above Thumbnail to View/Download
the Expression Barchart for All Samples Please Click the above Thumbnail to View/Download
the Expression Barchart for All Samples
|
||||
| ICD-11: 28 Extension Codes | |||||
| [+] ICD-11: XH12D2 Pilocytic astrocytoma | Click to Show/Hide the Full List | ||||
| The Studied Tissue | Brain | ||||
| The Specified Disease | Astrocytoma, pilocytic [ICD-11:XH12D2] | ||||
| The Expression Level of Disease Section Compare with the Healthy Individual Tissue | p-value:0.0579047553376597; Fold-change:0.936498631631121; Z-score:-0.642275381 | ||||
| DT expression in the diseased tissue of patients
DT expression in the normal tissue of healthy individuals
|
|||||

|
 Please Click the above Thumbnail to View/Download
the Expression Barchart for All Samples Please Click the above Thumbnail to View/Download
the Expression Barchart for All Samples
|
||||
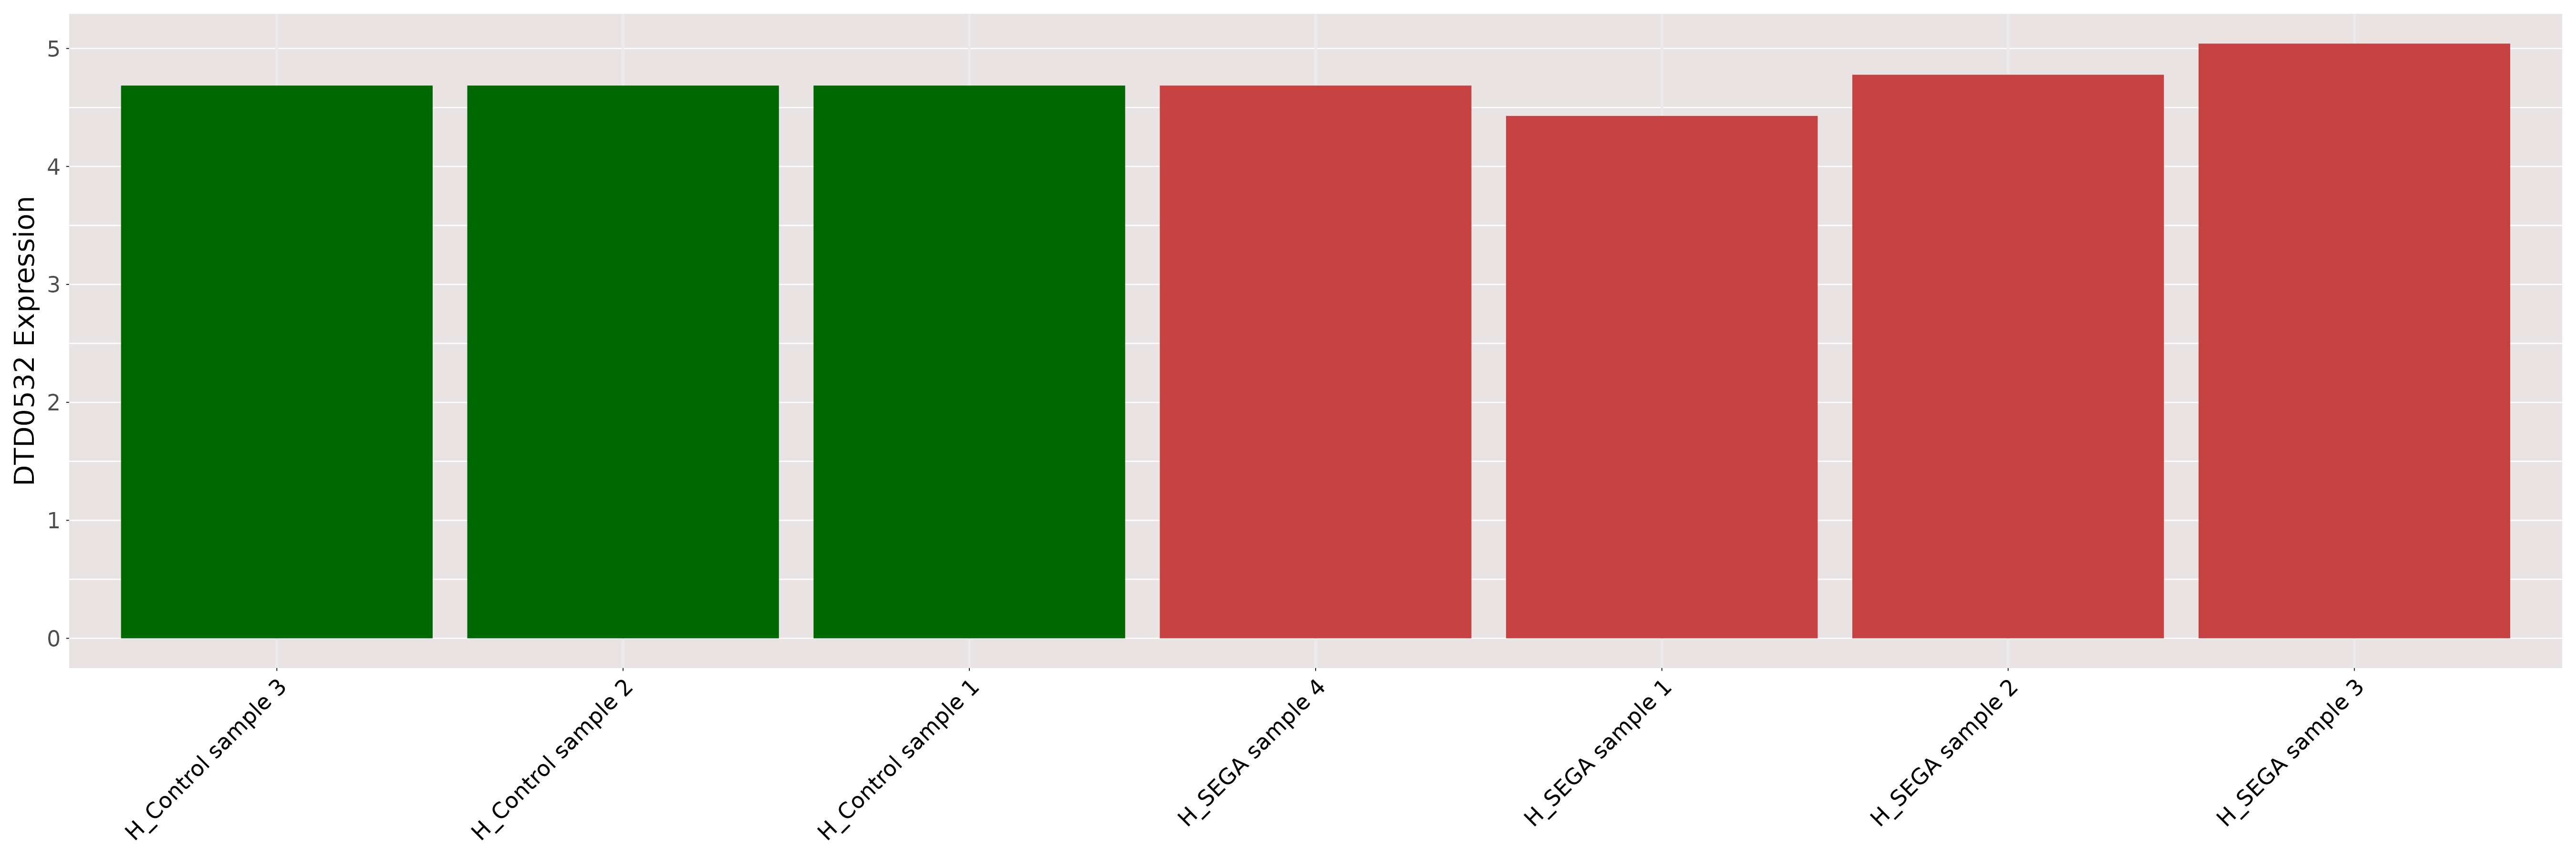
| [+] ICD-11: XH1L48 Subependymal giant cell astrocytoma | Click to Show/Hide the Full List | ||||
| The Studied Tissue | Brain | ||||
| The Specified Disease | Subependymal giant cell astrocytoma [ICD-11:XH1L48] | ||||
| The Expression Level of Disease Section Compare with the Healthy Individual Tissue | p-value:0.7635205880101188; Fold-change:1.0097908882942264; Z-score:inf | ||||
| DT expression in the diseased tissue of patients
DT expression in the normal tissue of healthy individuals
|
|||||
|
 Please Click the above Thumbnail to View/Download
the Expression Barchart for All Samples Please Click the above Thumbnail to View/Download
the Expression Barchart for All Samples
|
||||
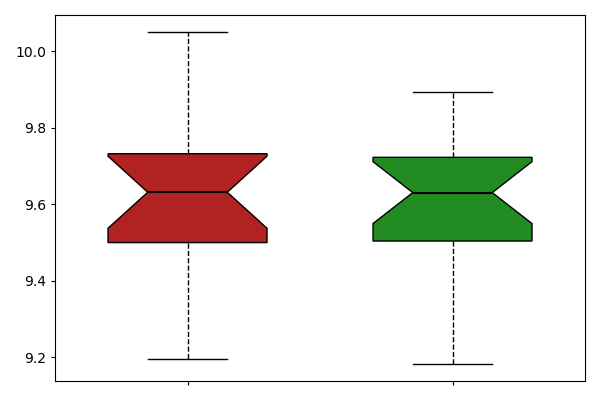
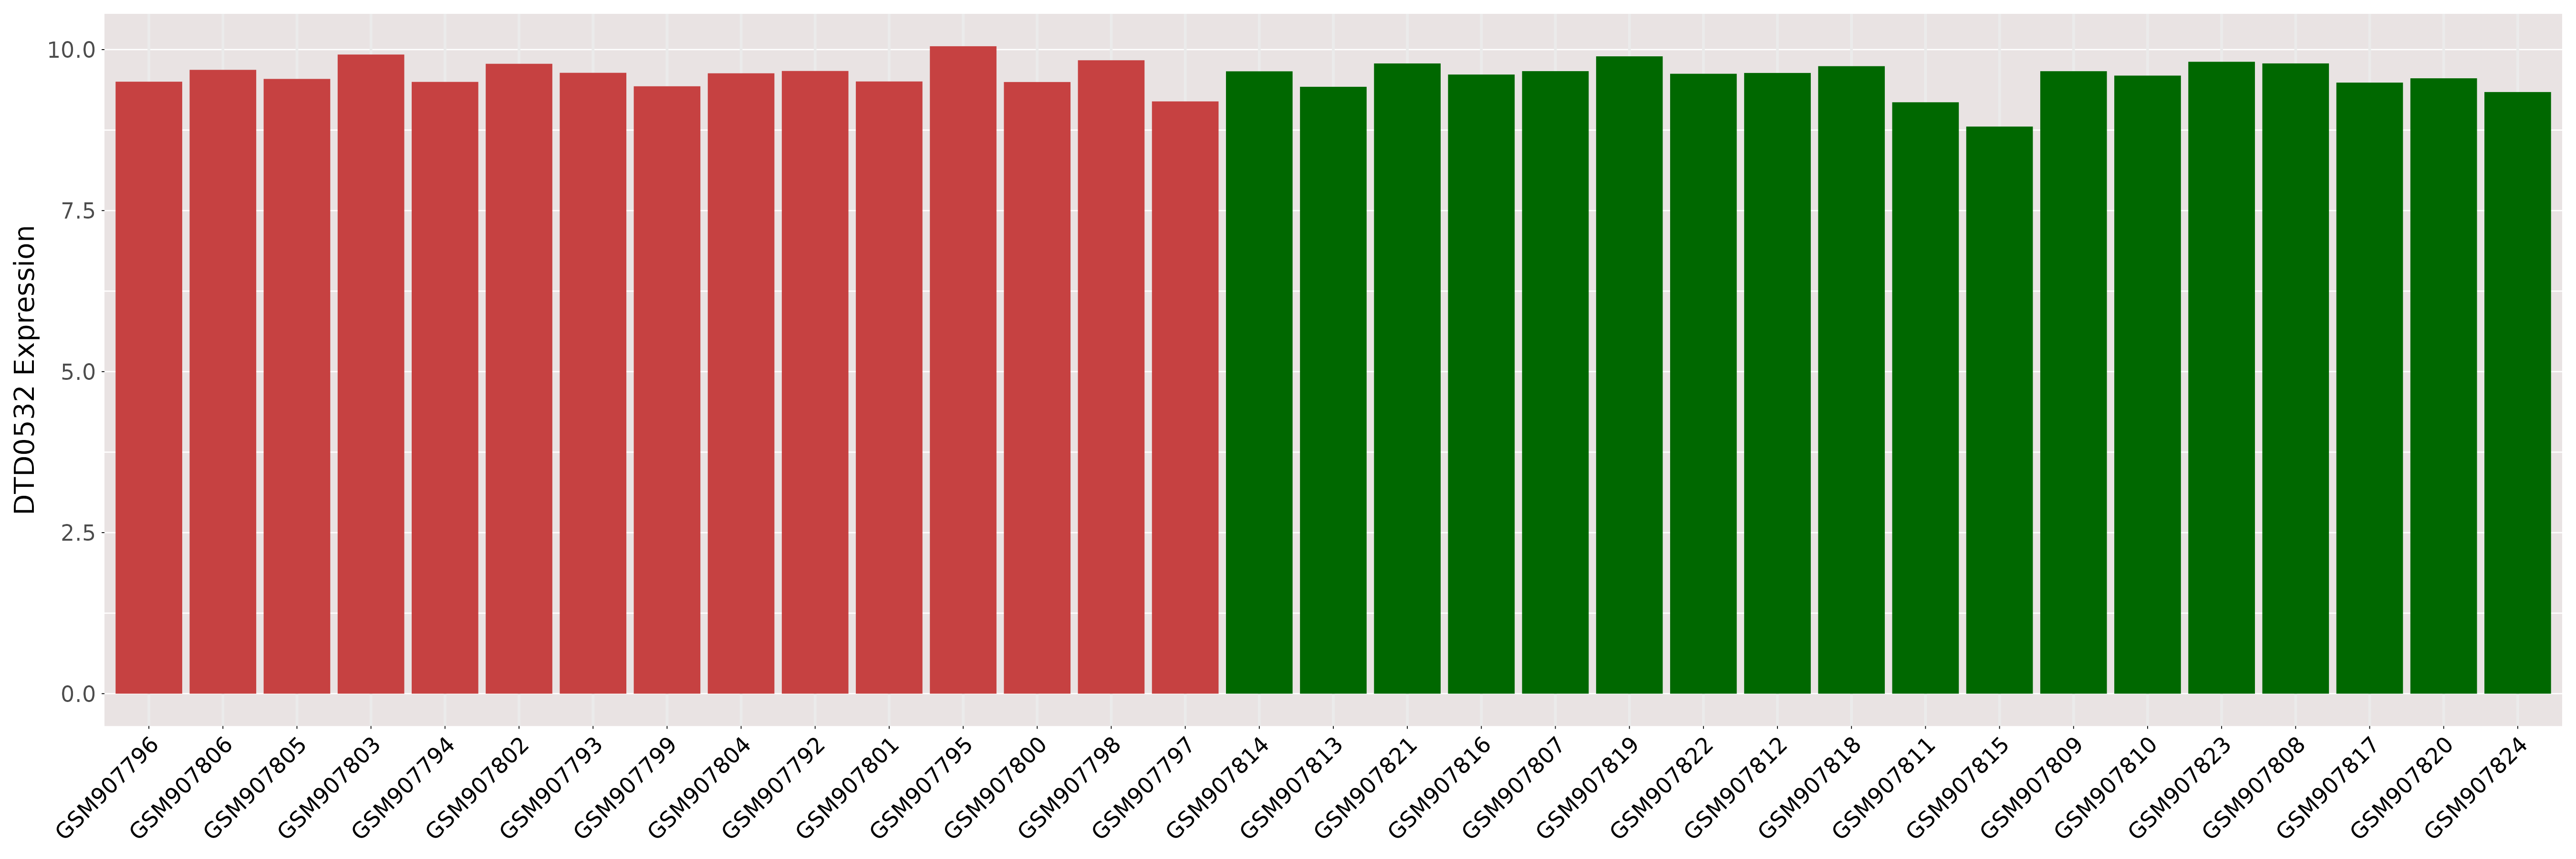
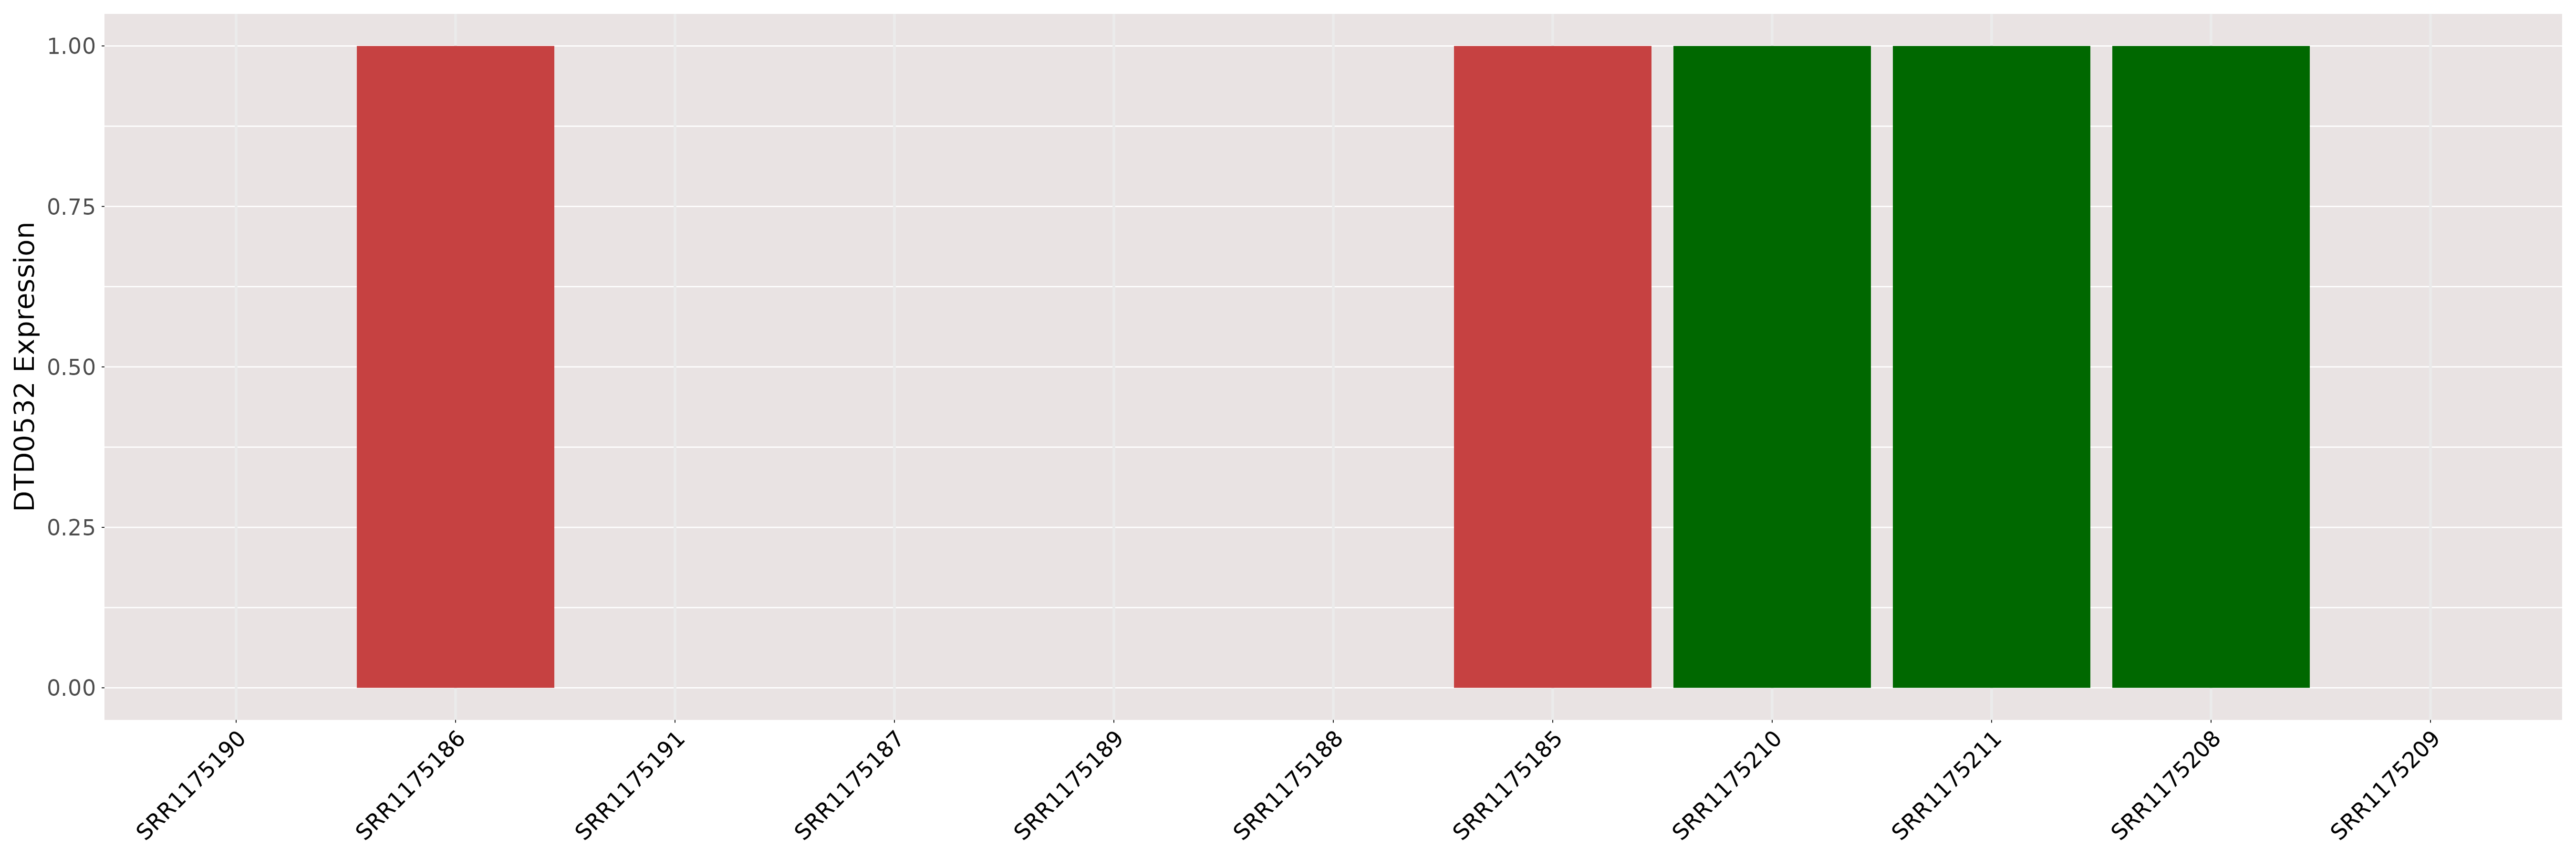
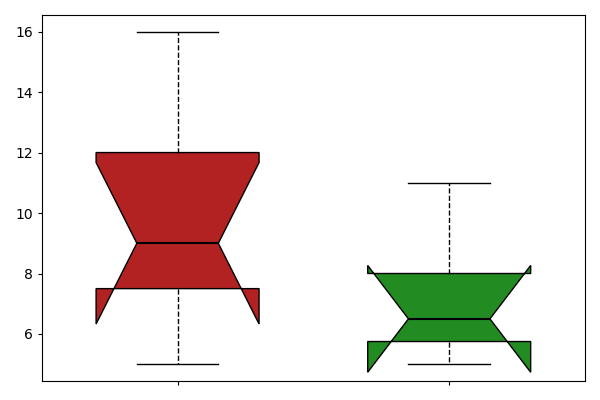
| [+] ICD-11: XH77N6 Clear cell sarcoma, NOS (soft tissue) | Click to Show/Hide the Full List | ||||
| The Studied Tissue | Kidney | ||||
| The Specified Disease | Clear cell sarcoma [ICD-11:XH77N6] | ||||
| The Expression Level of Disease Section Compare with the Healthy Individual Tissue | p-value:0.6289489712015981; Fold-change:0.9847540610673527; Z-score:-1.091736595 | ||||
| DT expression in the diseased tissue of patients
DT expression in the normal tissue of healthy individuals
|
|||||
|
|
|
||||
| [+] ICD-11: XH7ZQ4 Atypical teratoid/rhabdoid tumour | Click to Show/Hide the Full List | ||||
| The Studied Tissue | Brain | ||||
| The Specified Disease | Atypical teratoid rhabdoid tumor [ICD-11:XH7ZQ4] | ||||
| The Expression Level of Disease Section Compare with the Healthy Individual Tissue | p-value:0.617739904700852; Fold-change:0.9948873476894332; Z-score:-0.33555842 | ||||
| DT expression in the diseased tissue of patients
DT expression in the normal tissue of healthy individuals
|
|||||

|
 Please Click the above Thumbnail to View/Download
the Expression Barchart for All Samples Please Click the above Thumbnail to View/Download
the Expression Barchart for All Samples
|
||||
If you find any error in data or bug in web service, please kindly report it to Dr. Li and Dr. Fu.