
Detail Information of Disease-specific Protein Abundances
| General Information of Drug Transporter (DT) | |||||
|---|---|---|---|---|---|
| DT ID | DTD0529 Transporter Info | ||||
| Gene Name | SCN9A | ||||
| Protien Name | Voltage-gated sodium channel alpha Nav1.7 | ||||
| Gene ID | |||||
| UniProt ID | |||||
| Disease-specific Protein Abundances of DT (DPAD) | |||||
|---|---|---|---|---|---|
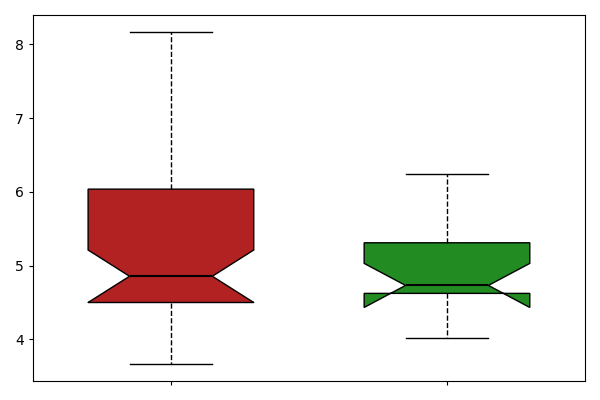
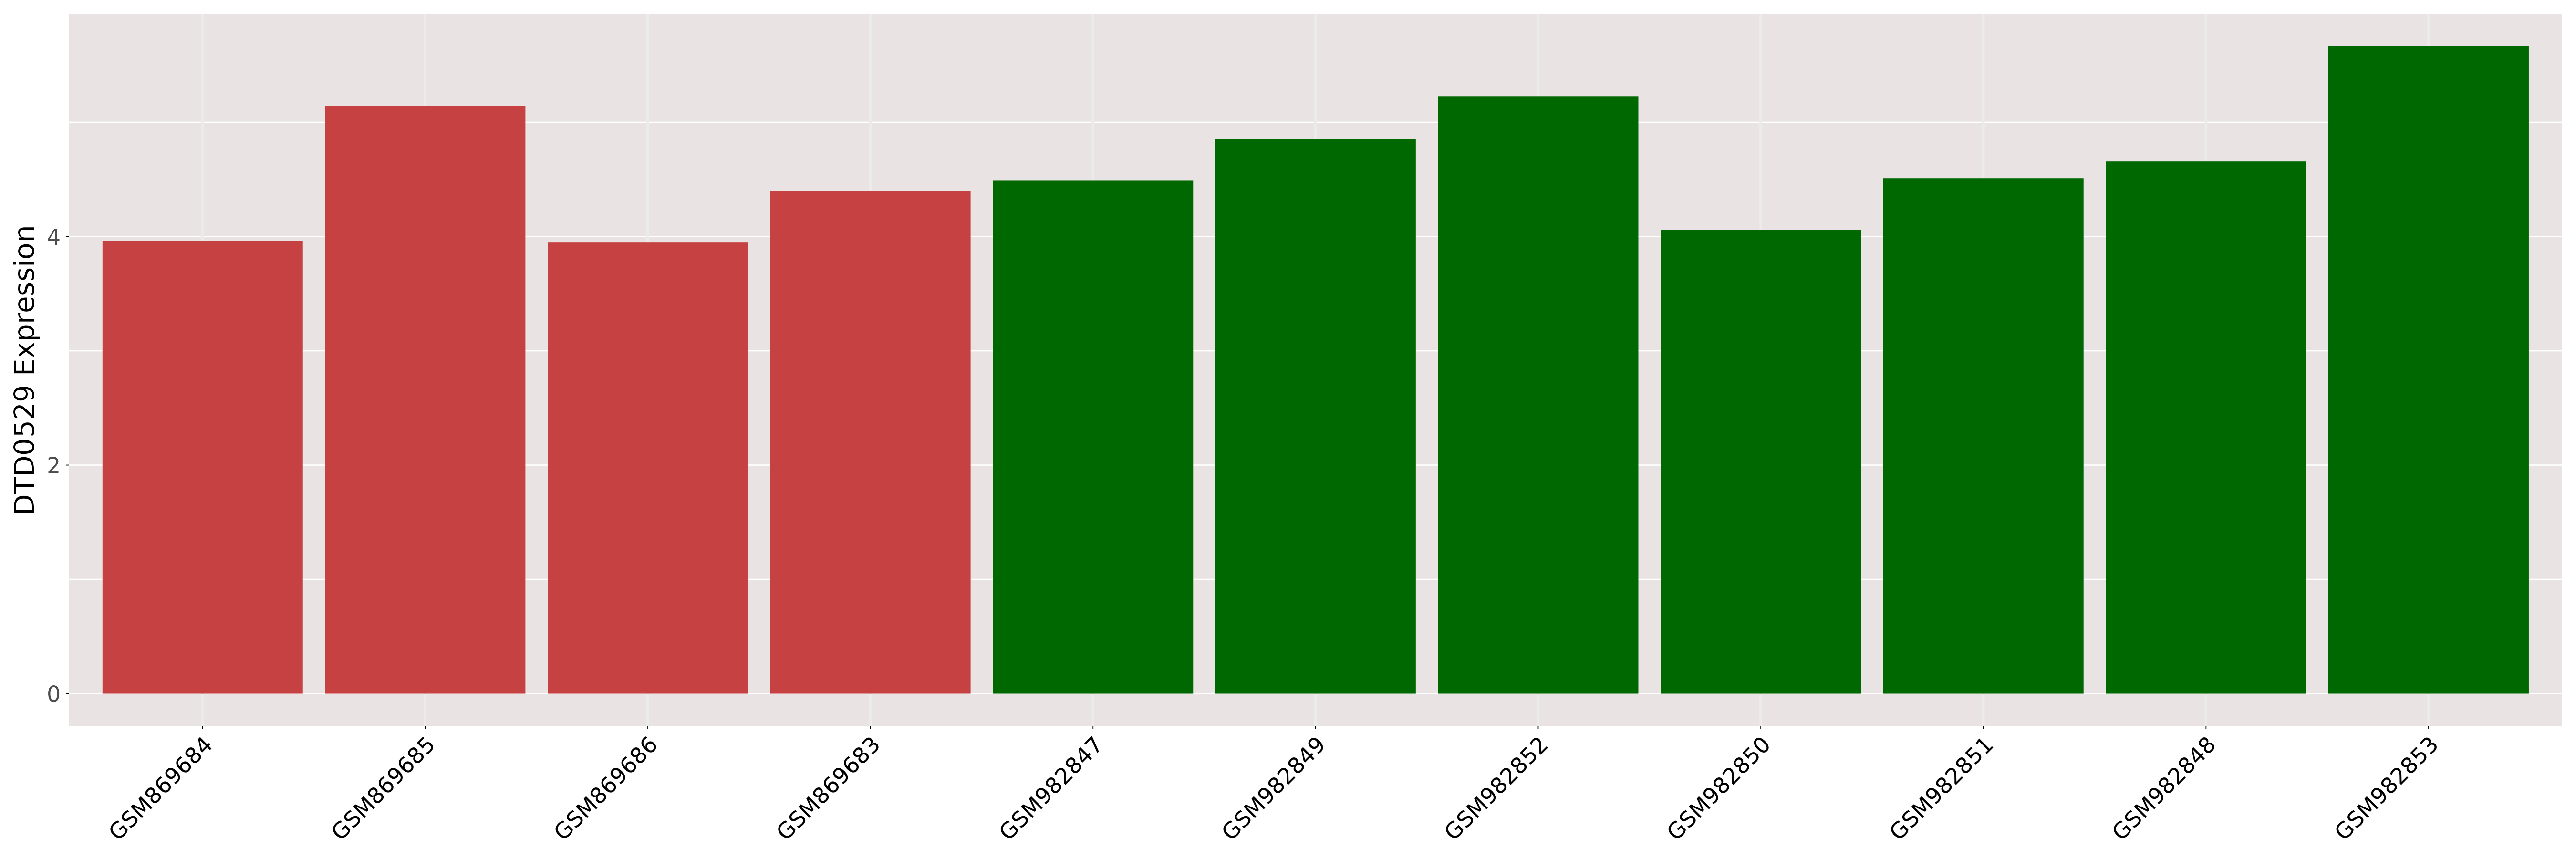
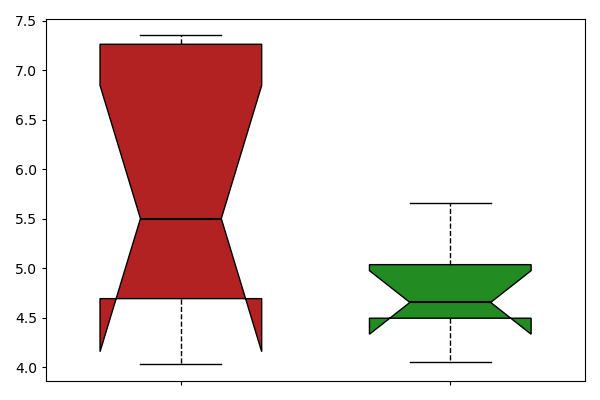
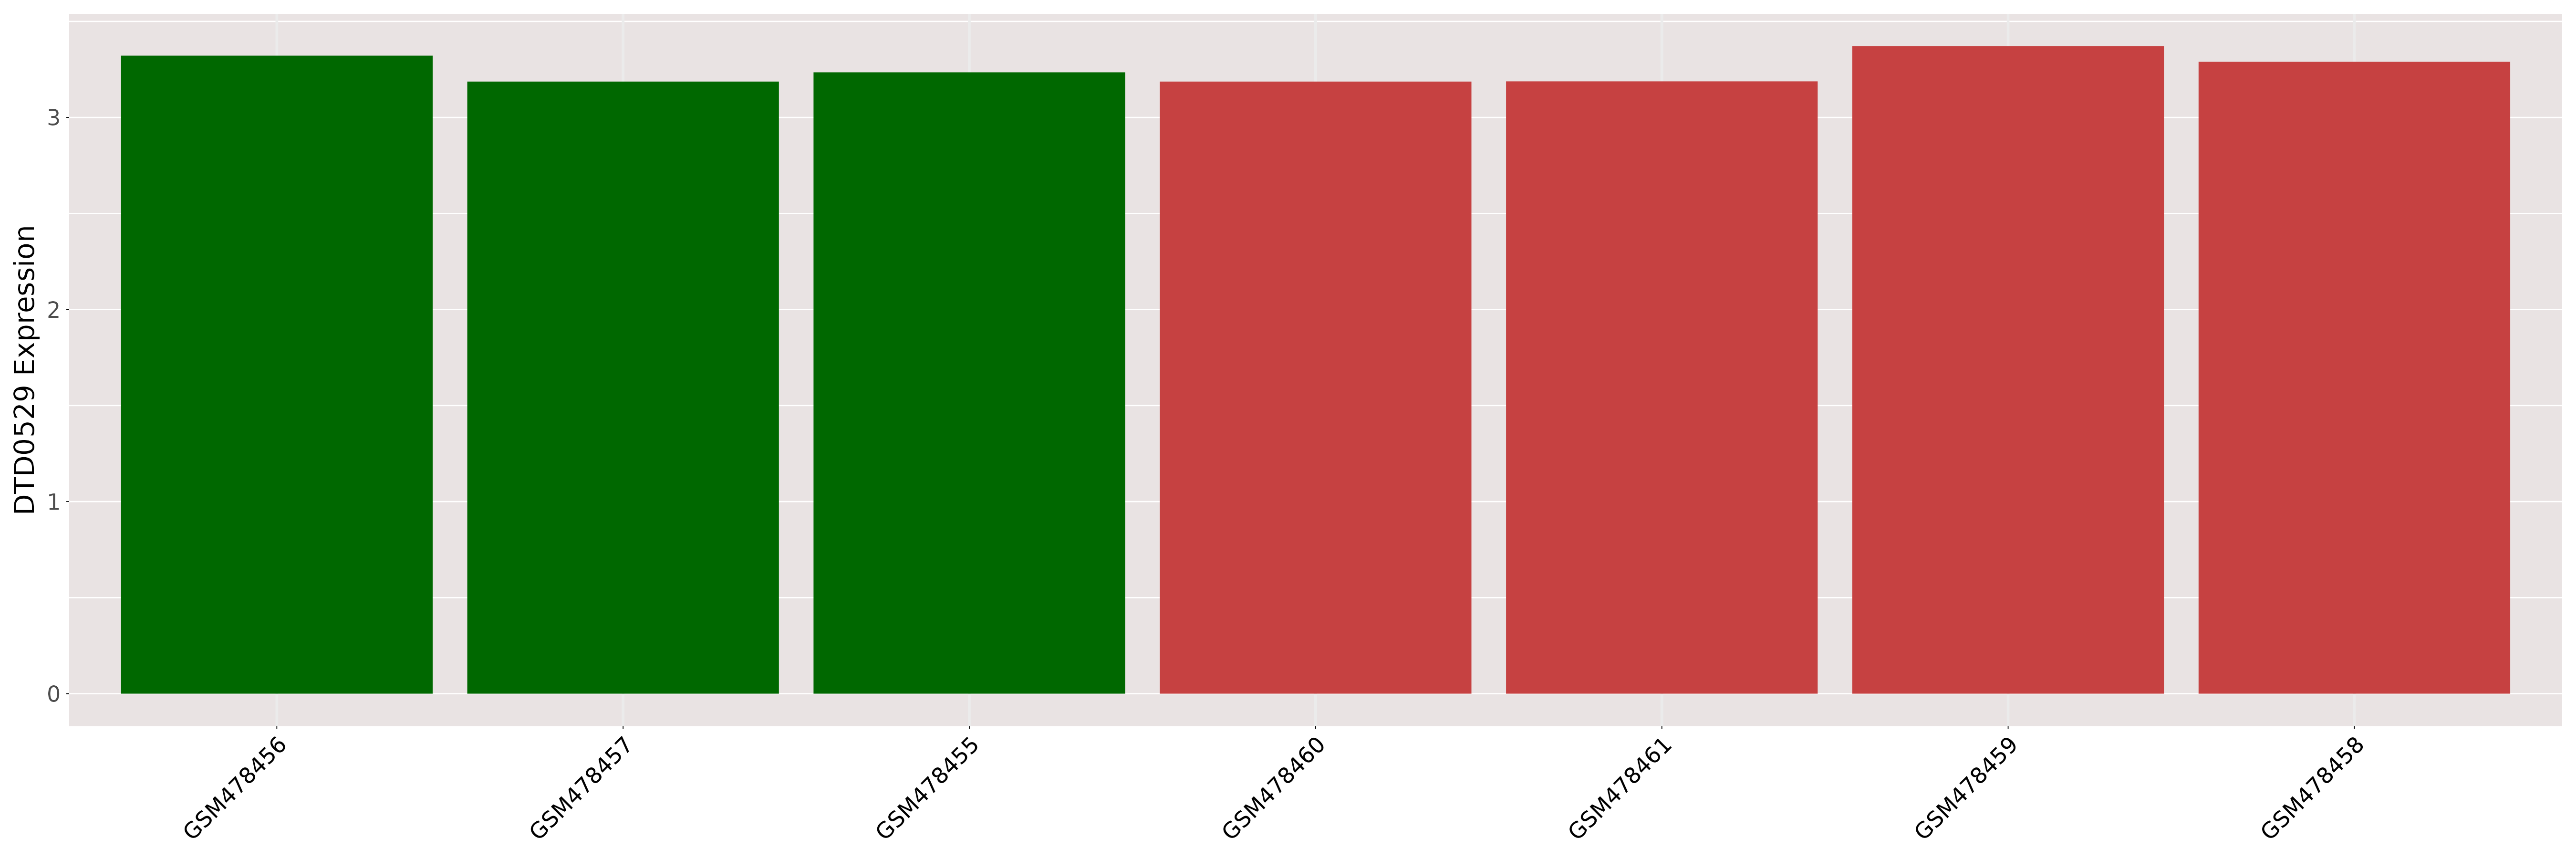
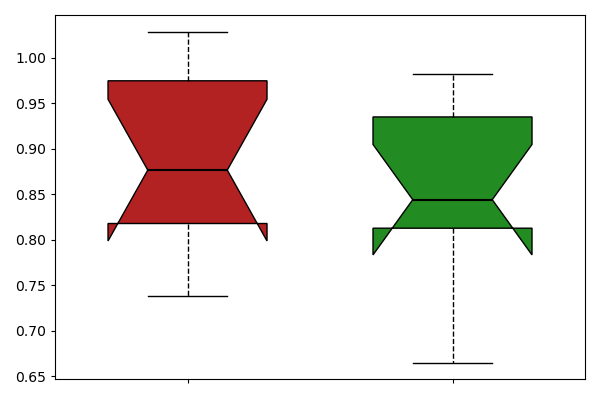
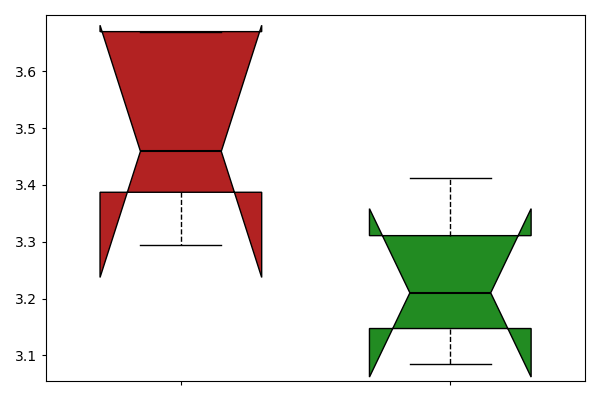
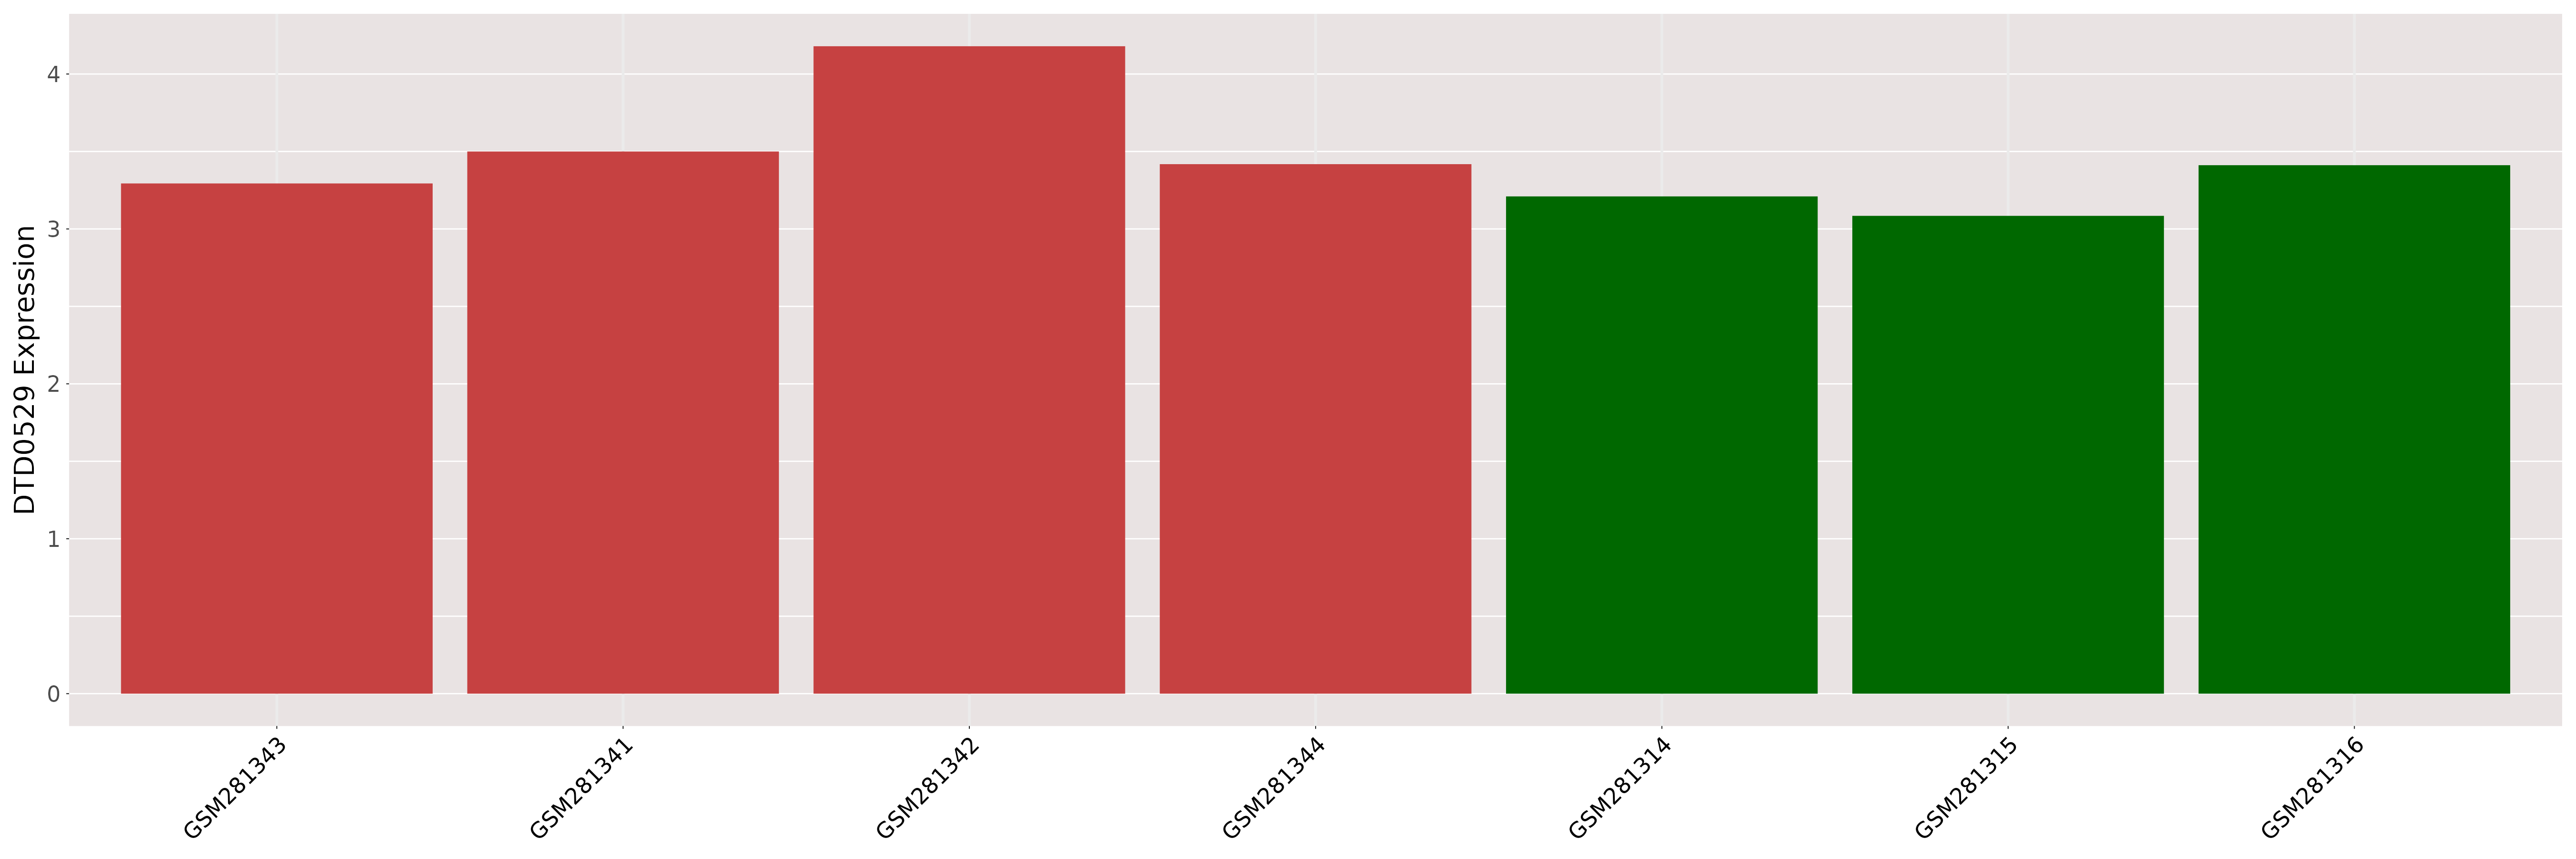
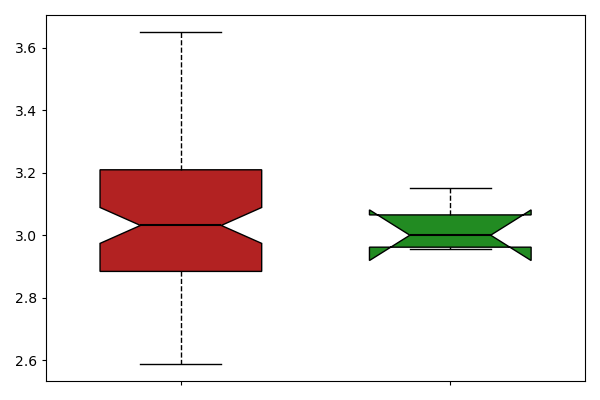
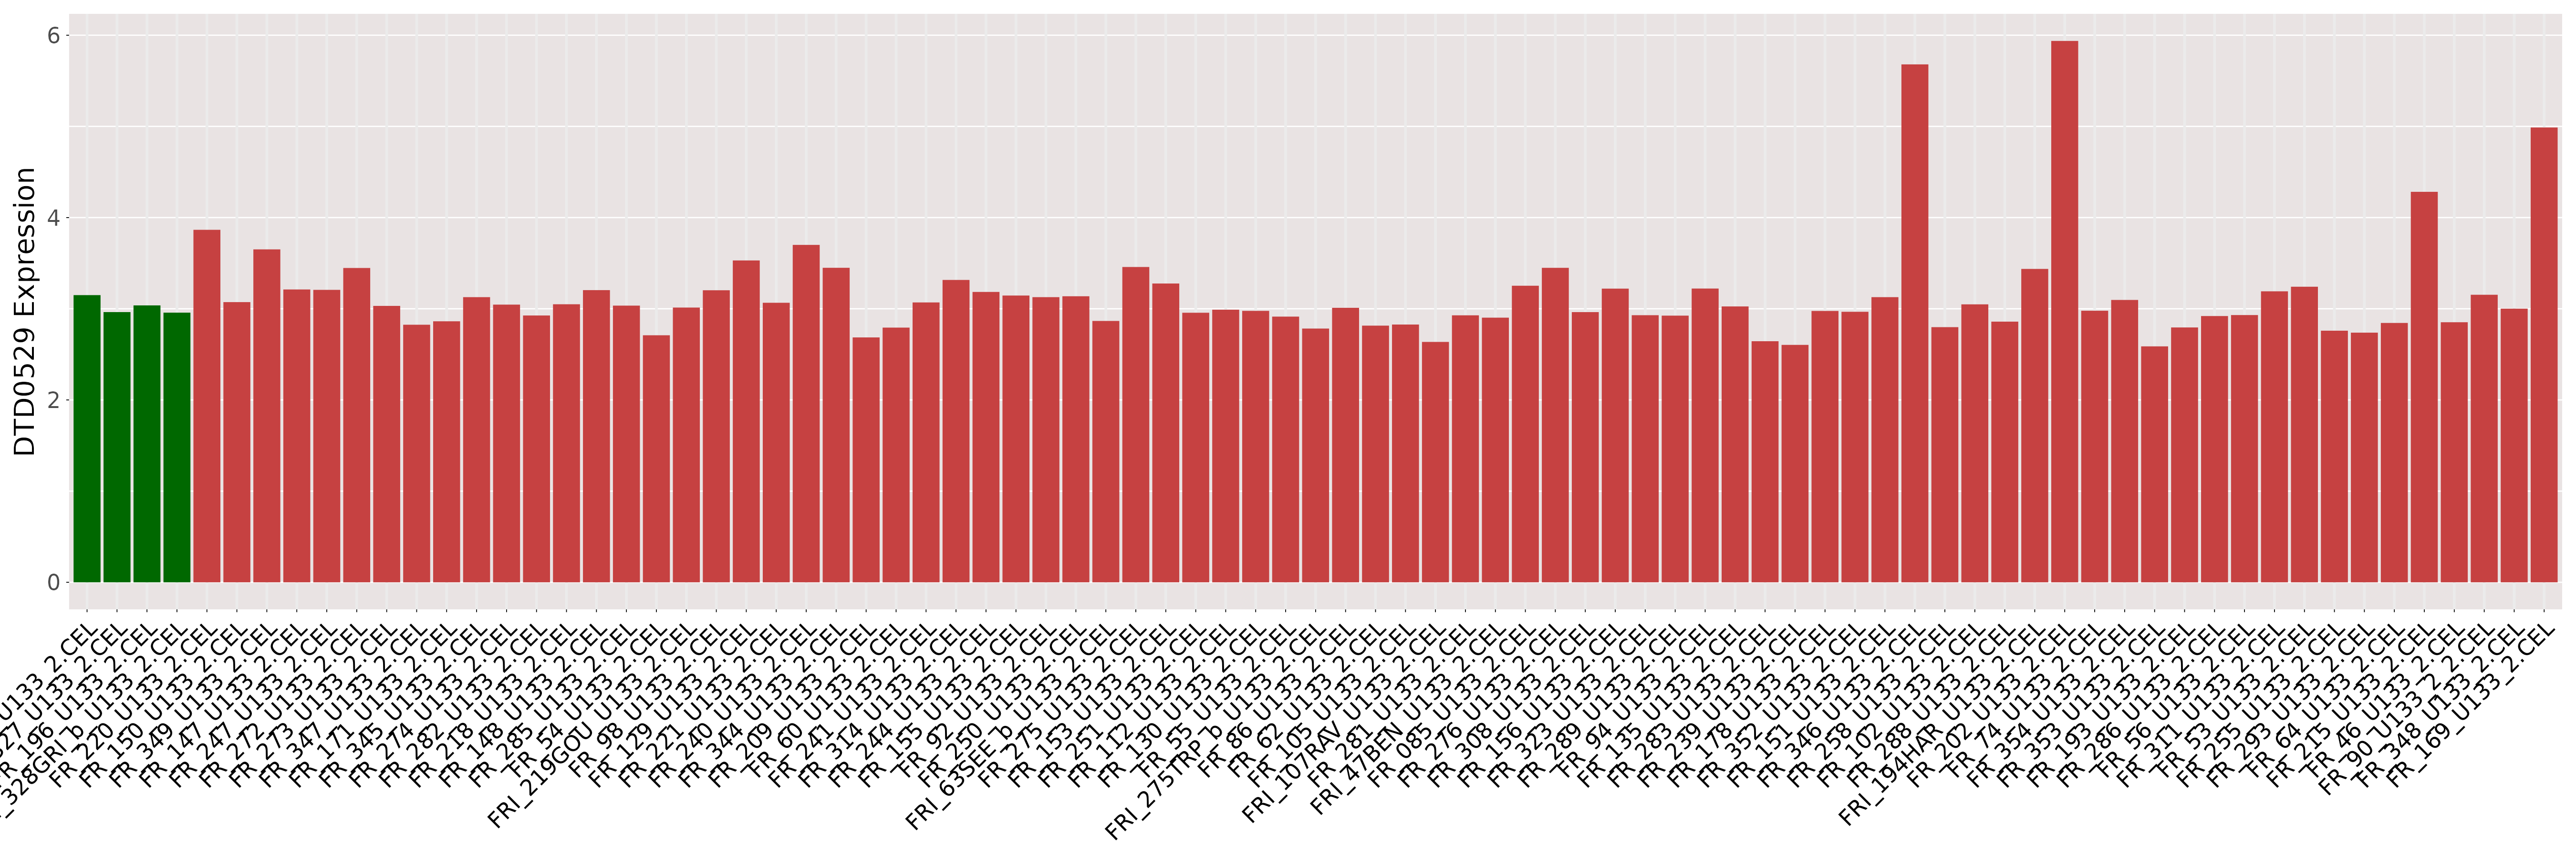
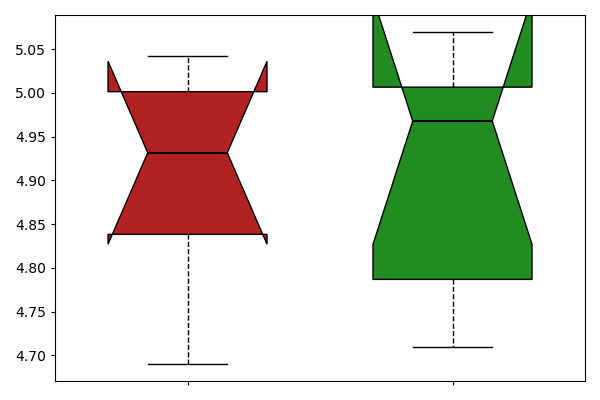
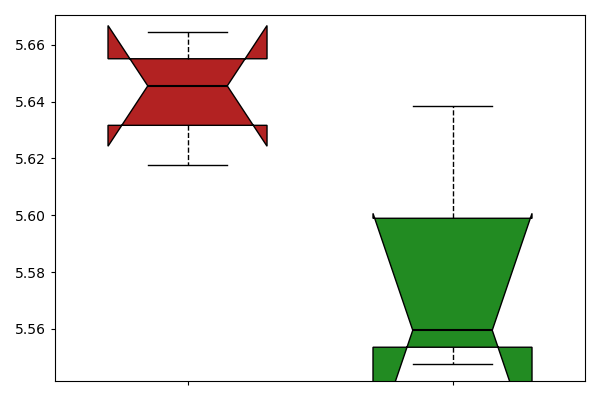
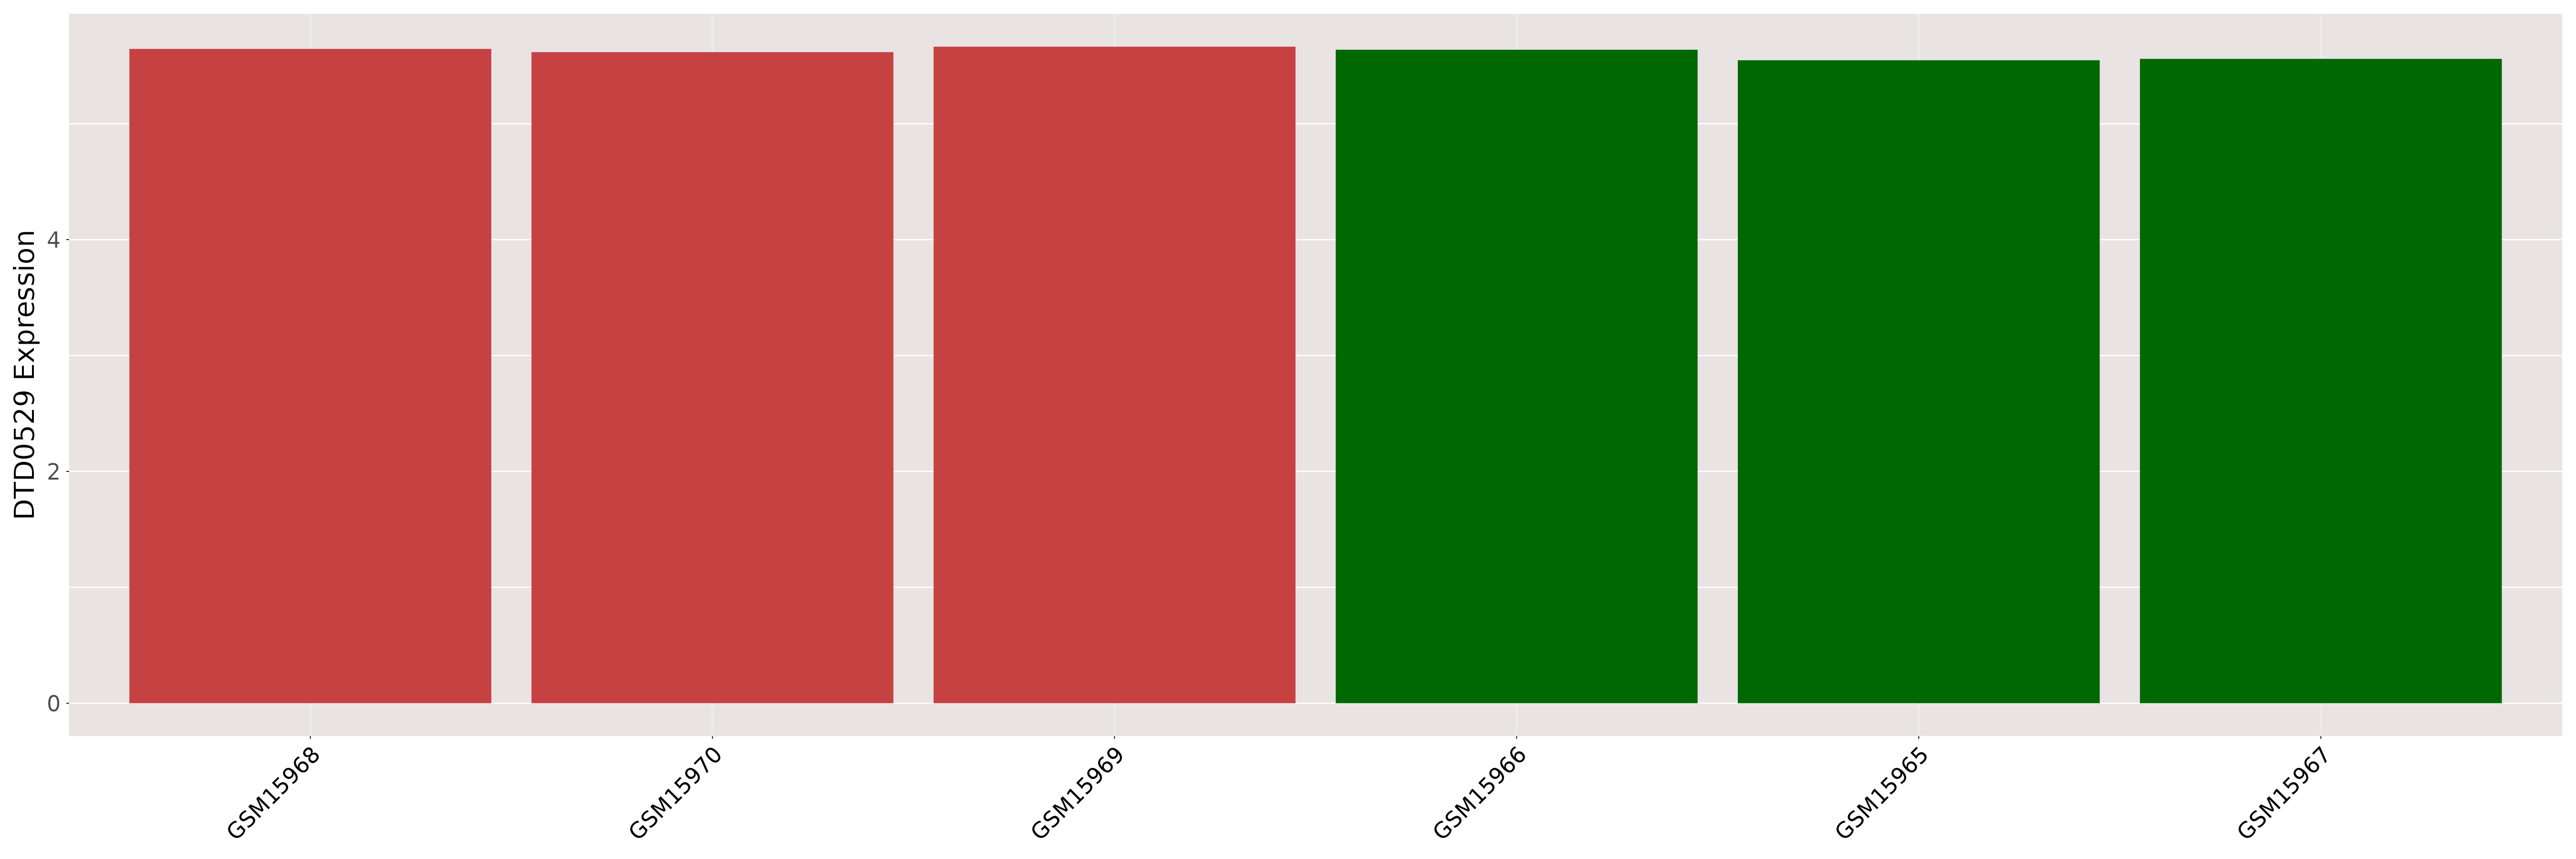
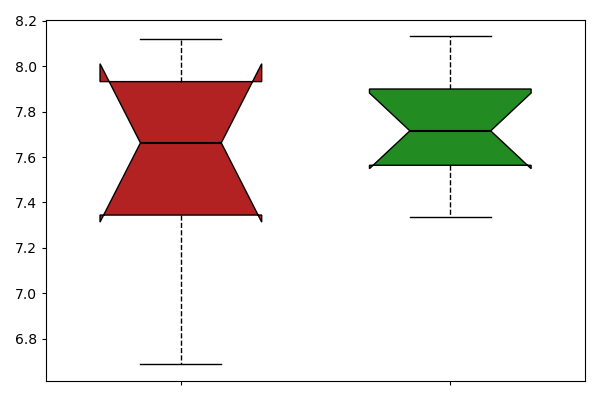
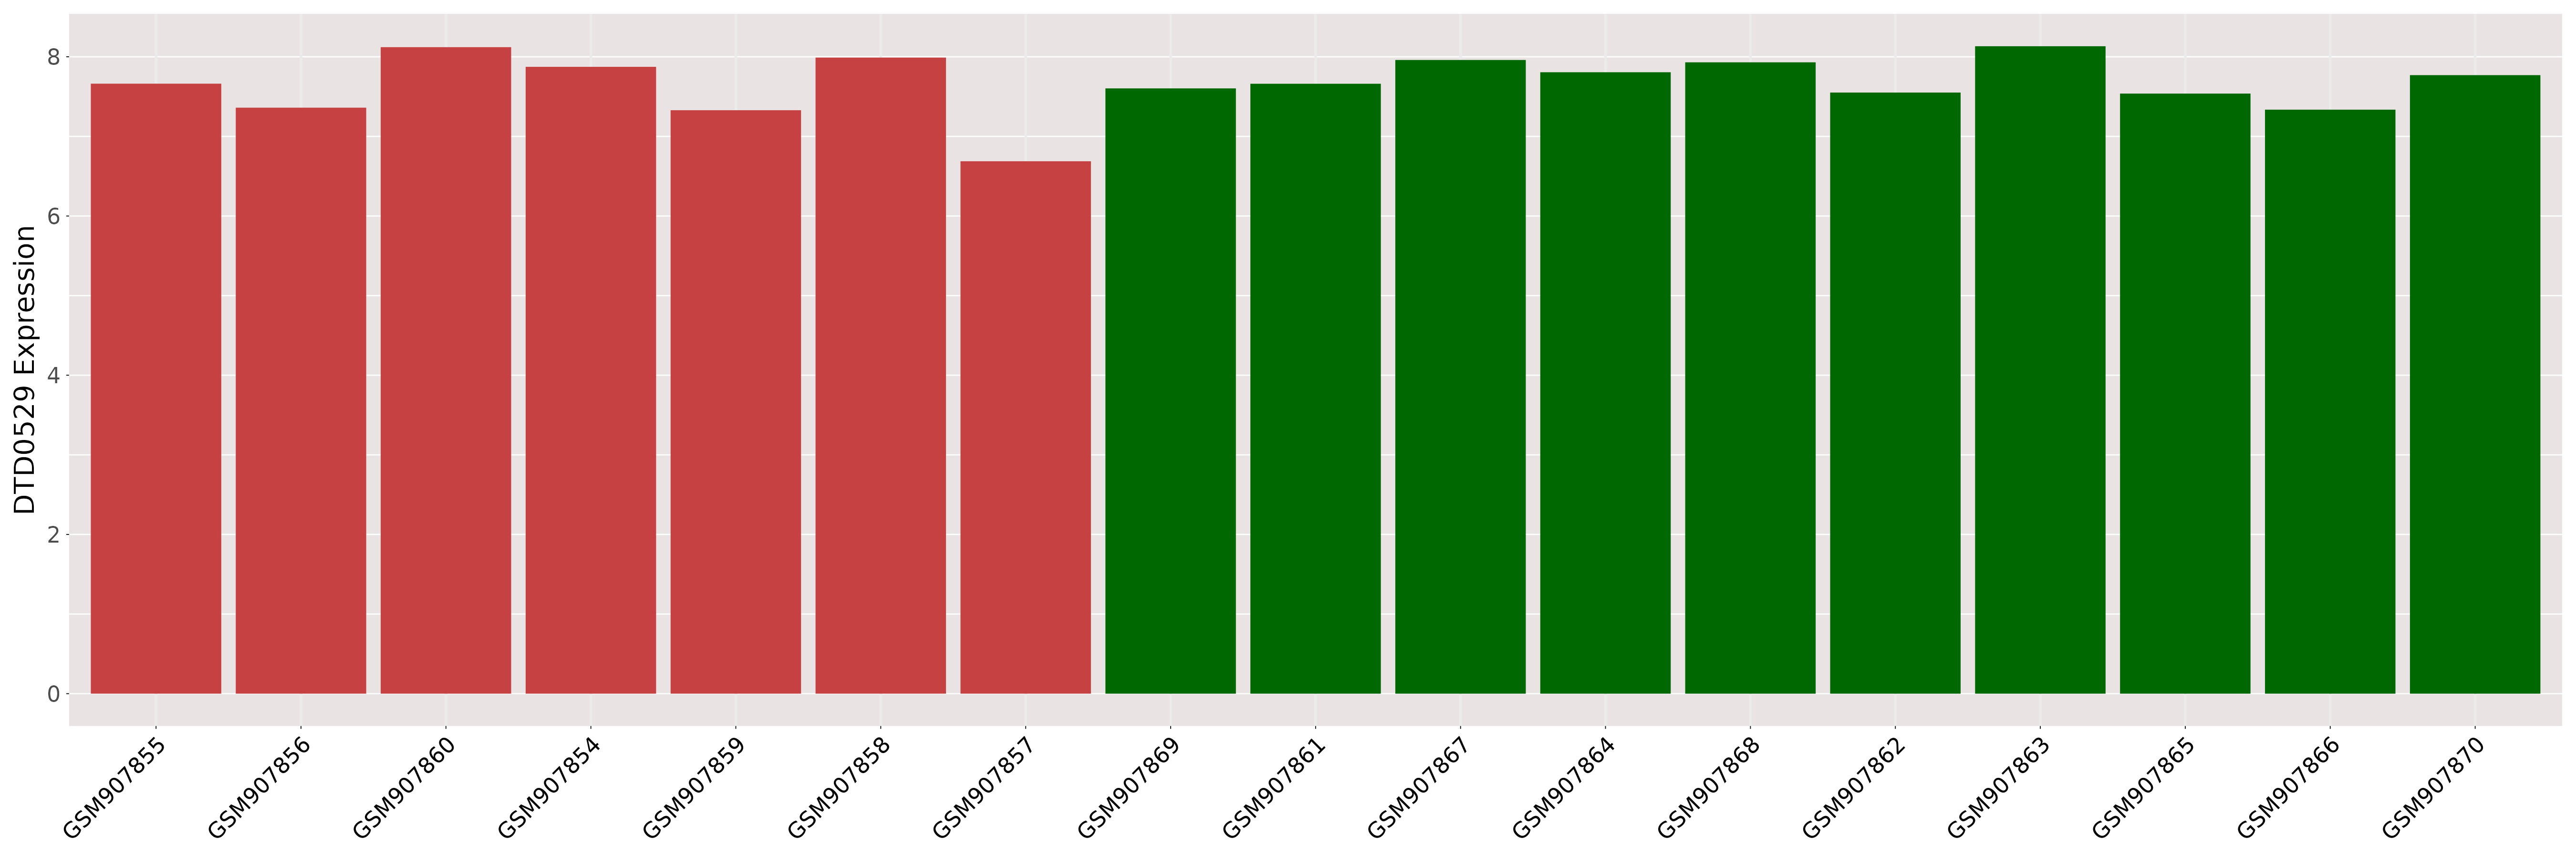
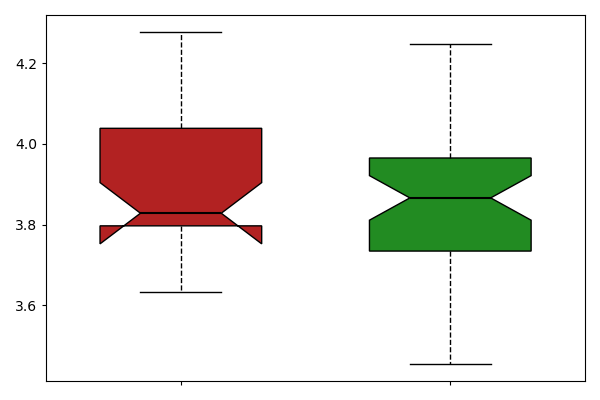
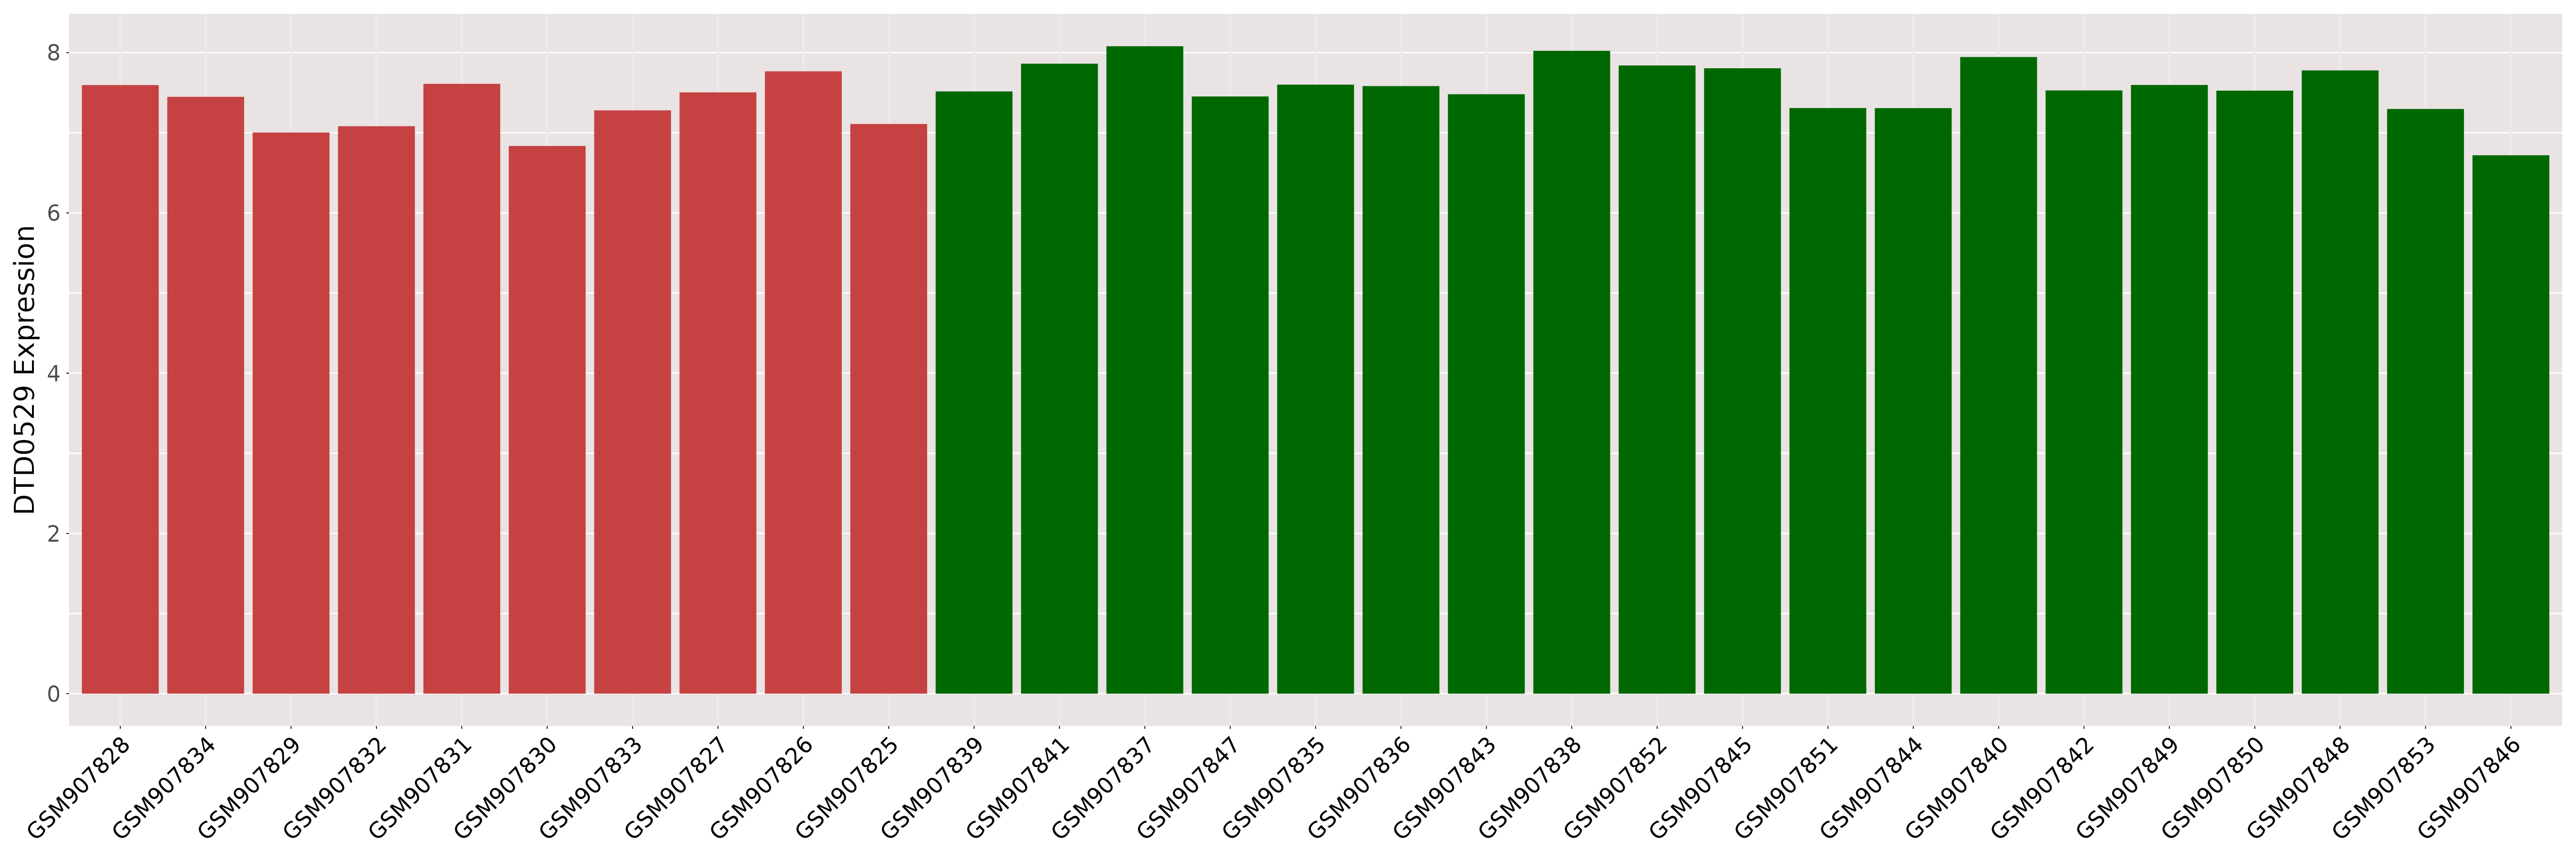
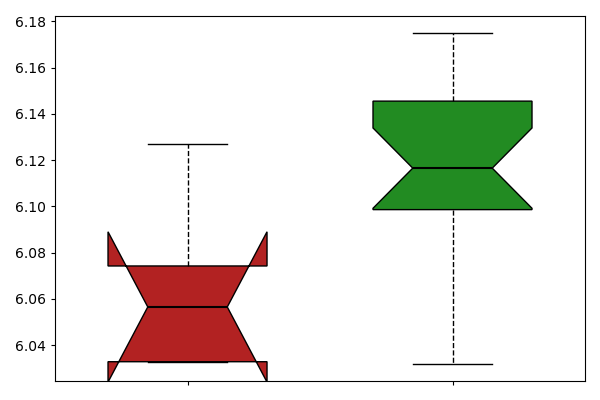
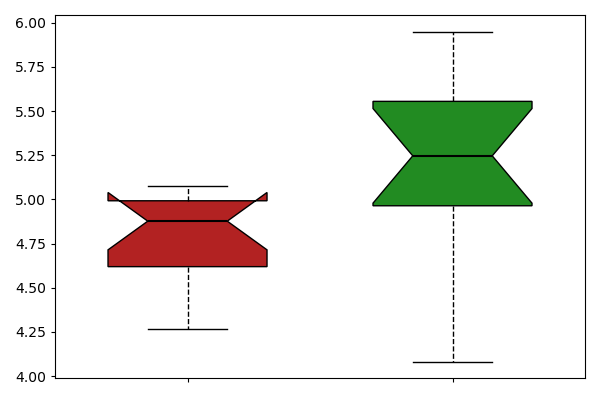
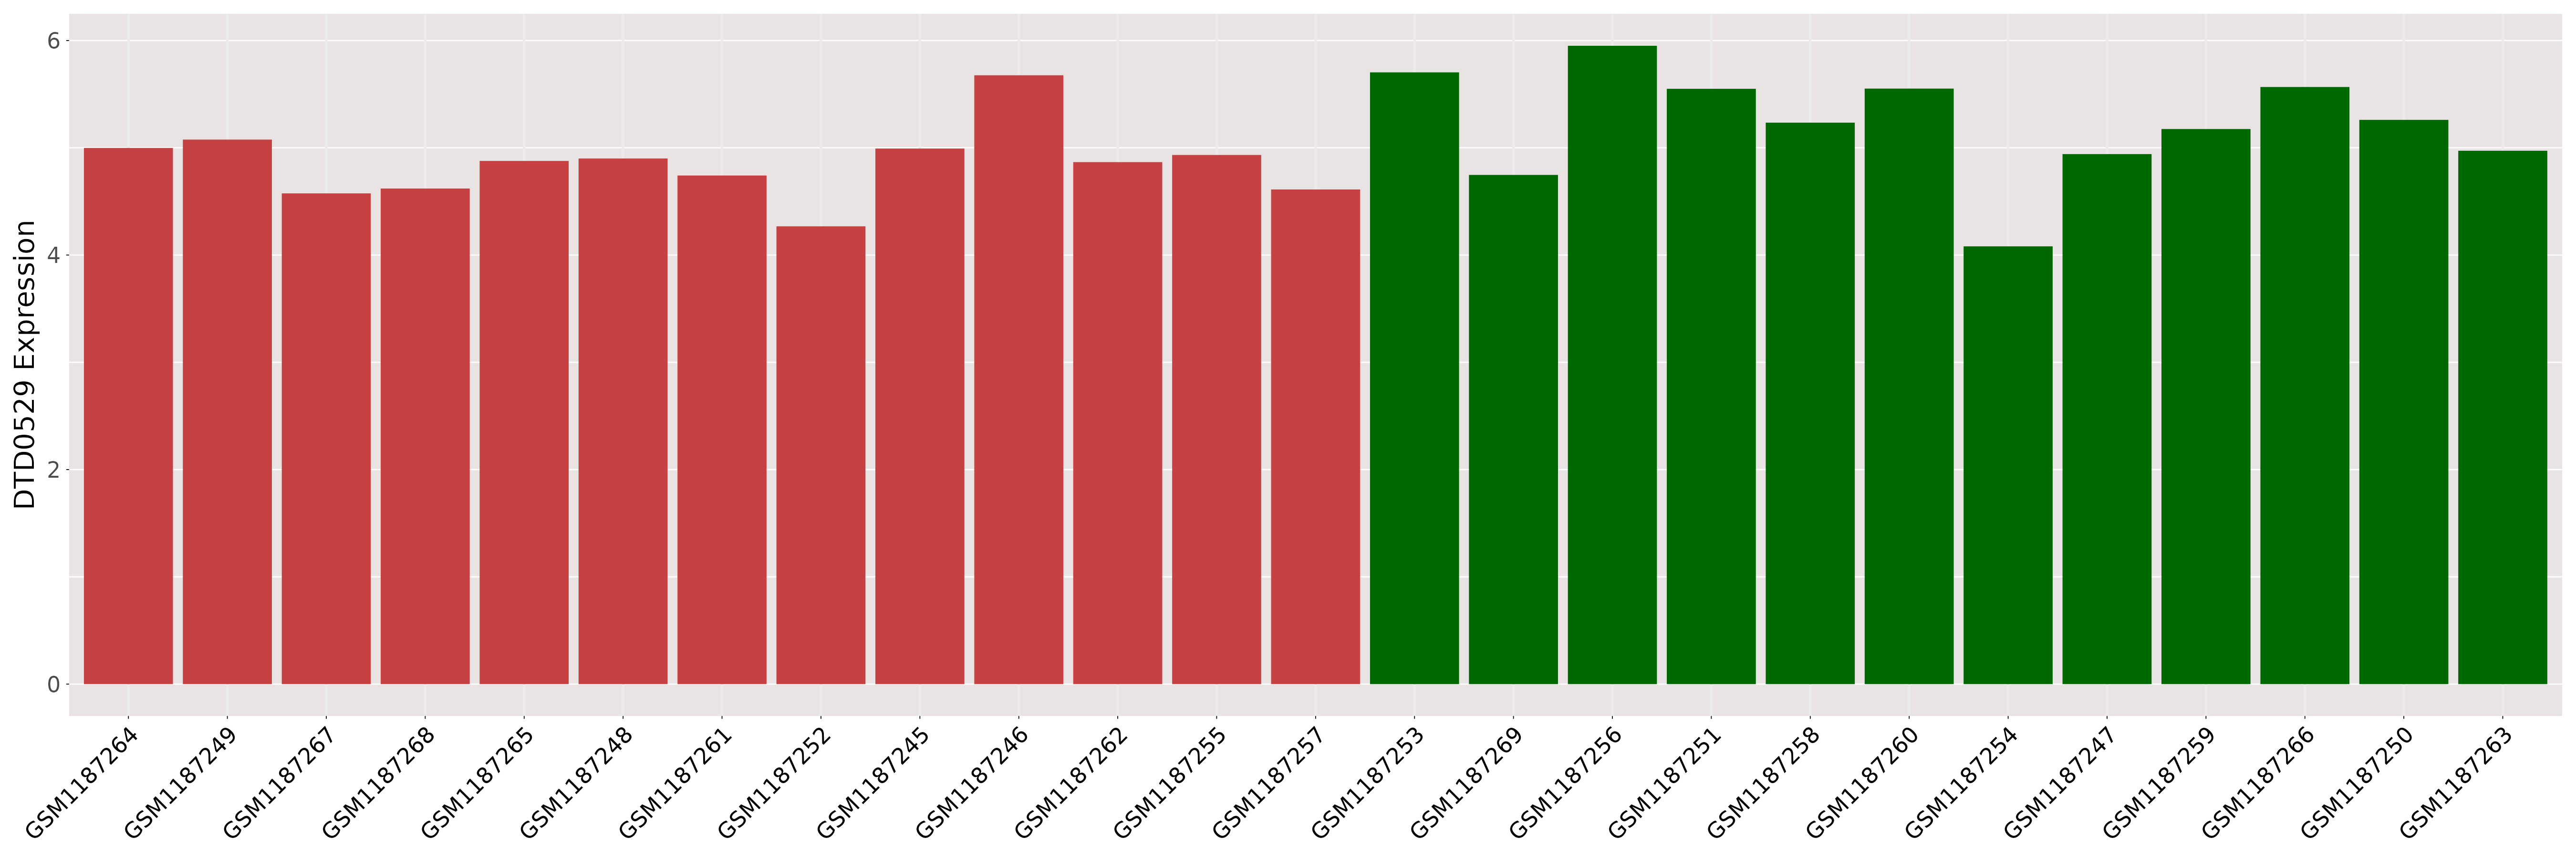
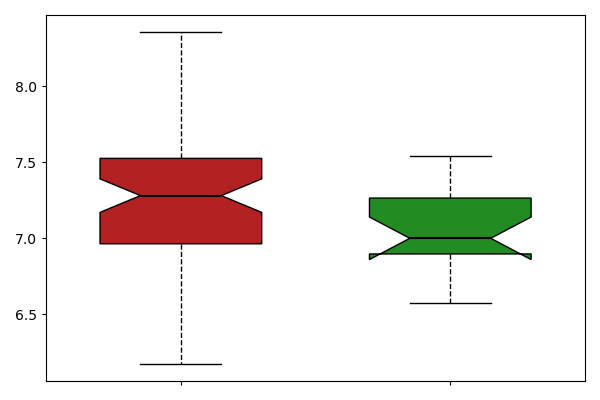
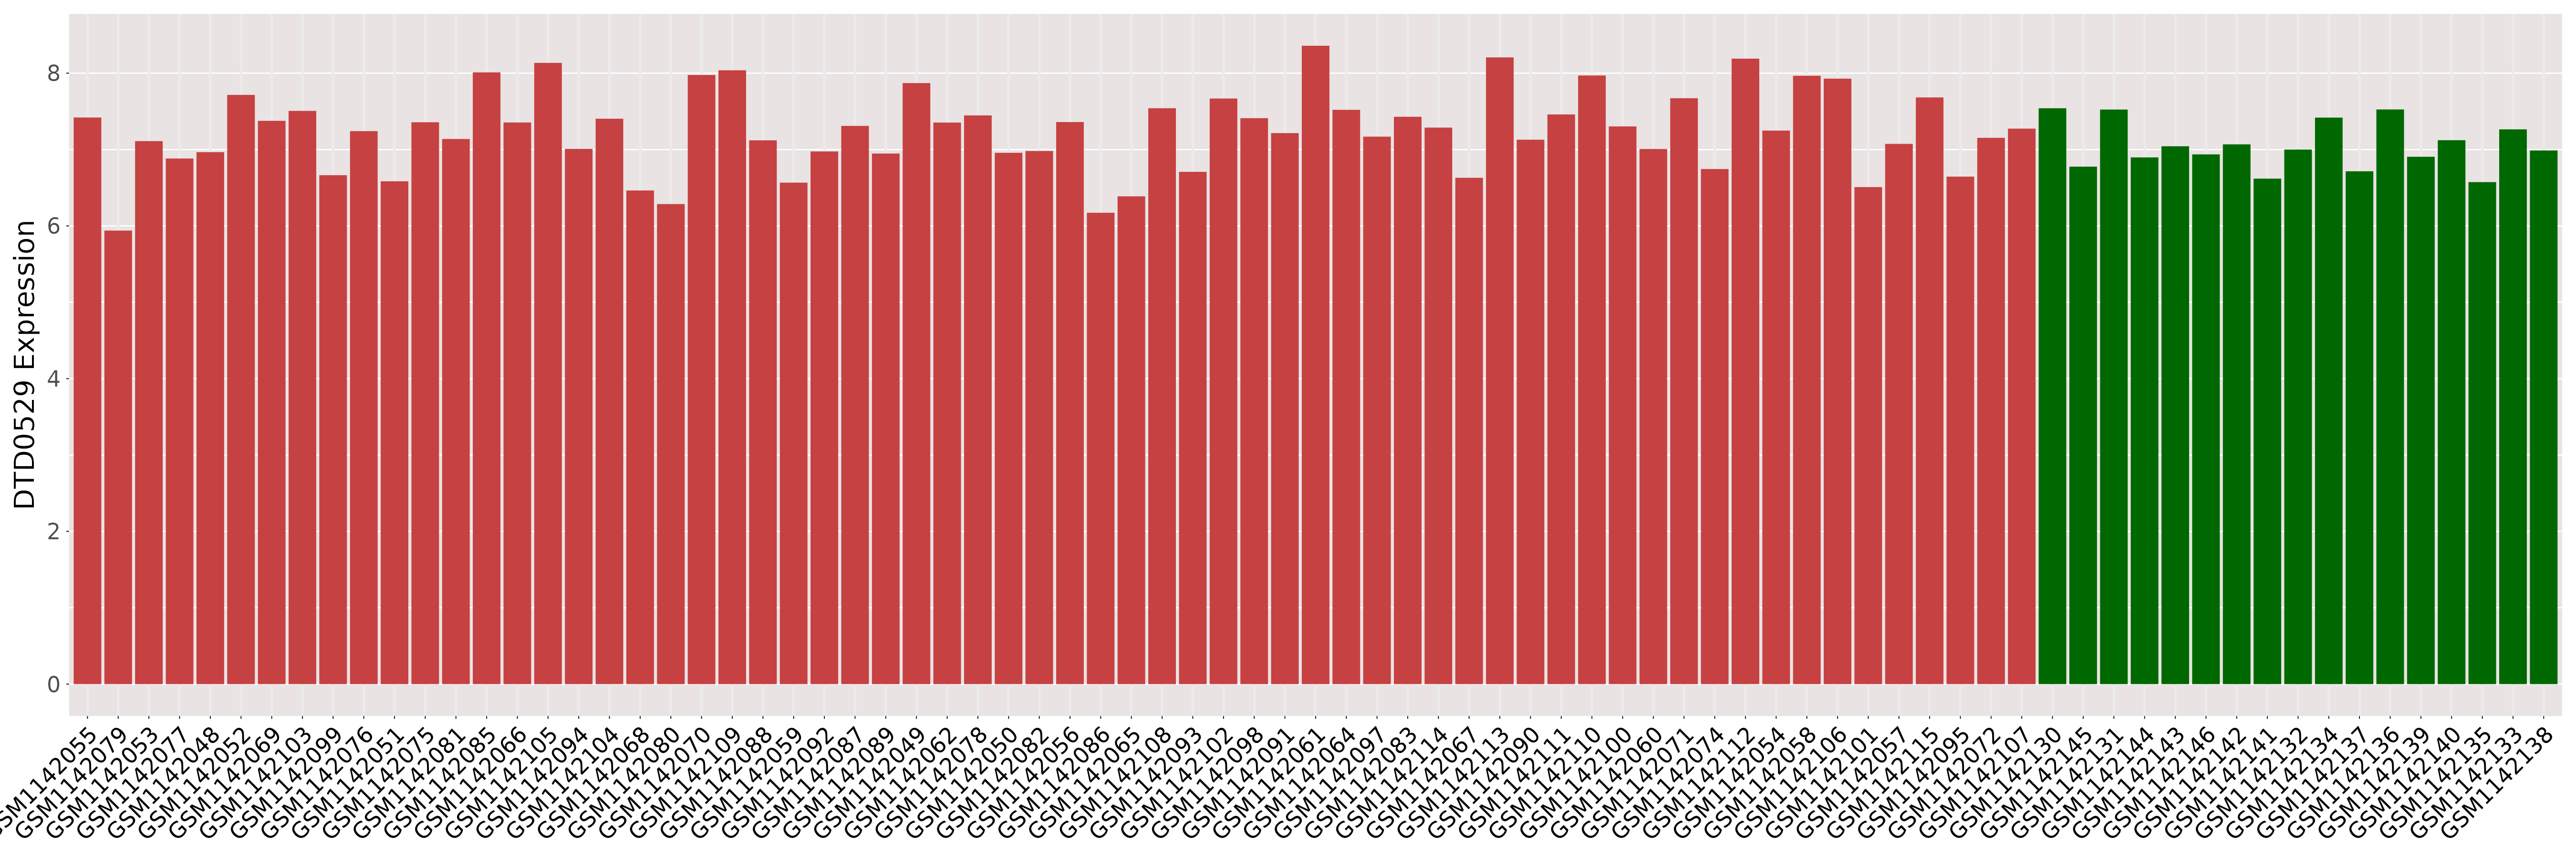
| ICD-11: 01 Certain infectious or parasitic disease | |||||
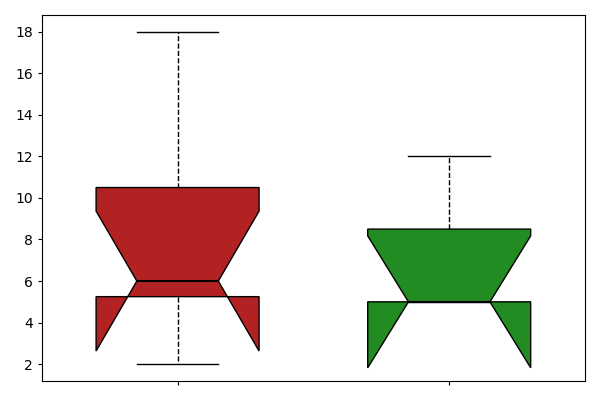
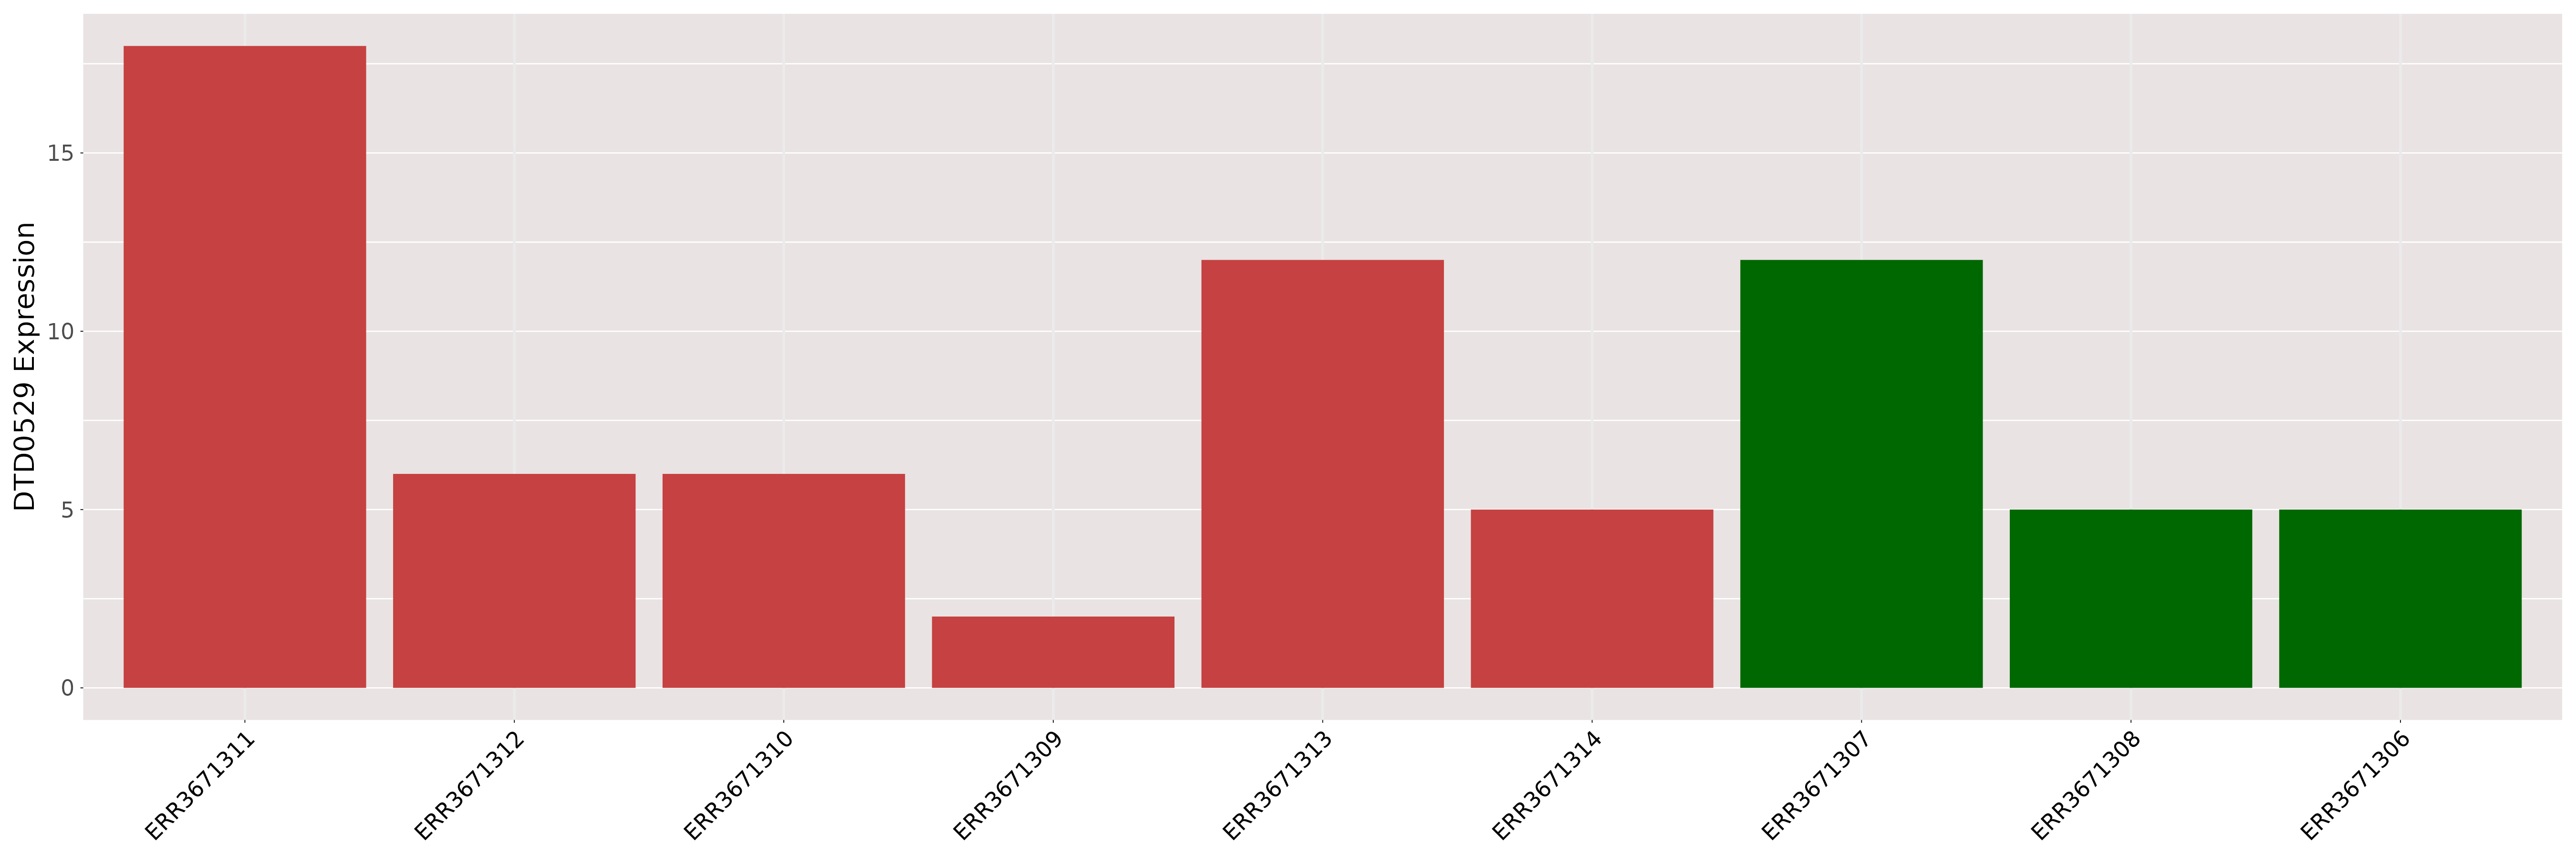
| [+] ICD-11: 1E50.1 Acute hepatitis B (viral hepatitis B) | Click to Show/Hide the Full List | ||||
| The Studied Tissue | Liver | ||||
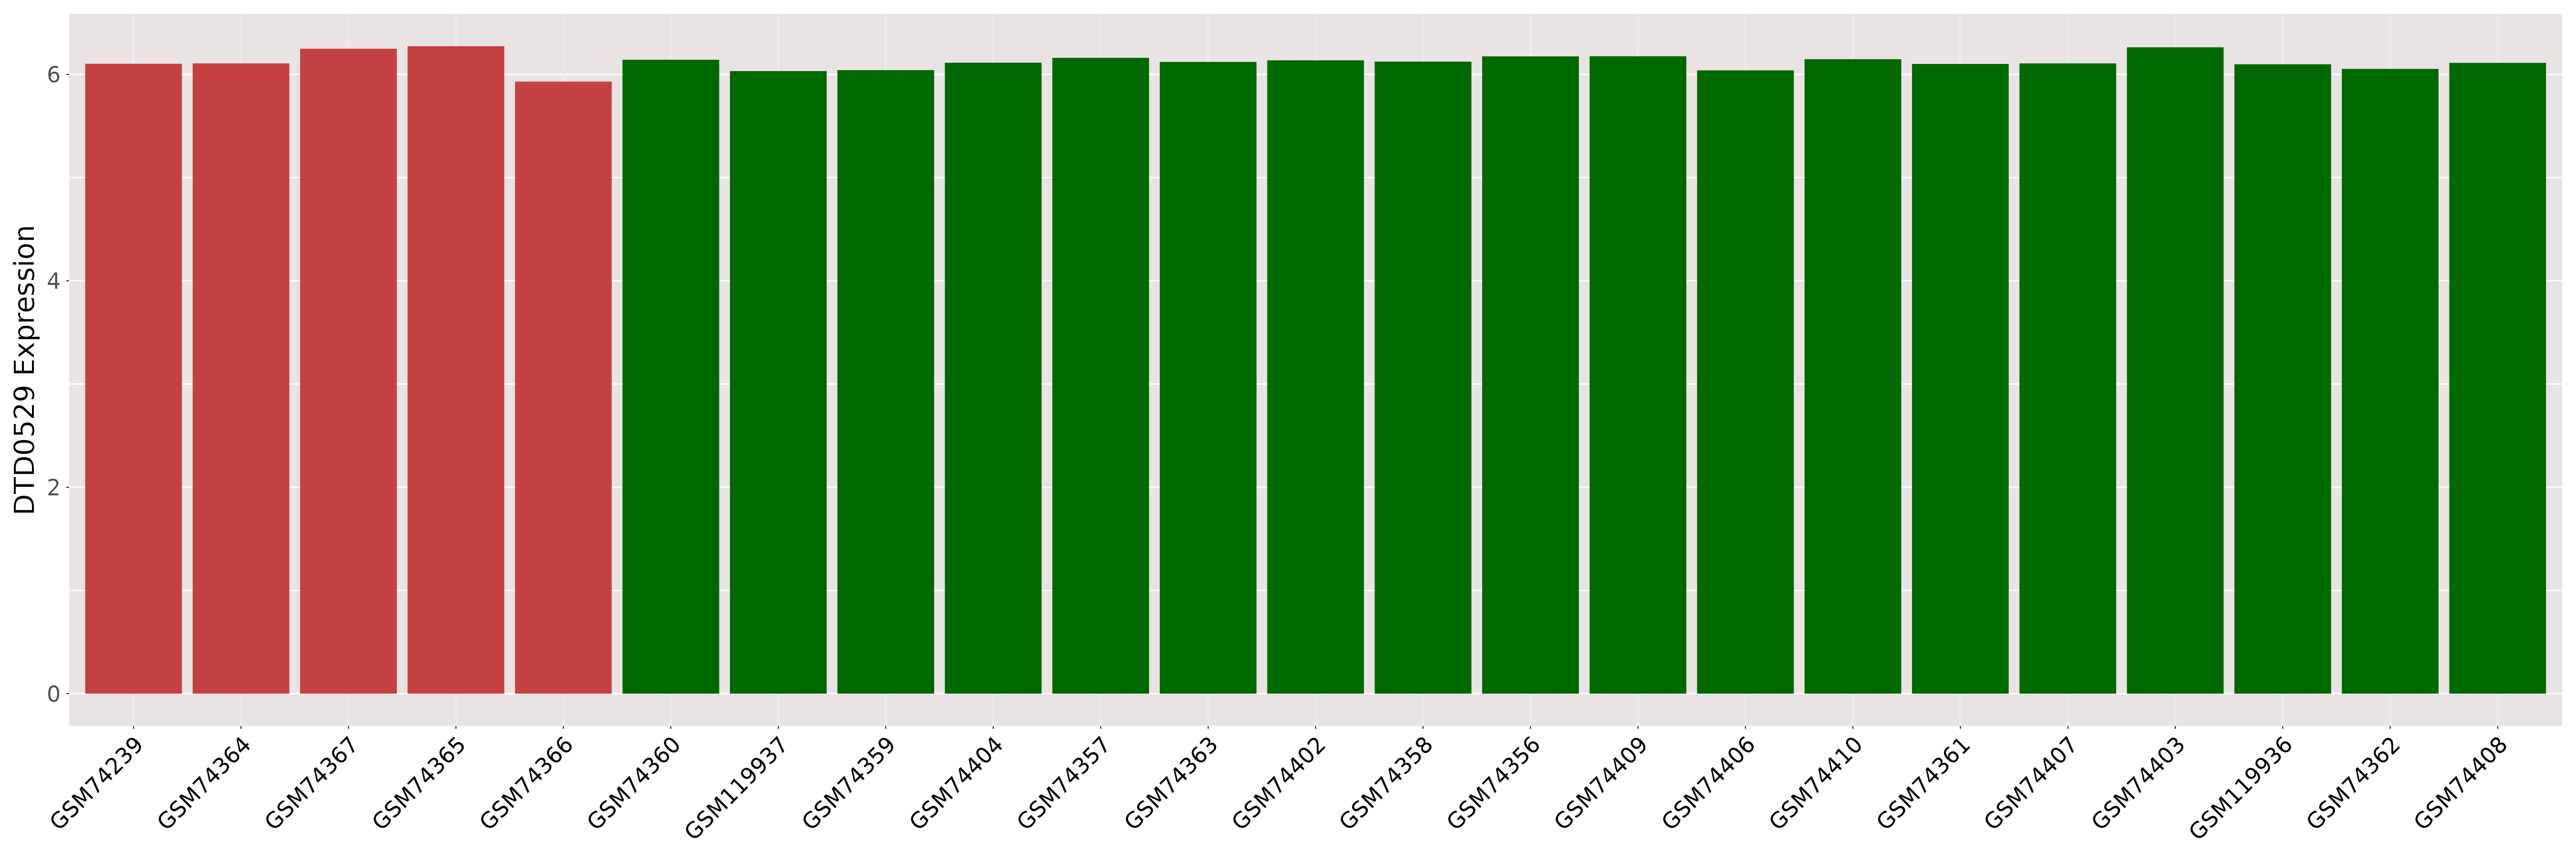
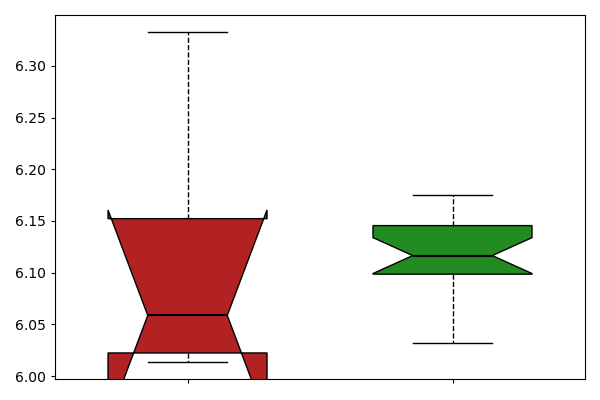
| The Specified Disease | Hepatitis b virus infection [ICD-11:1E50.1] | ||||
| The Expression Level of Disease Section Compare with the Healthy Individual Tissue | p-value:5.590853690281544e-05; Fold-change:0.8004762642183451; Z-score:-1.339270269 | ||||
|
Please Click the above Thumbnail to View/Download the Expression Barchart for All Samples | ||||
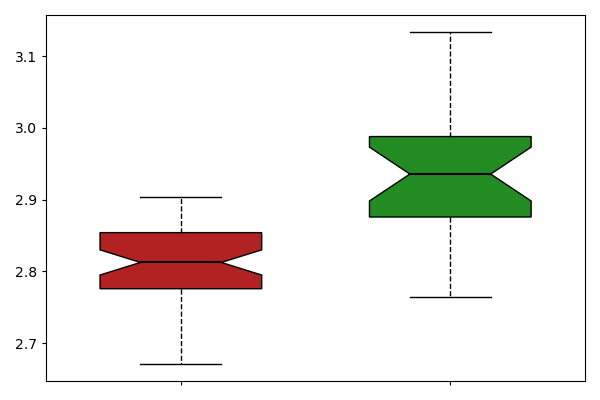
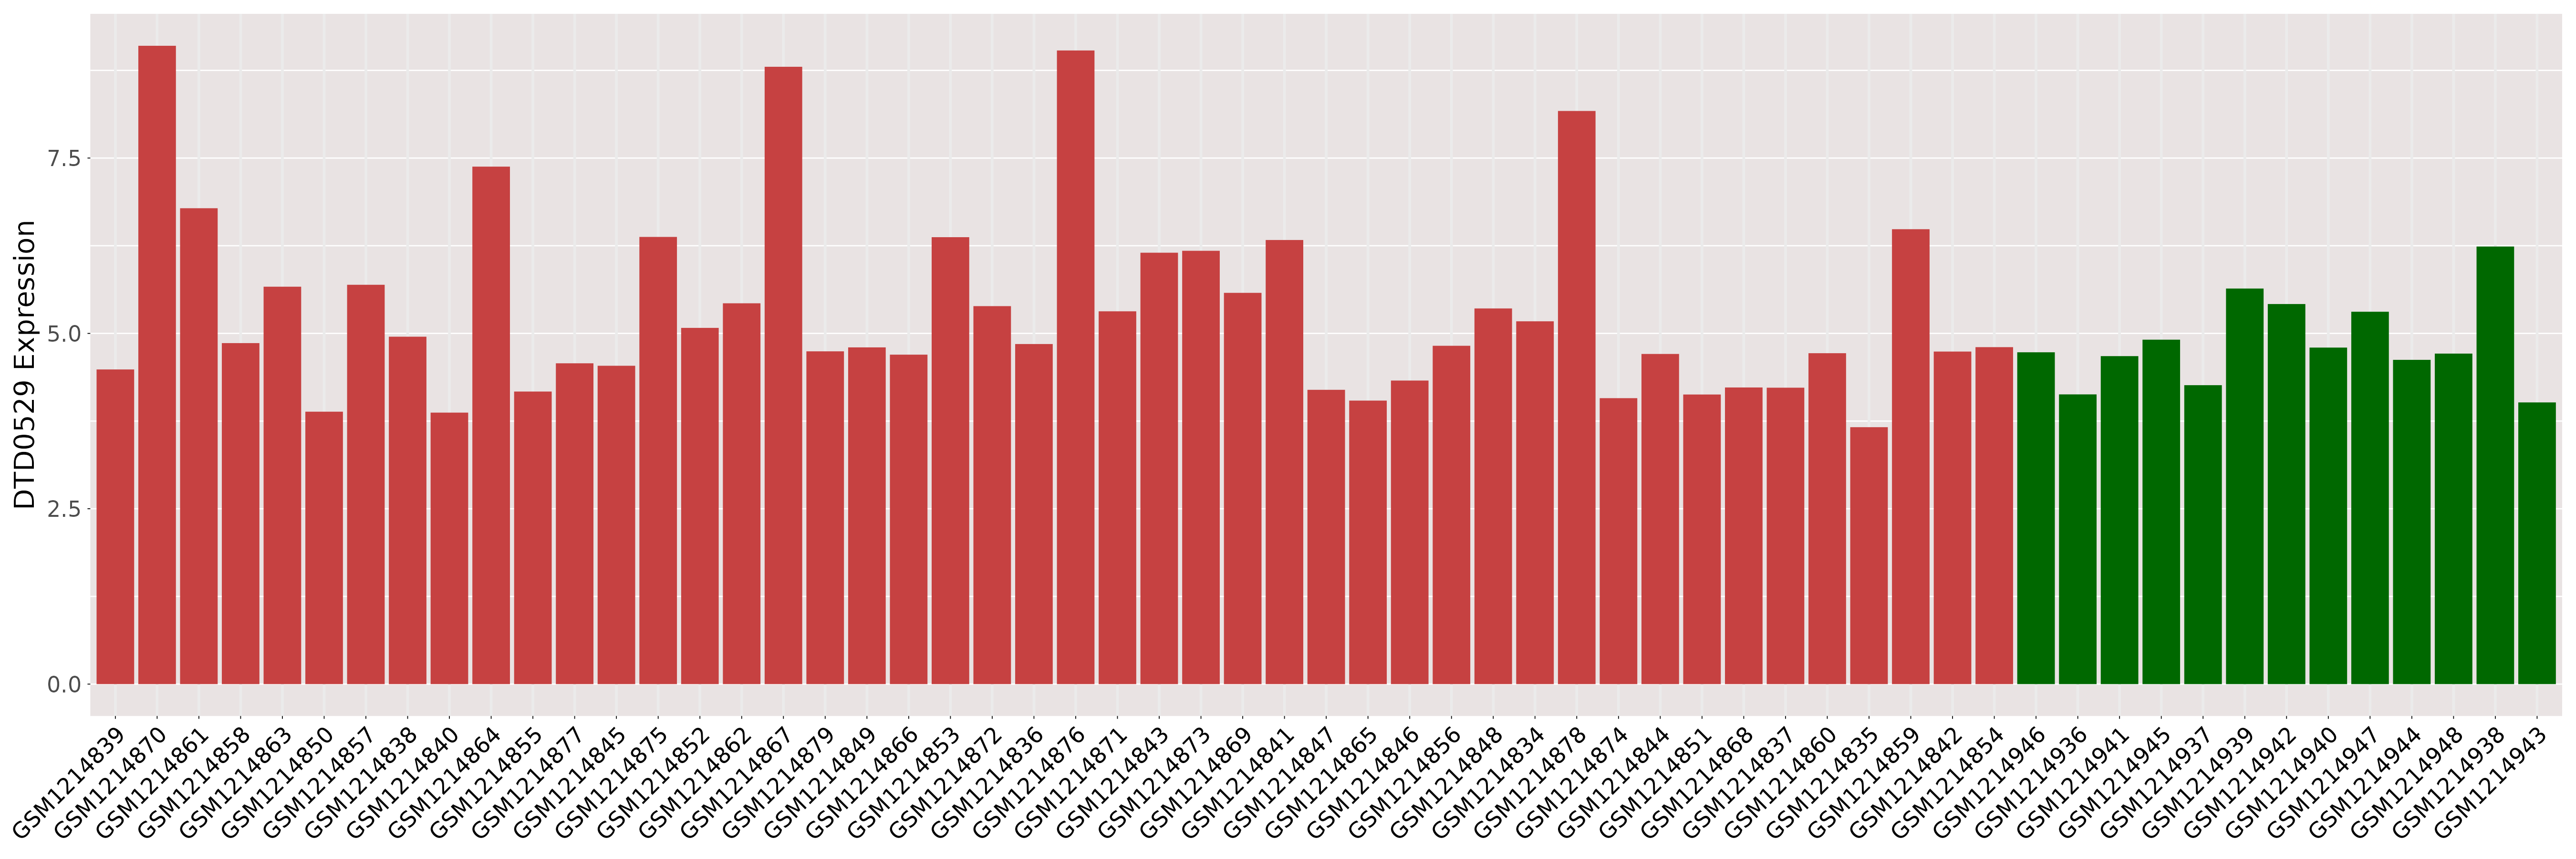
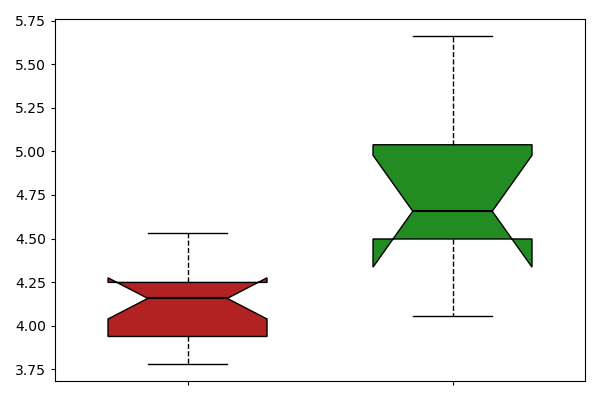
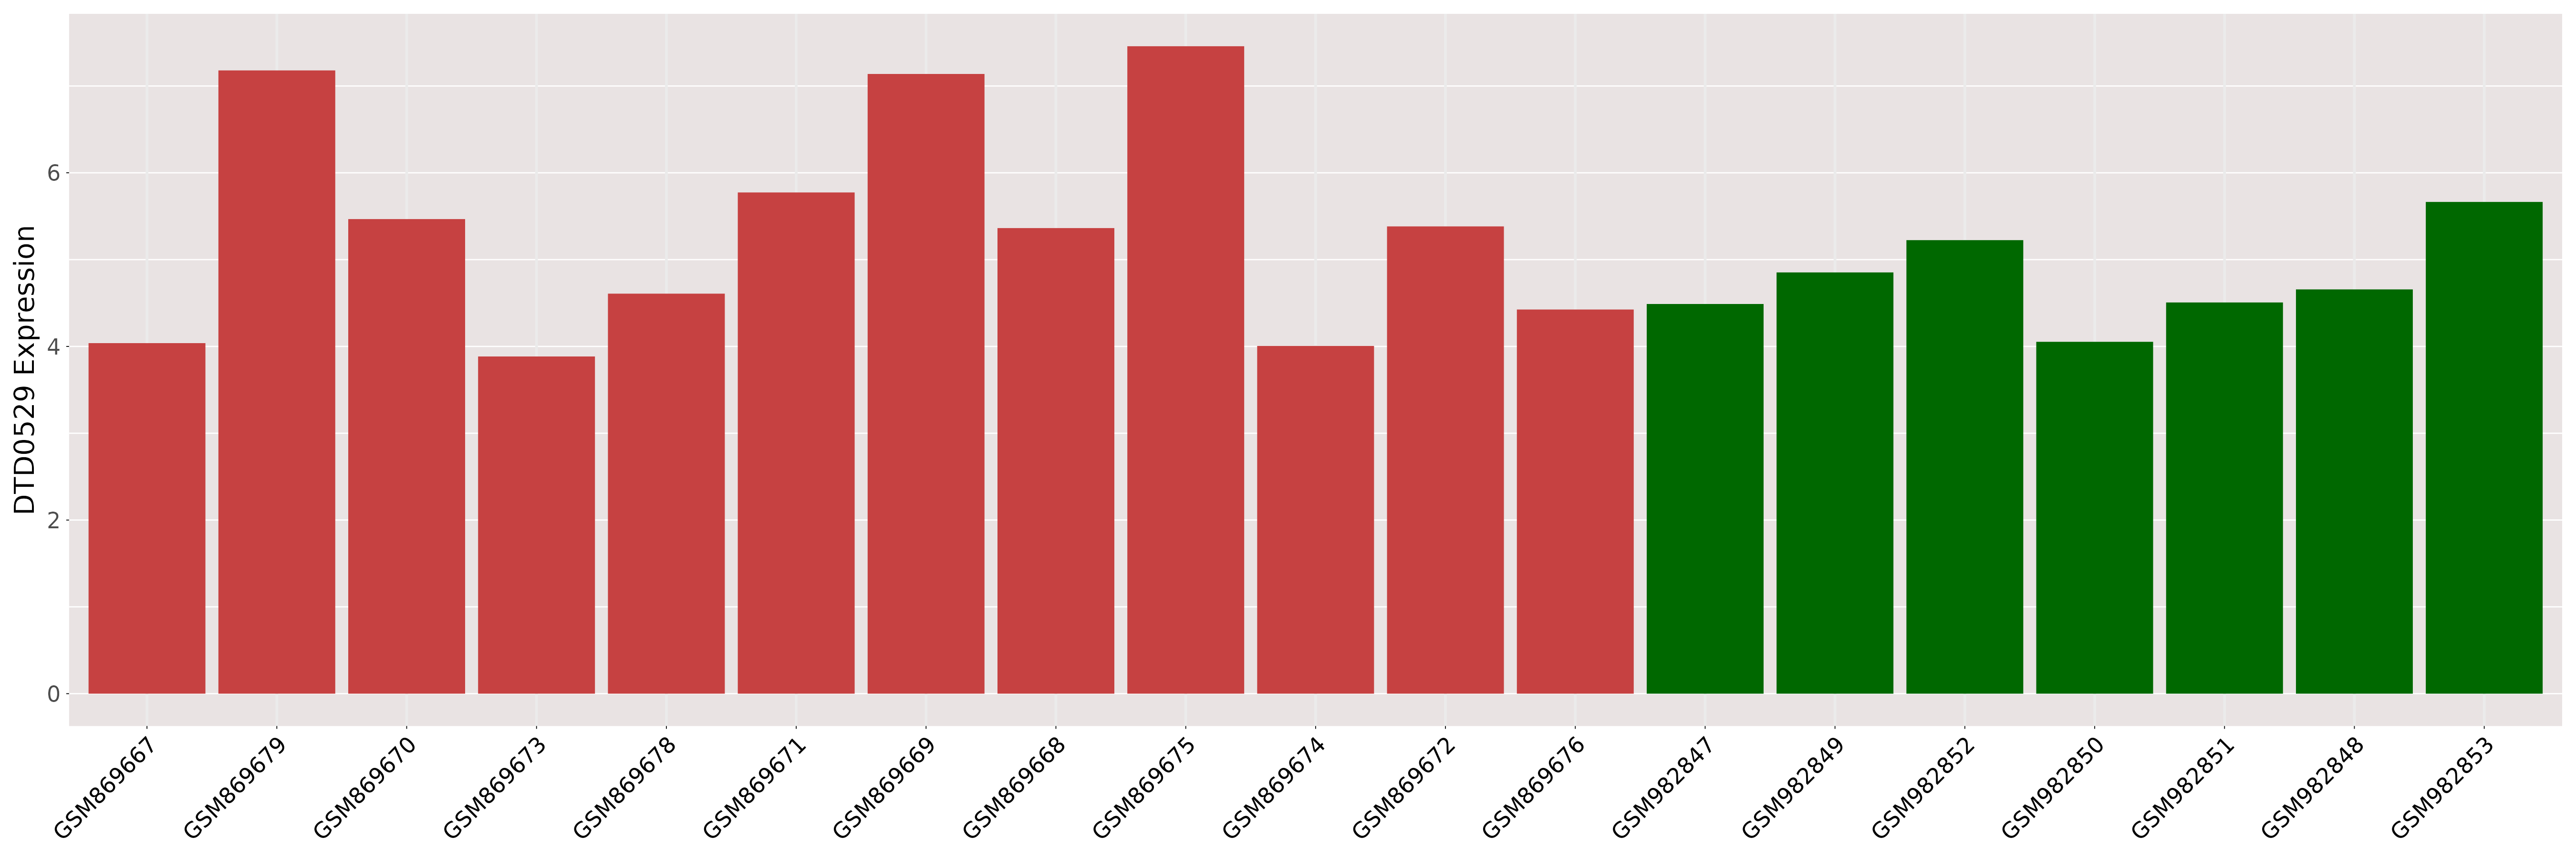
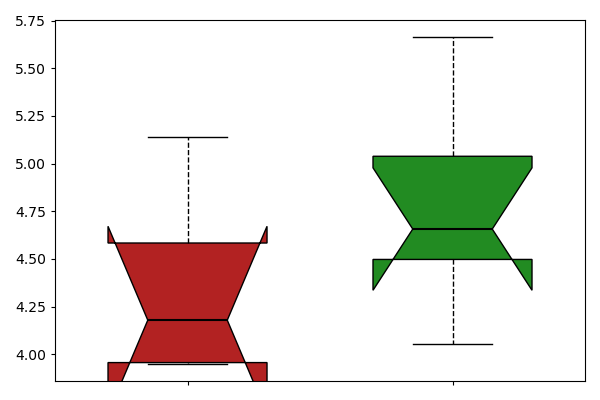
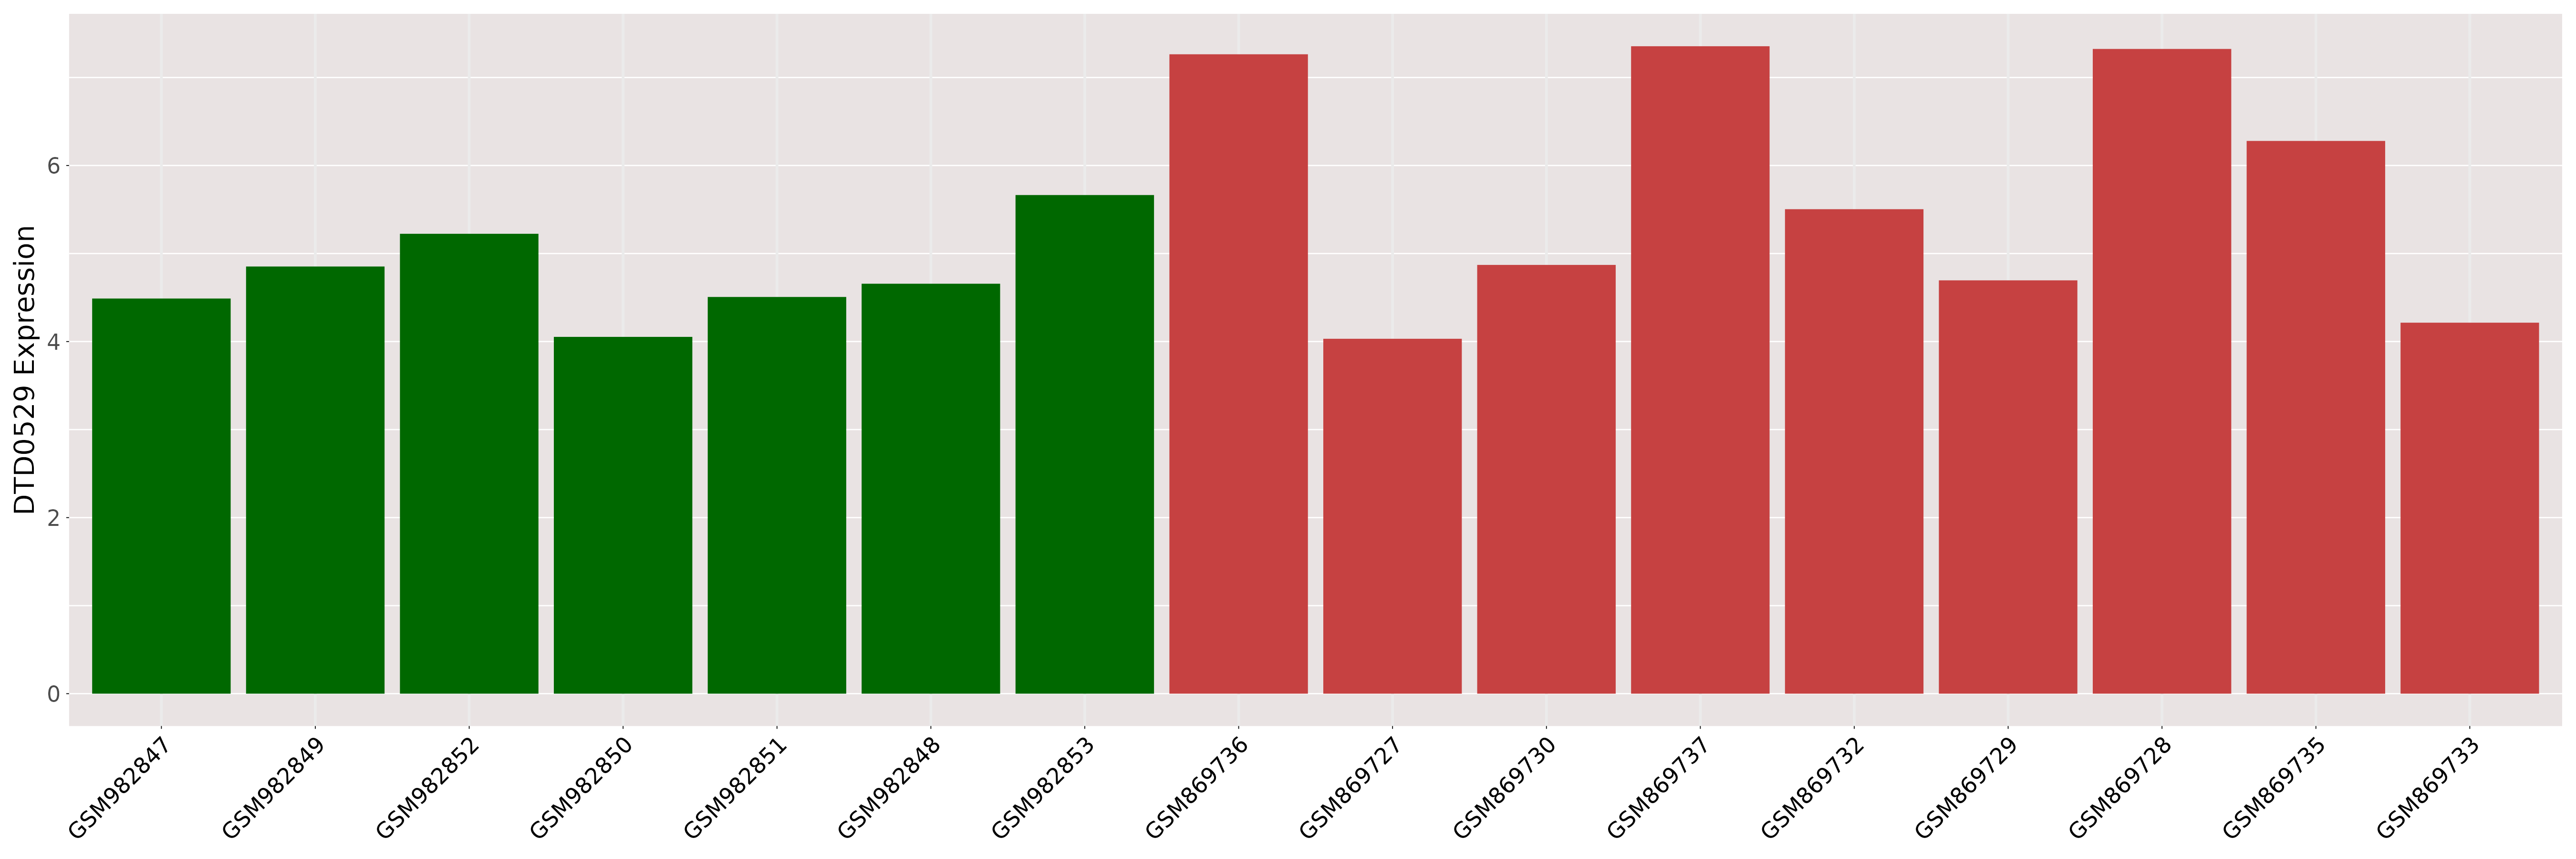
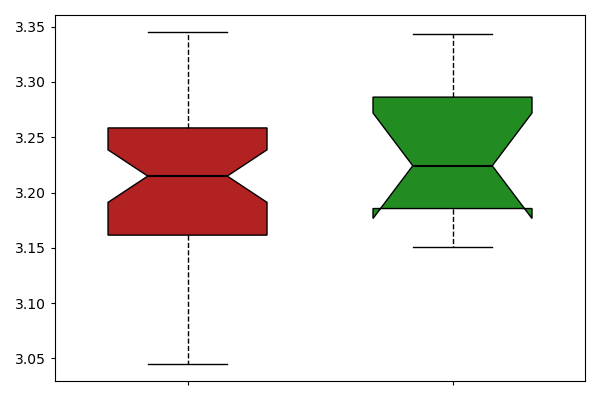
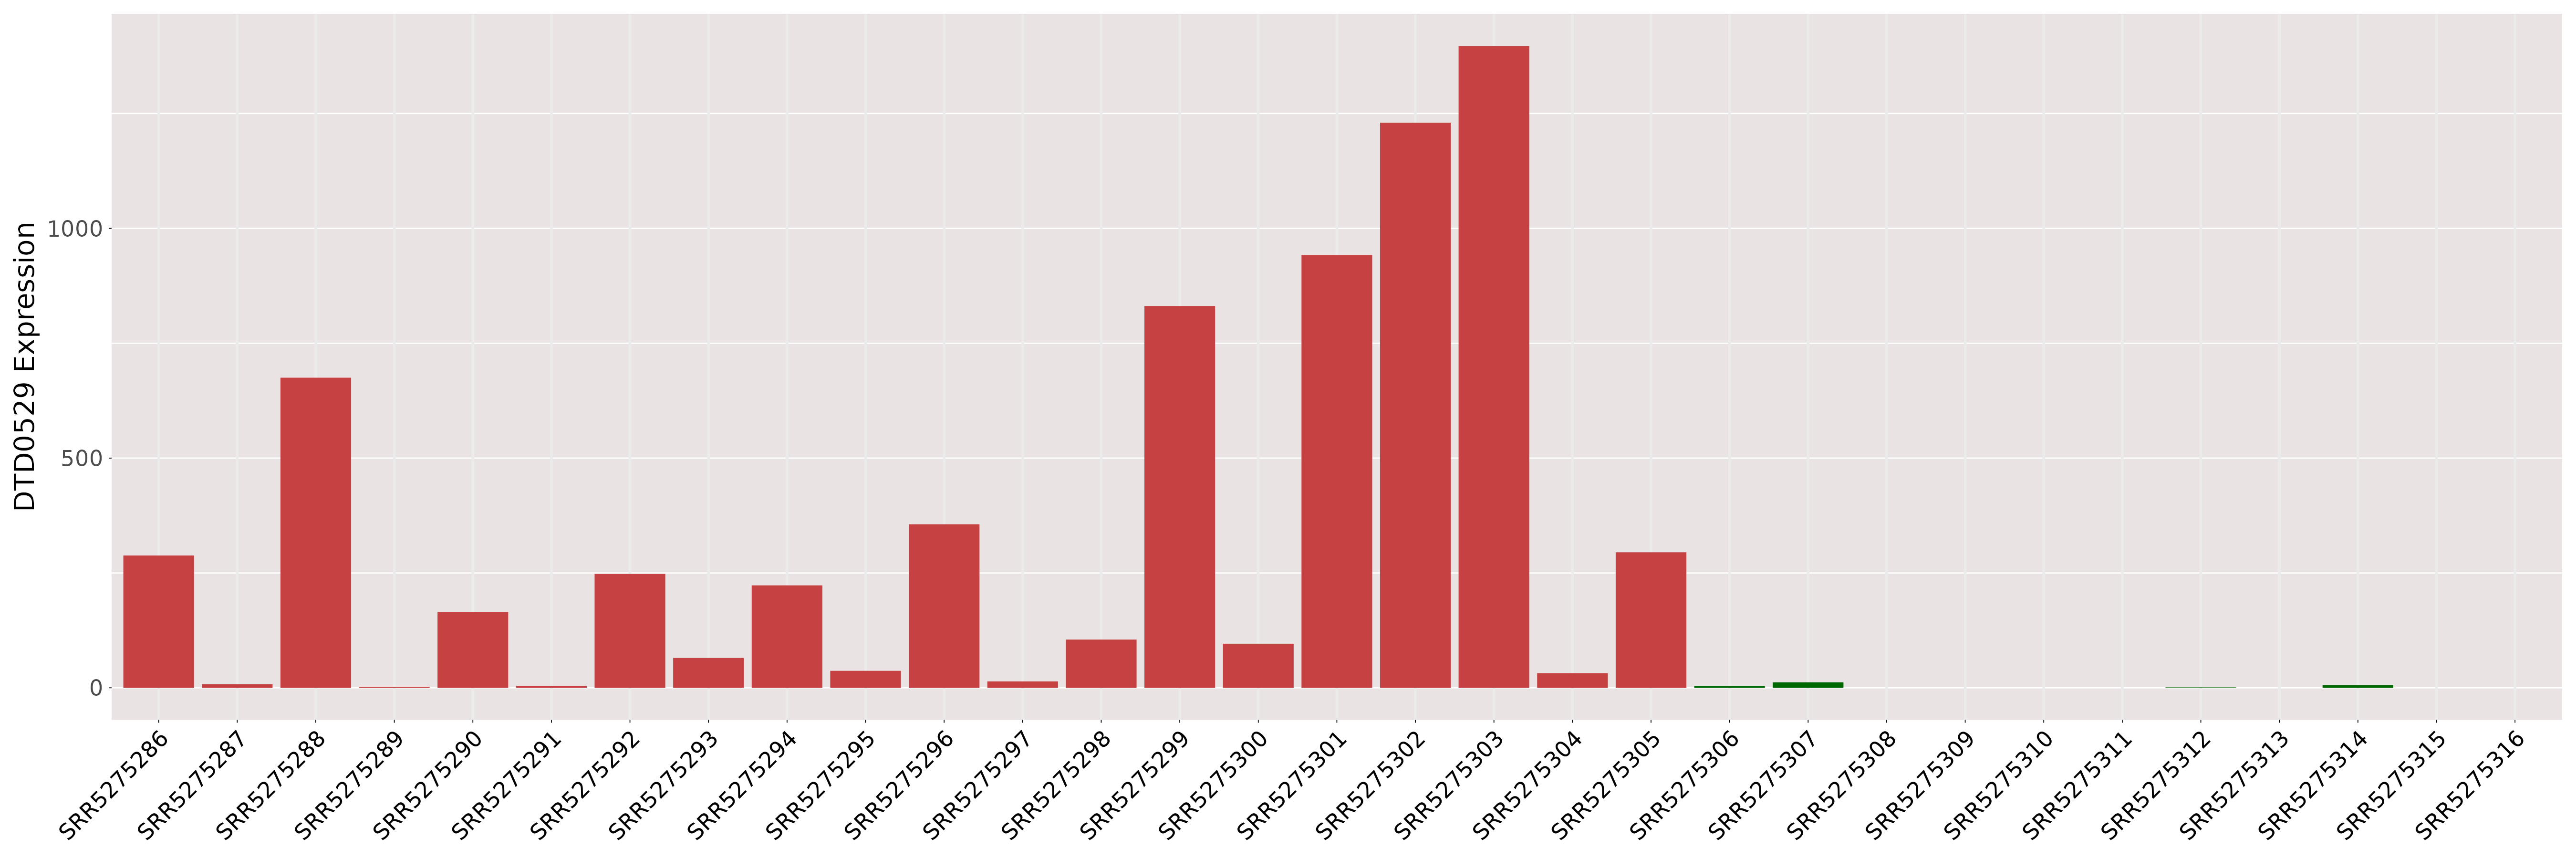
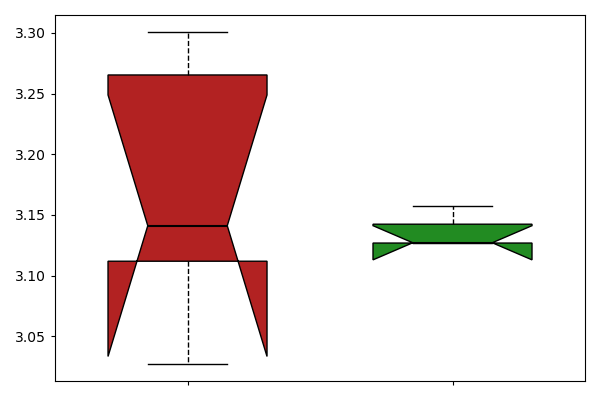
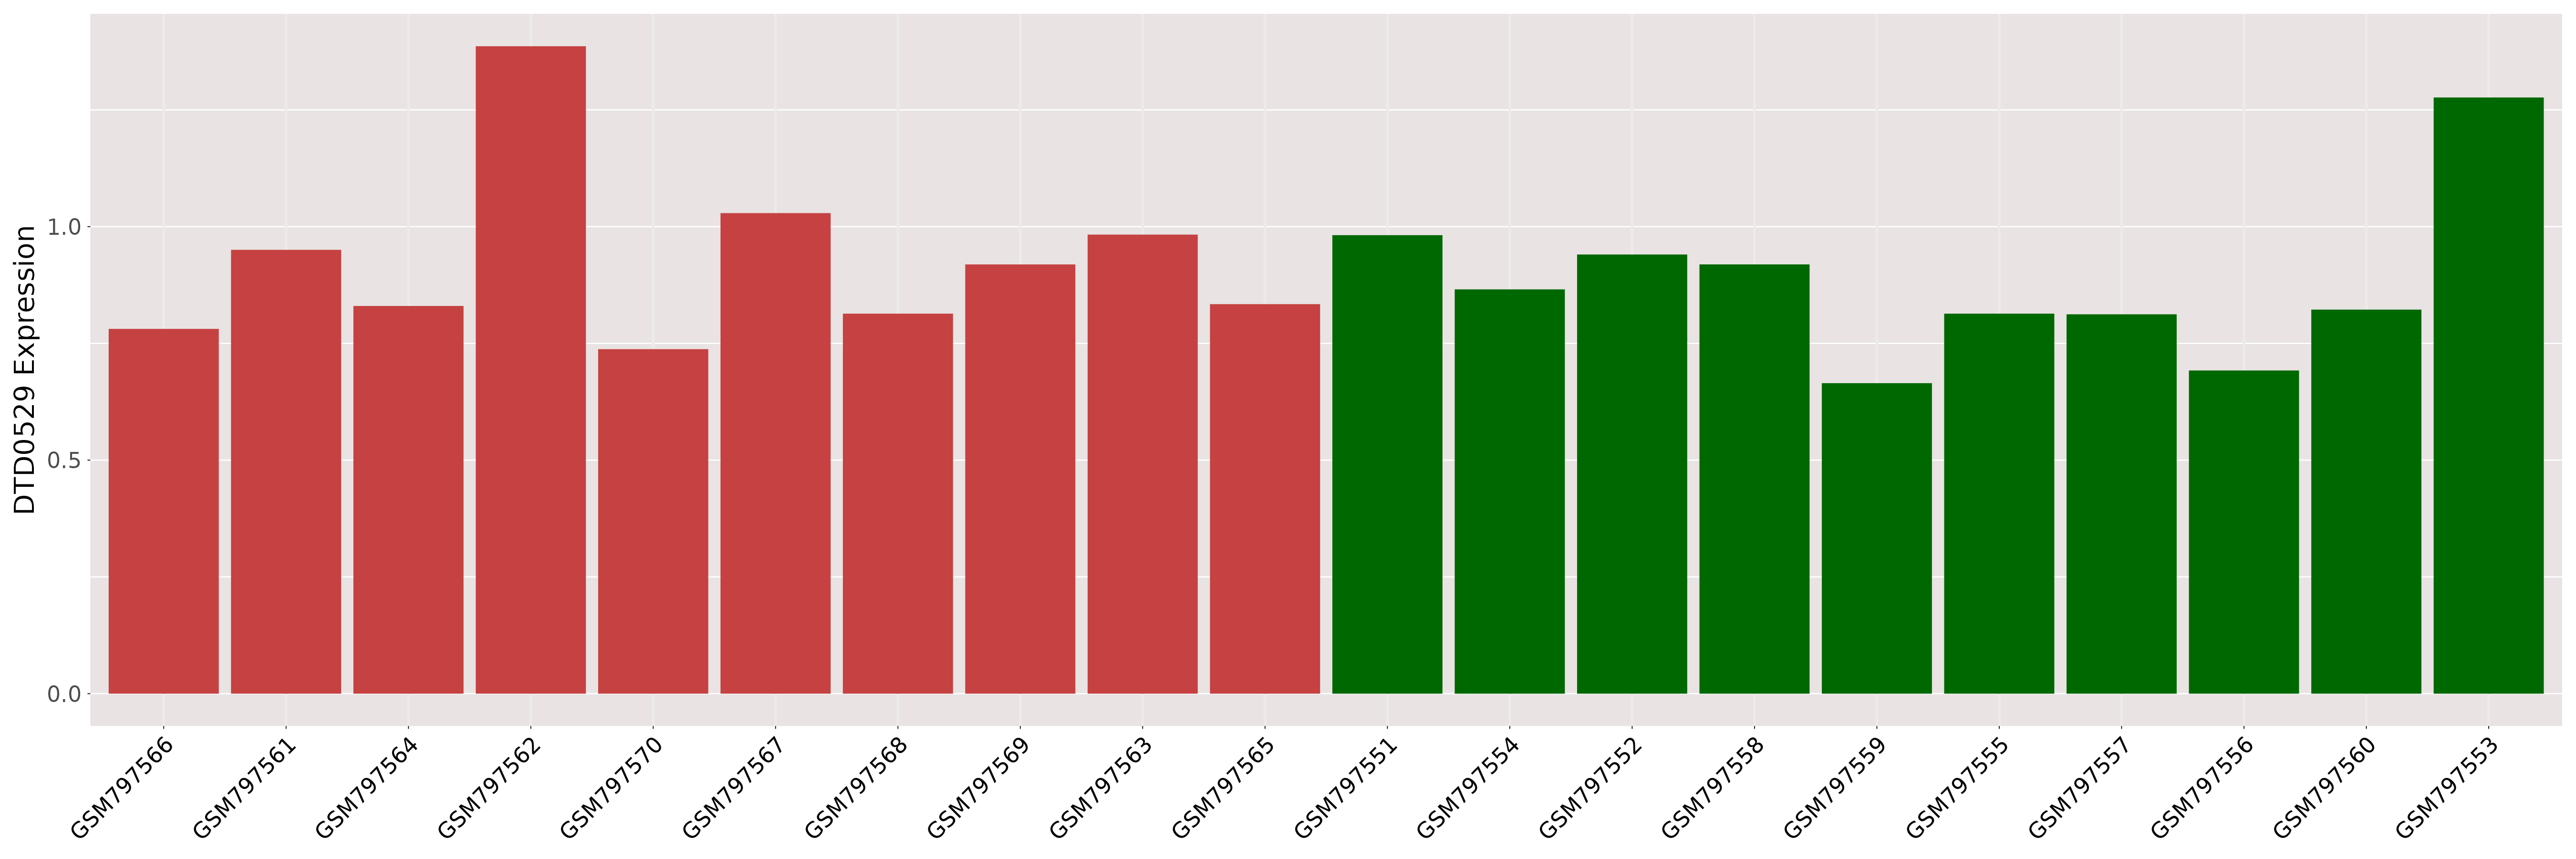
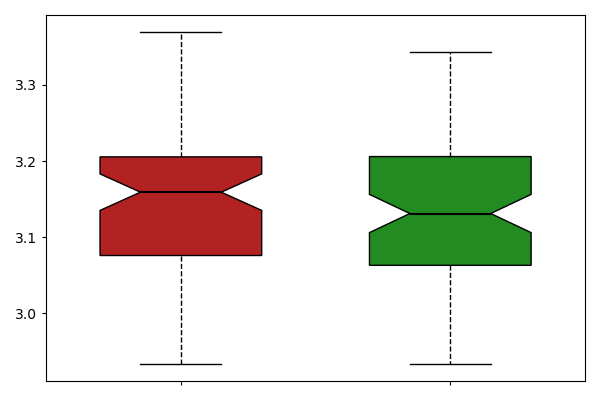
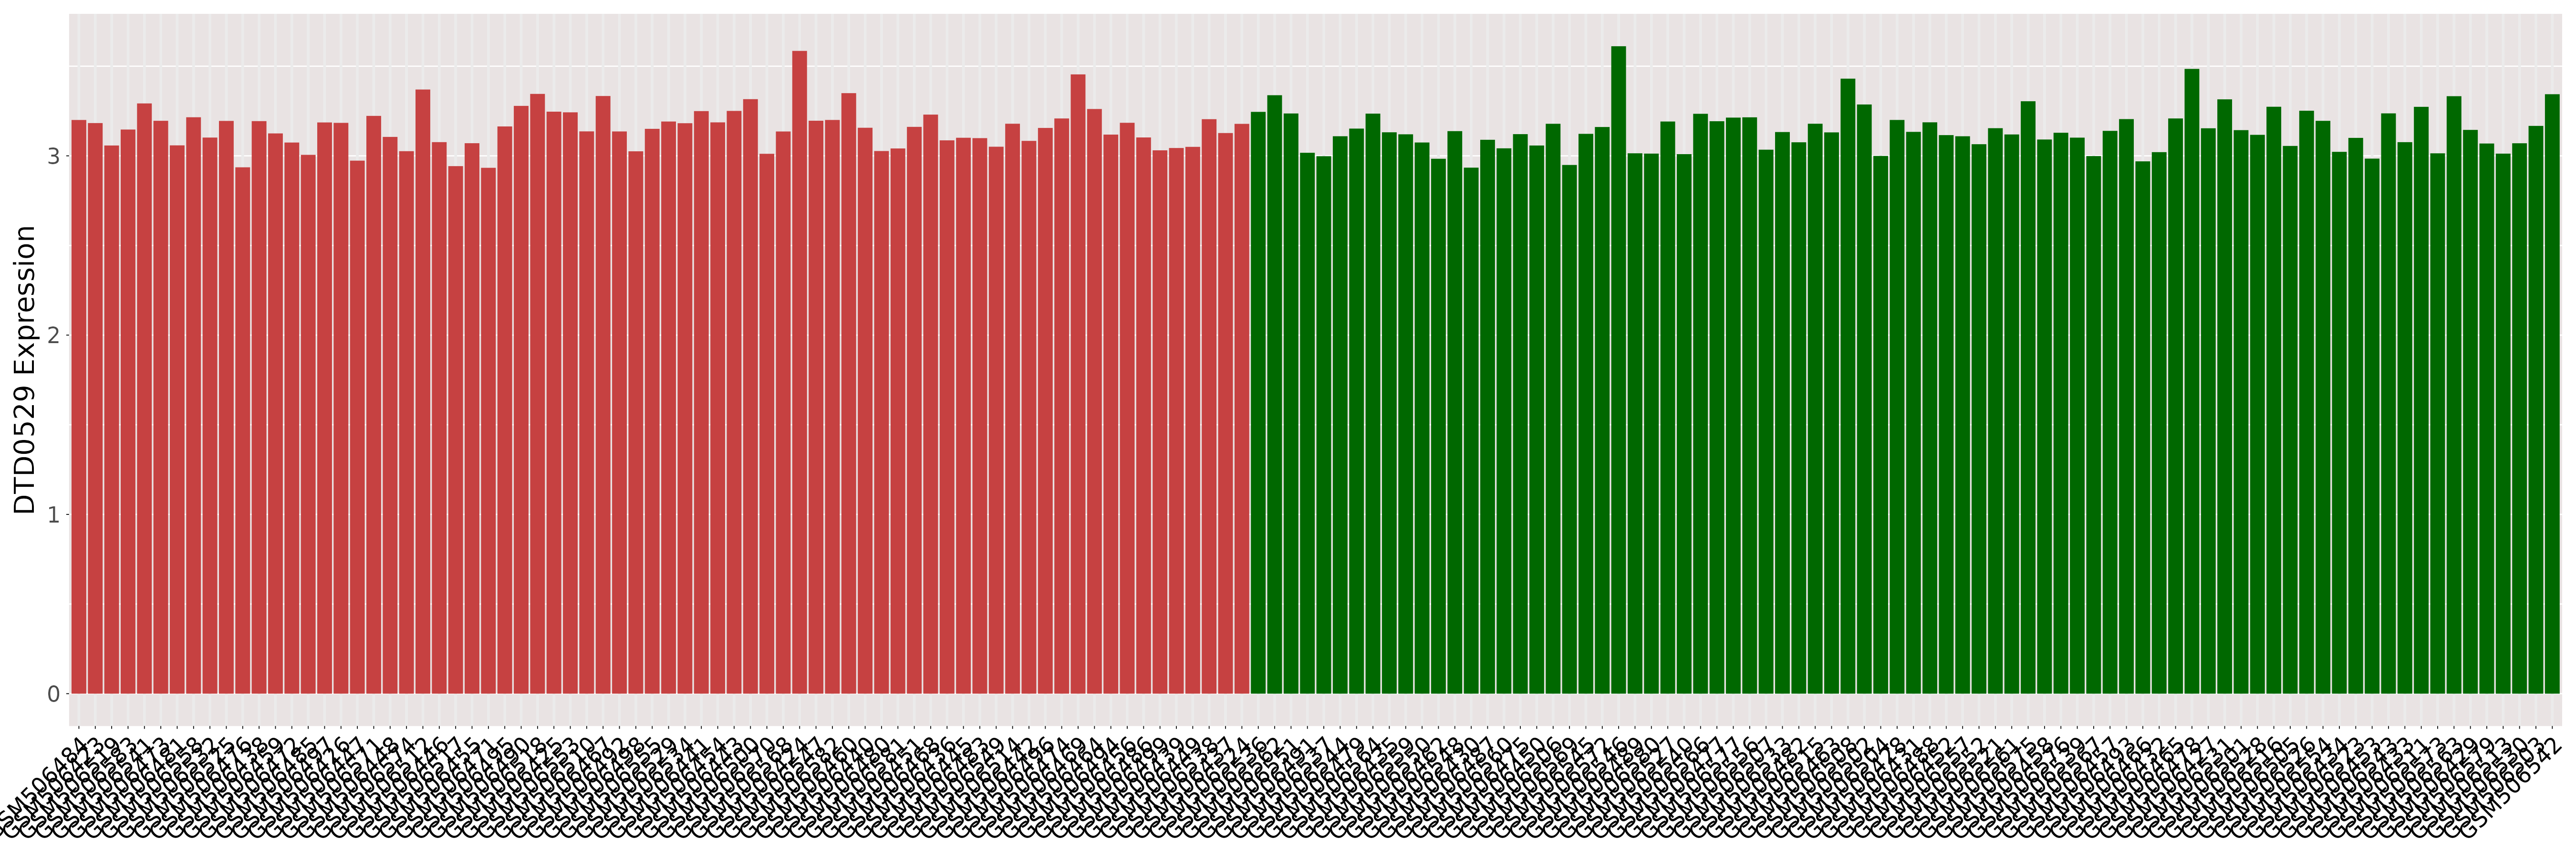
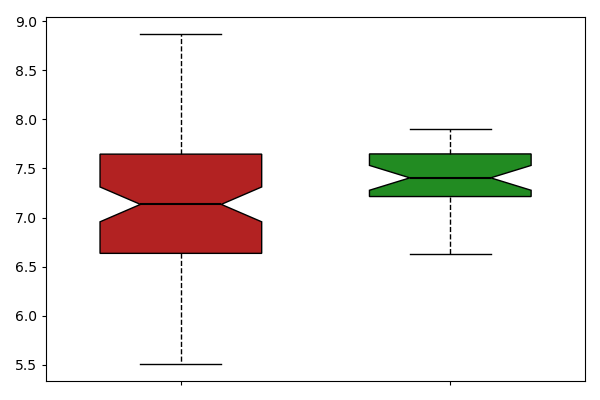
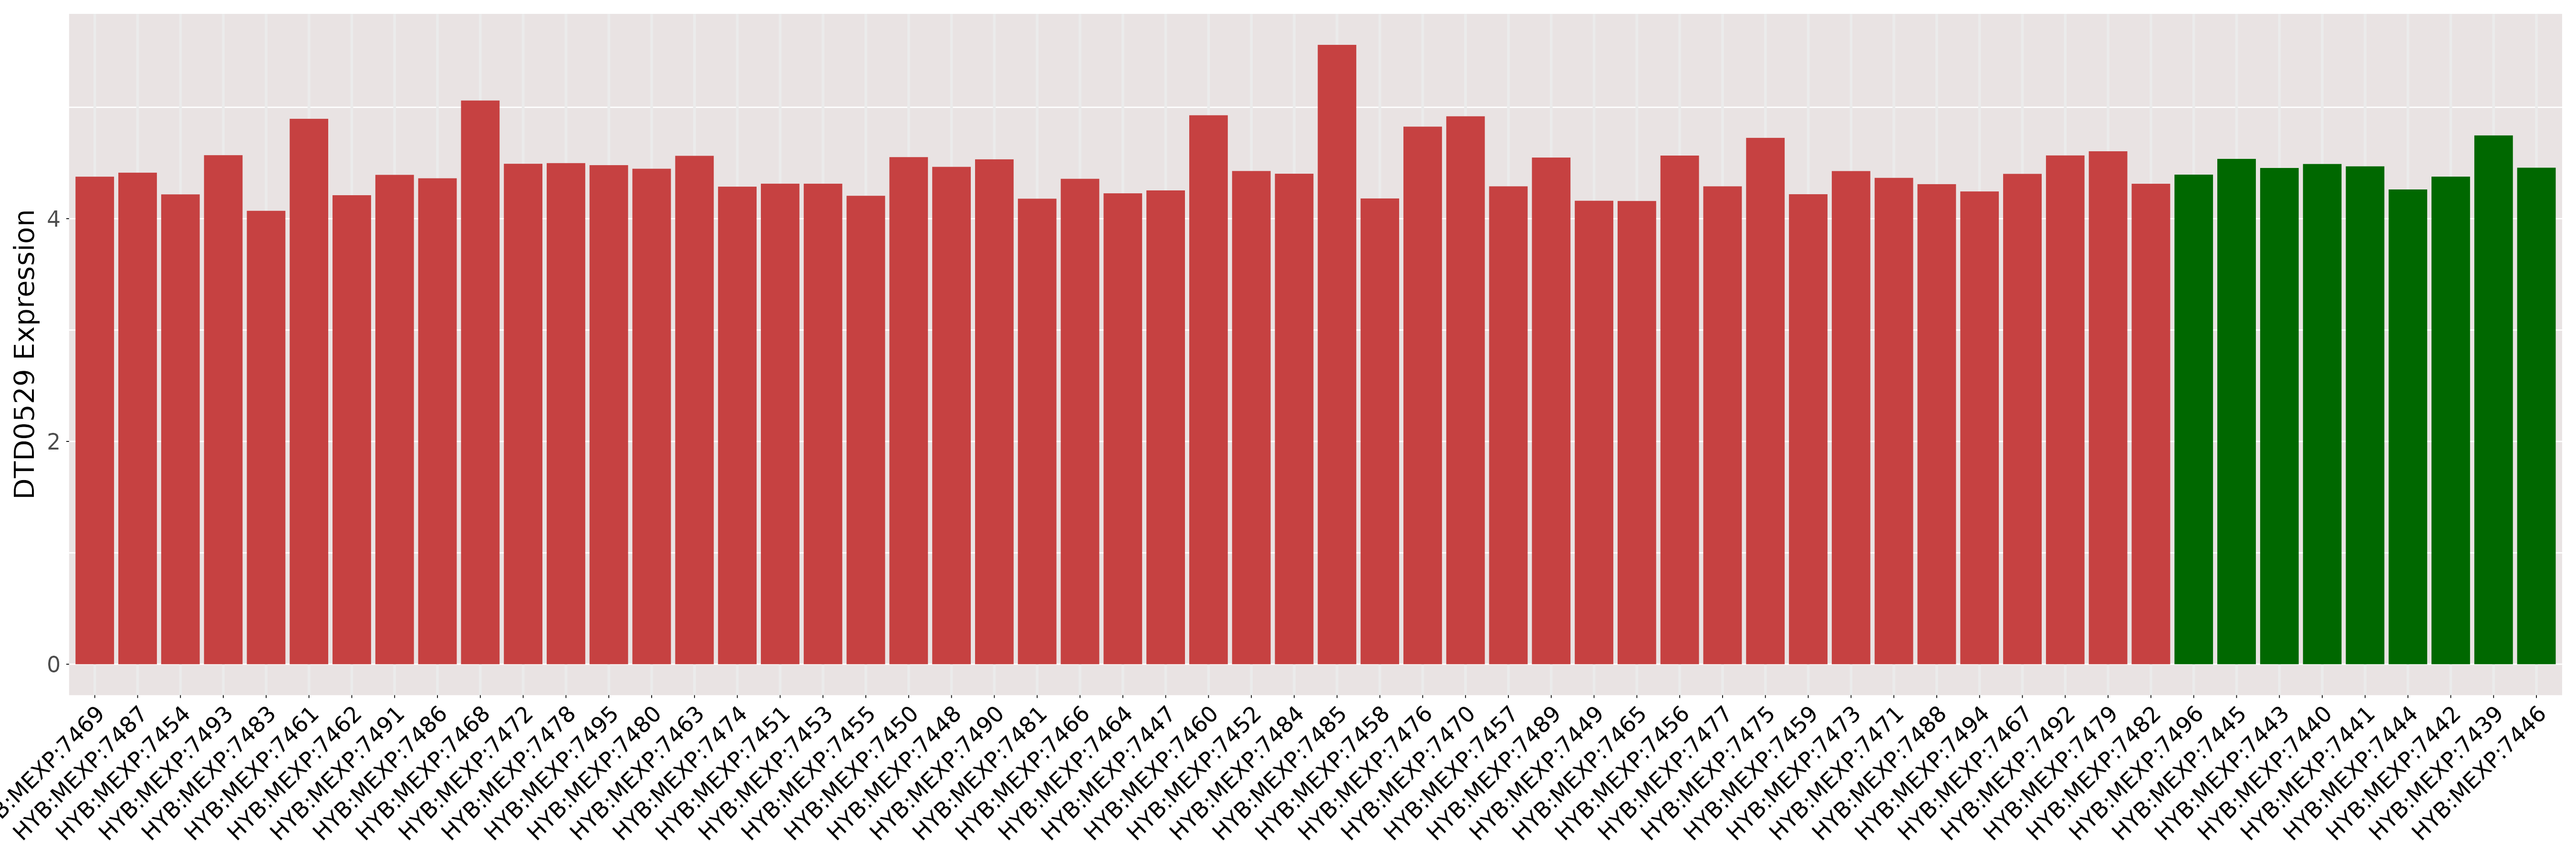
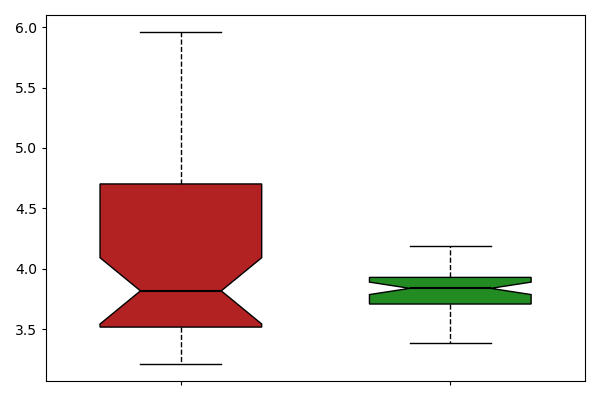
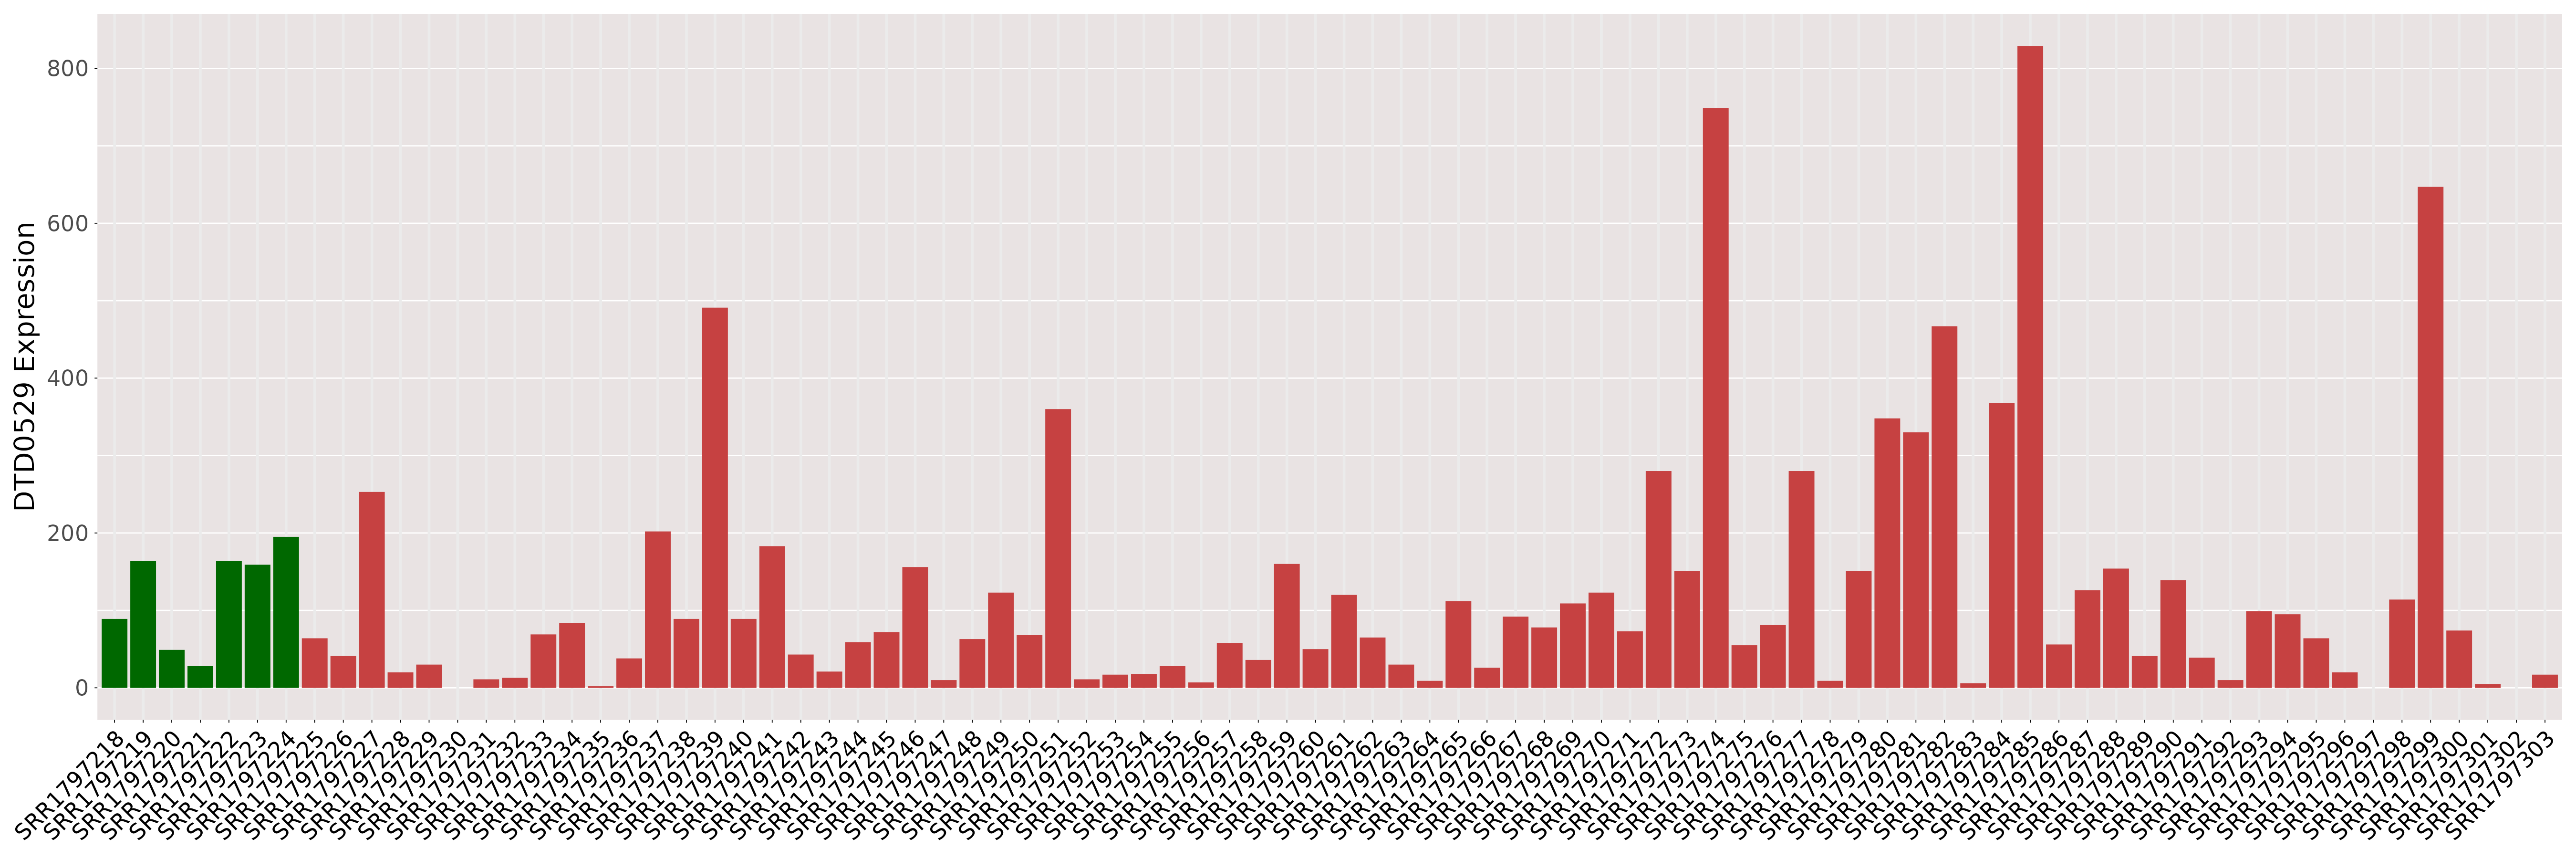
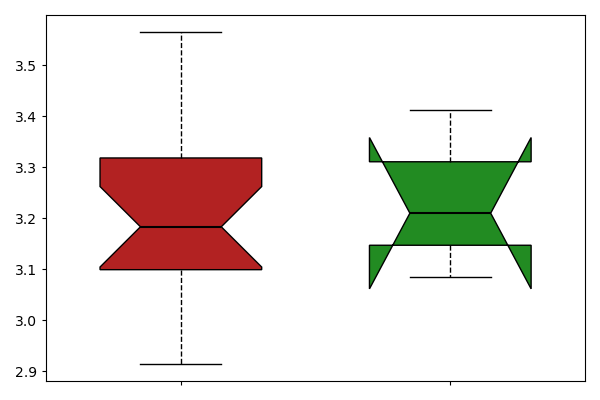
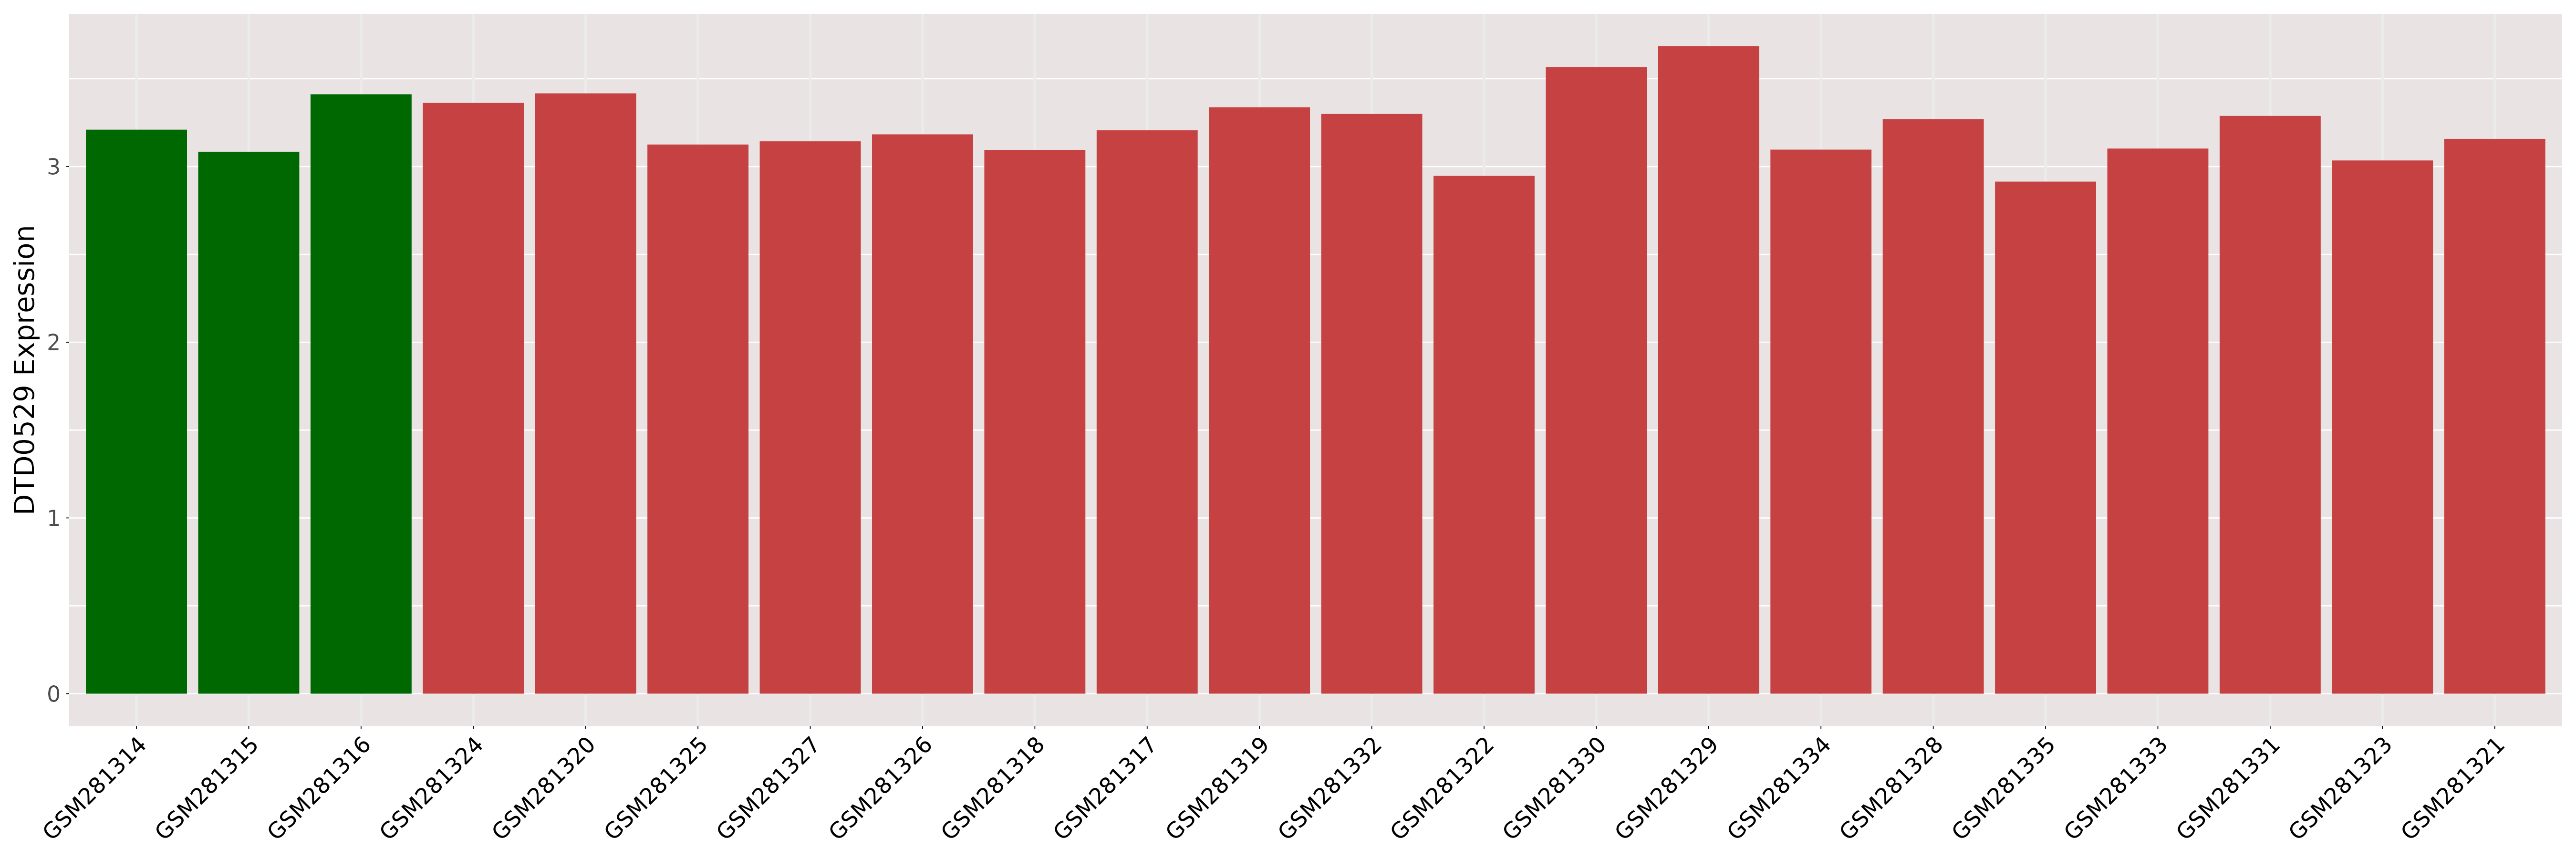
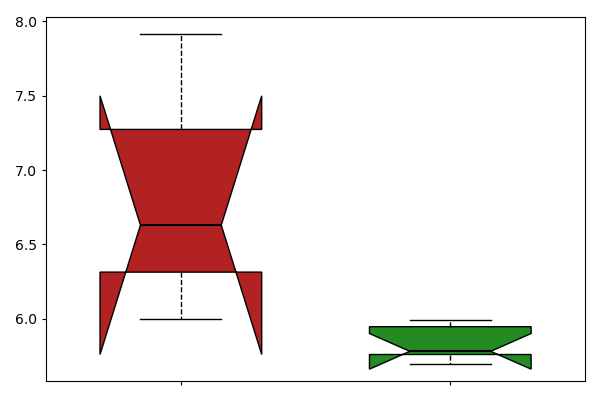
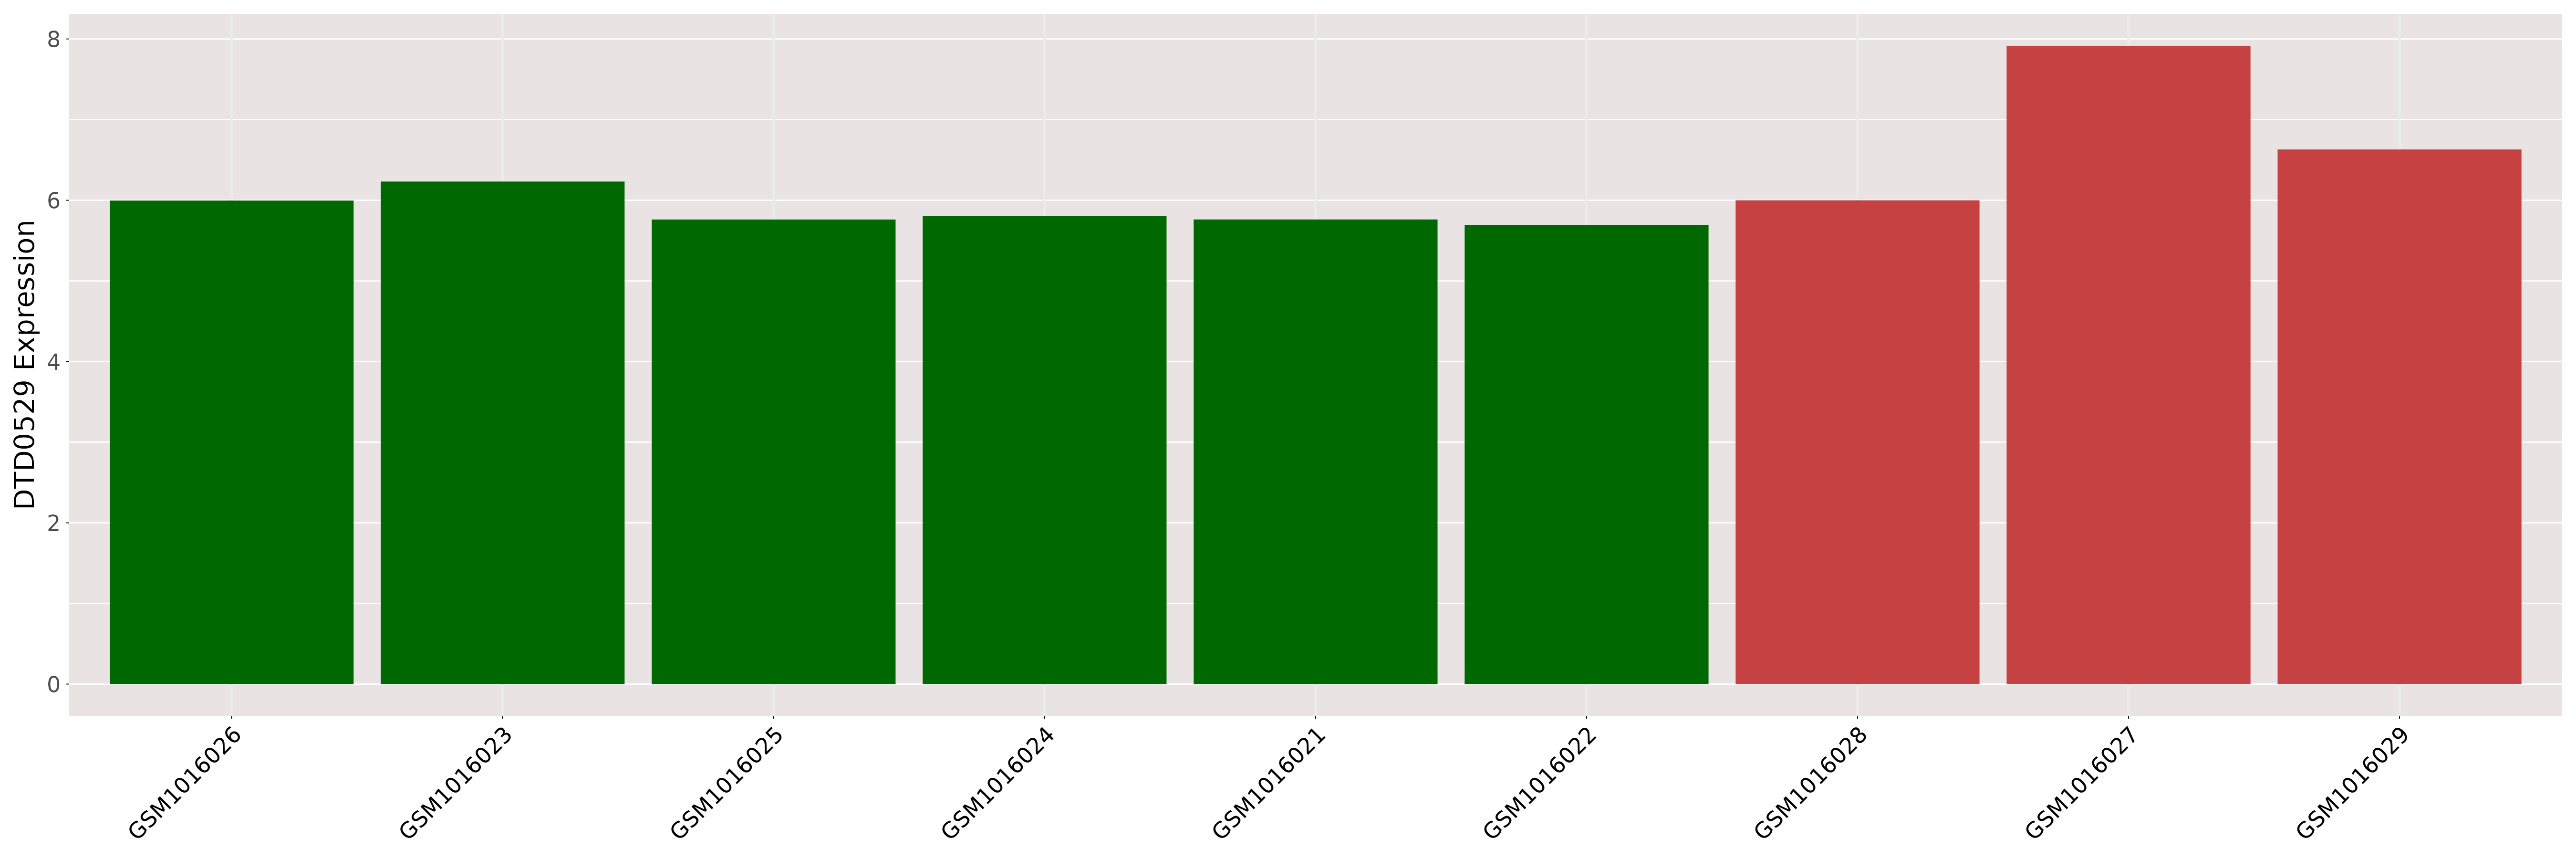
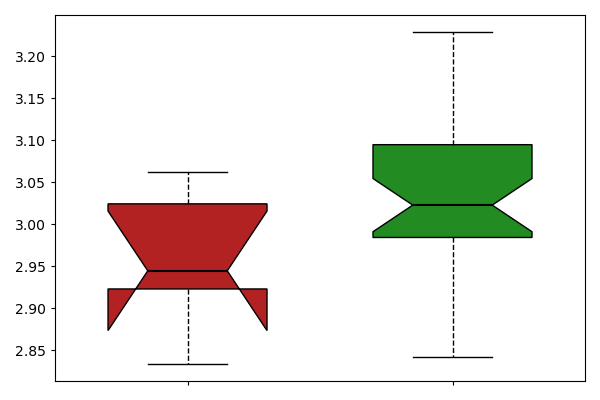
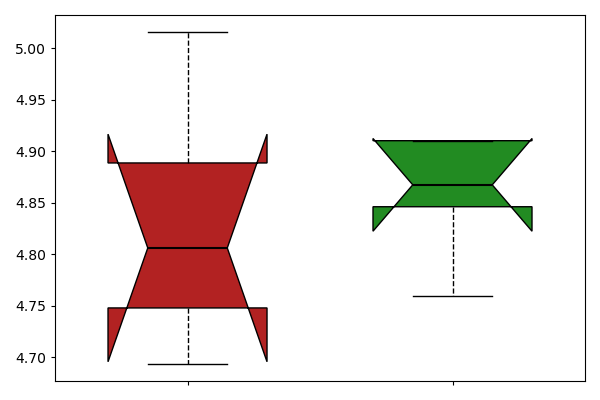
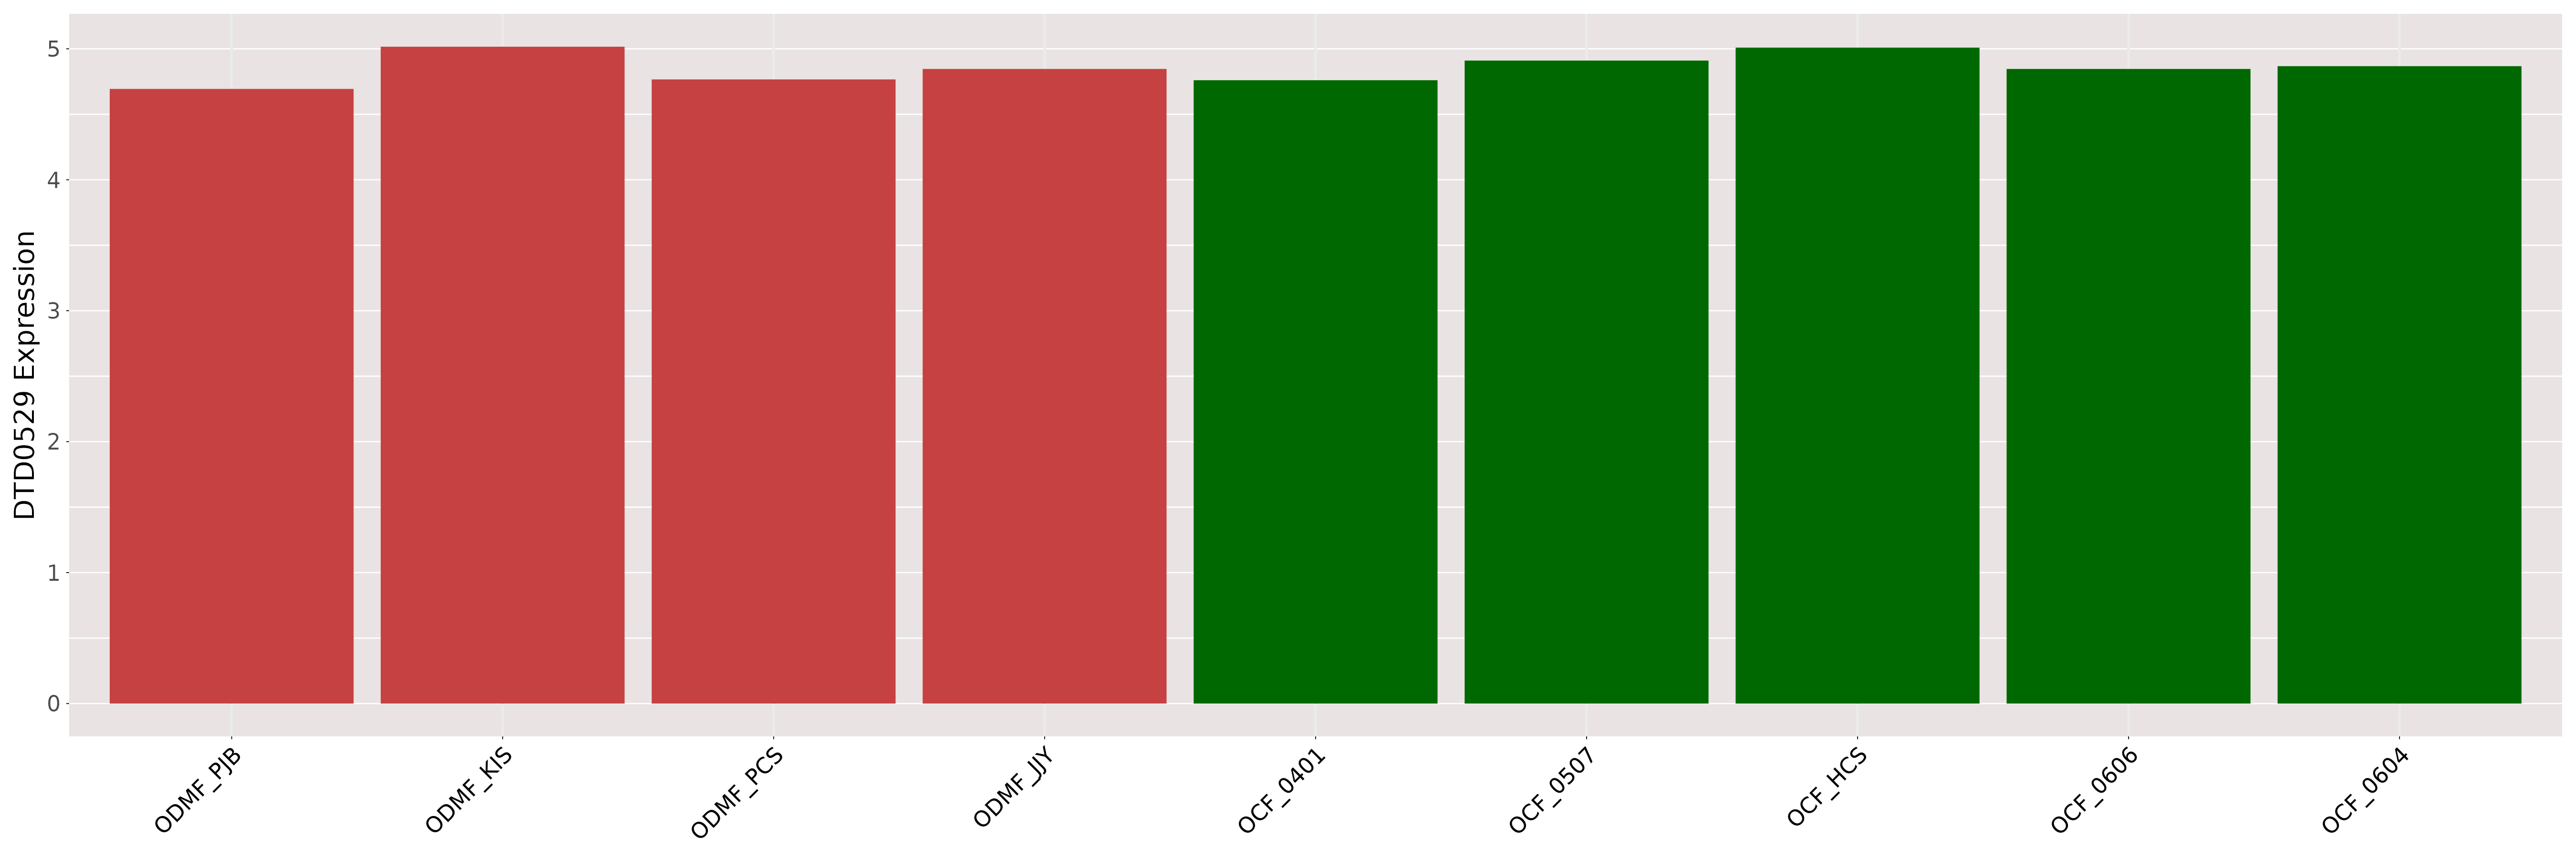
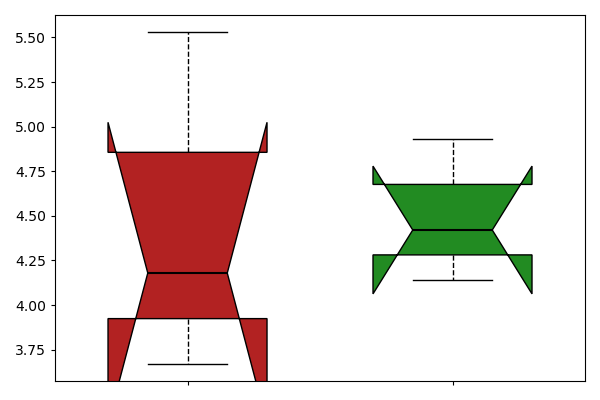
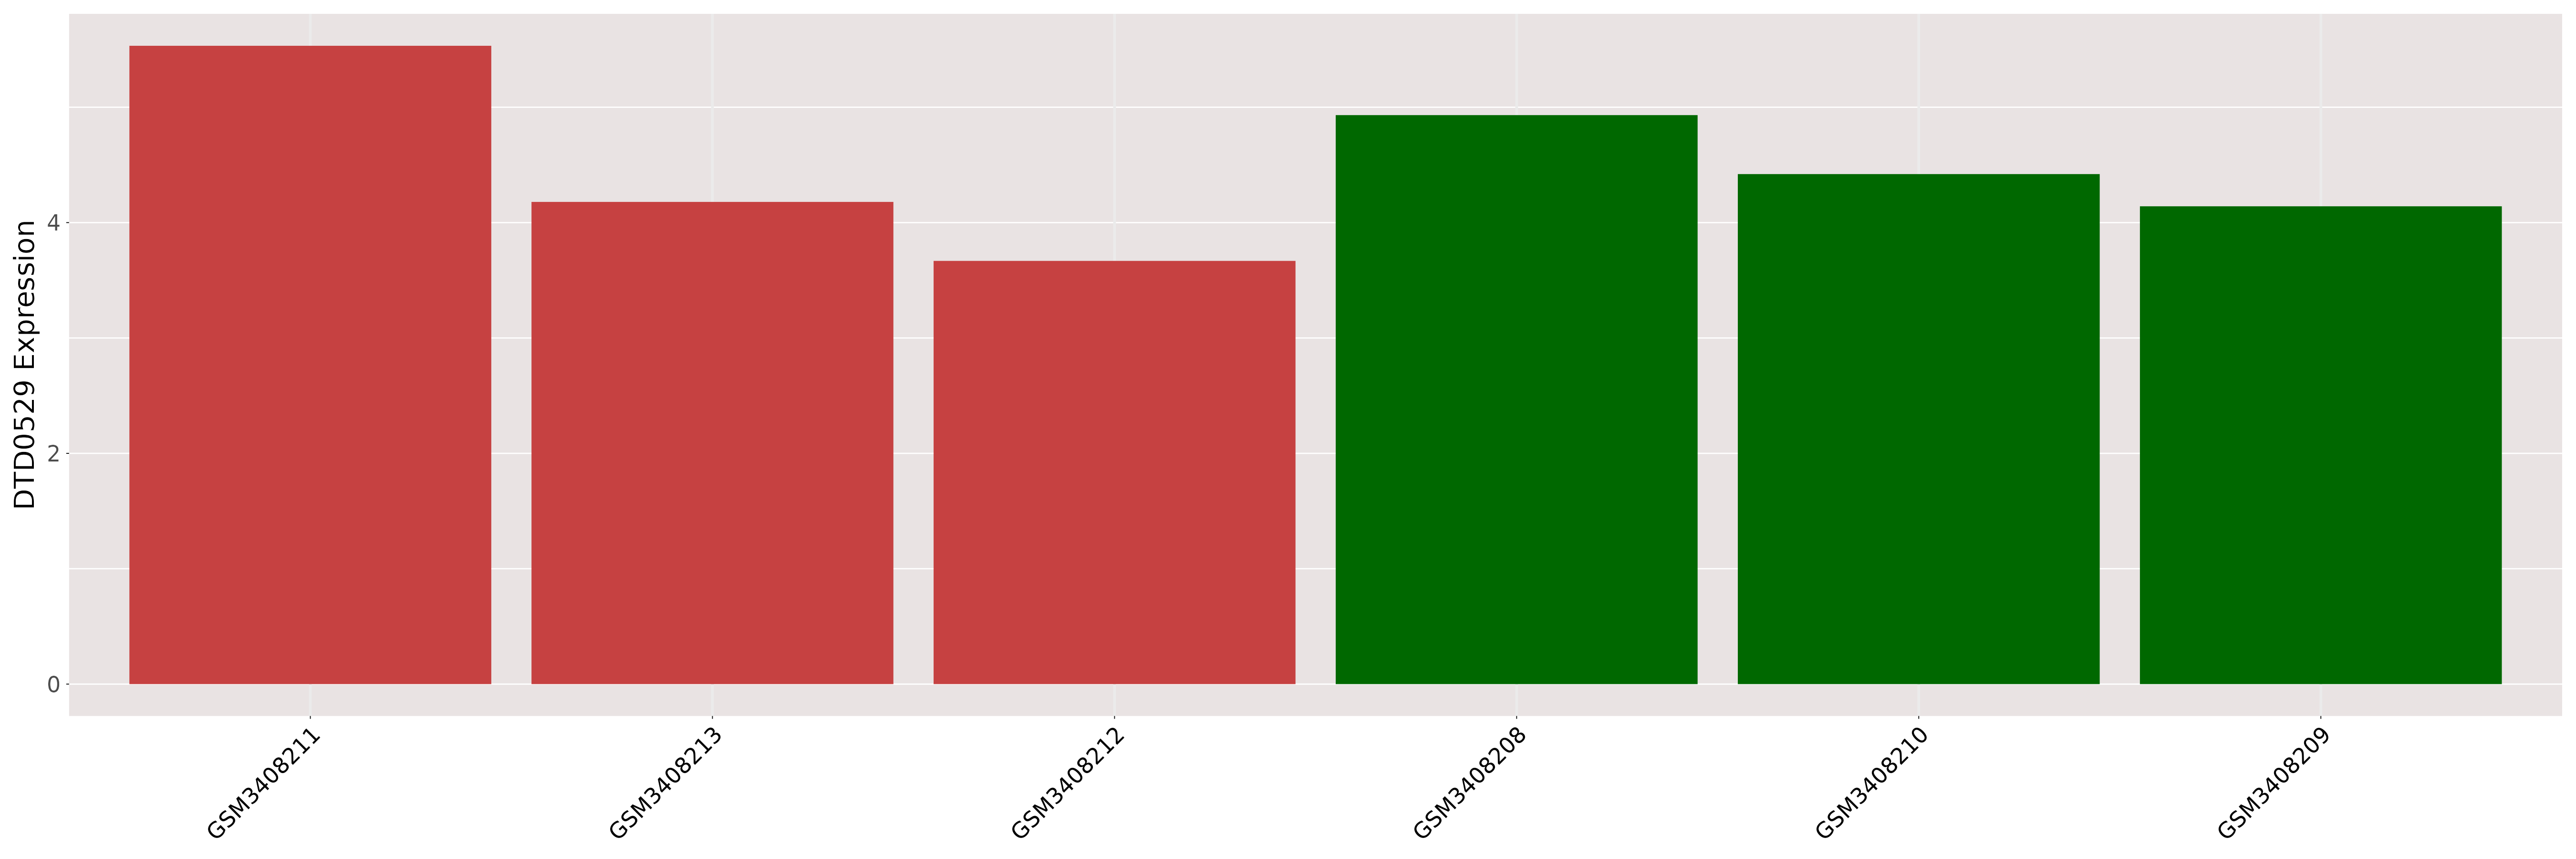
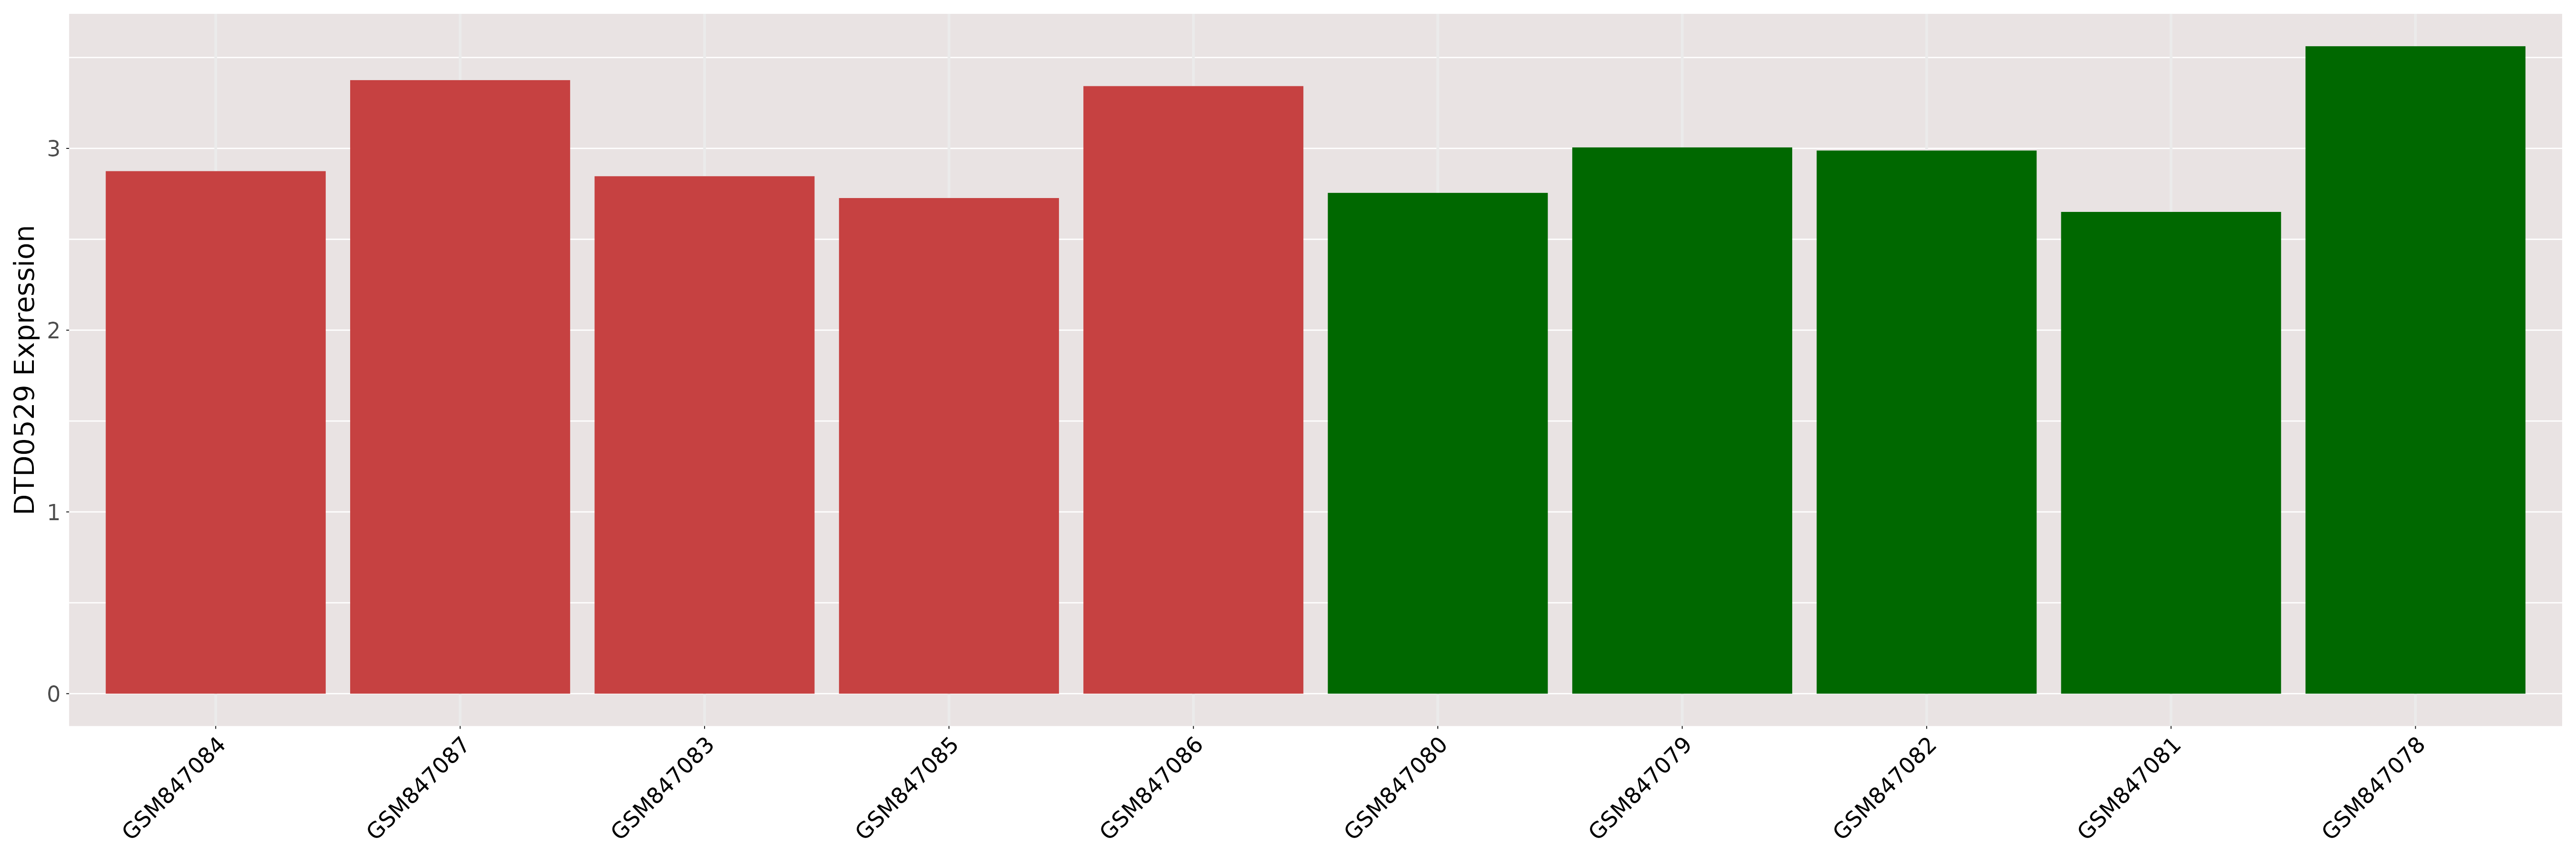
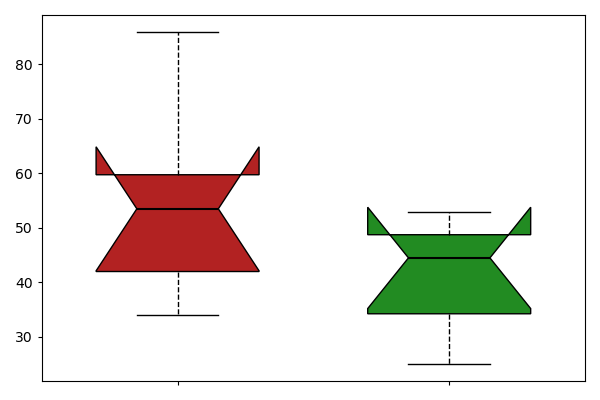
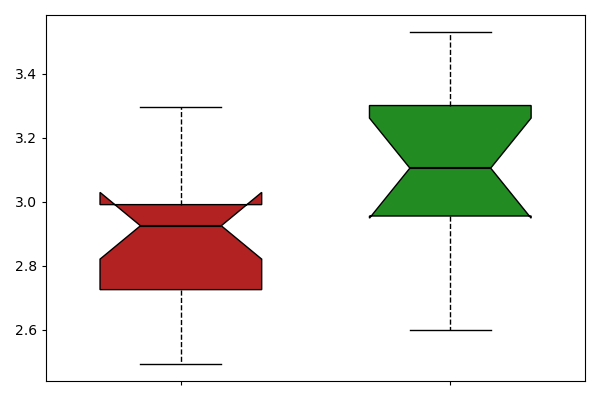
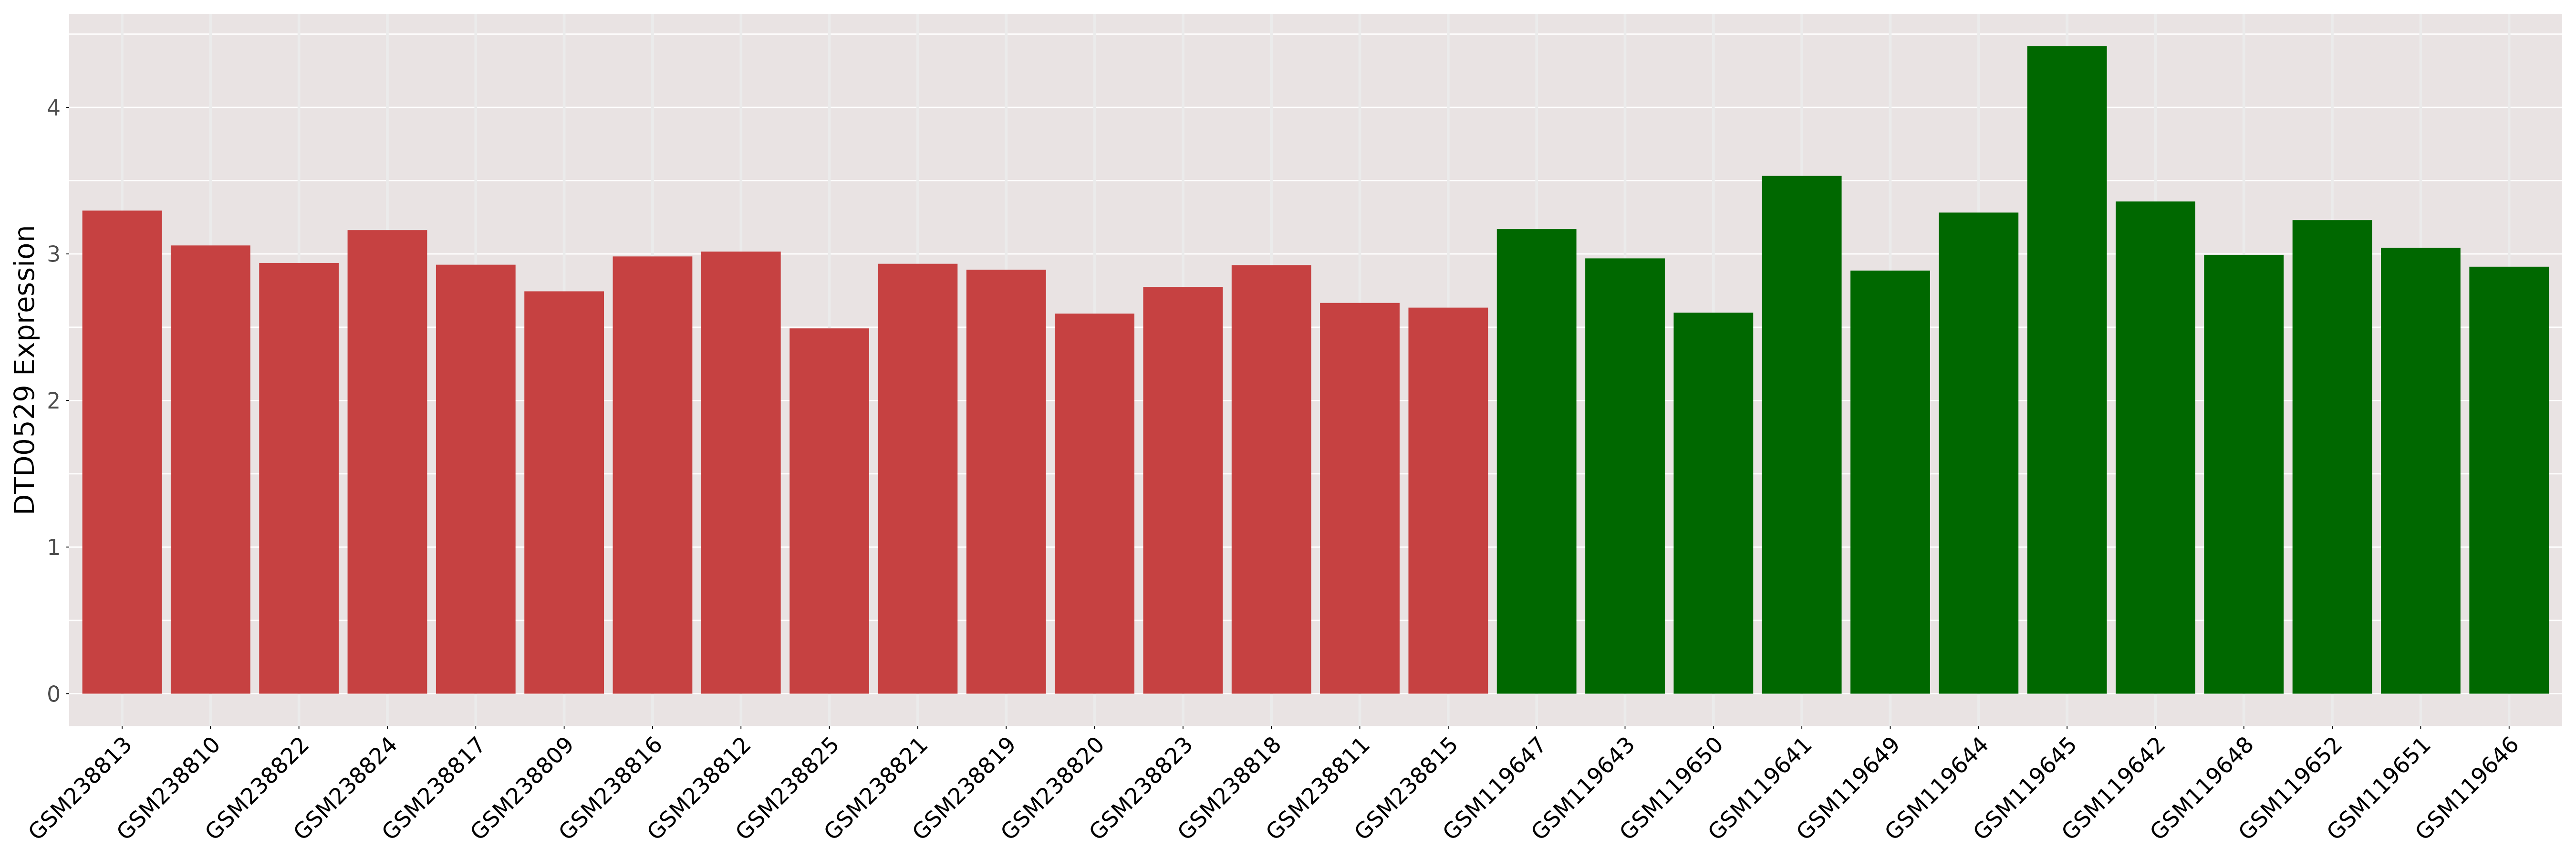
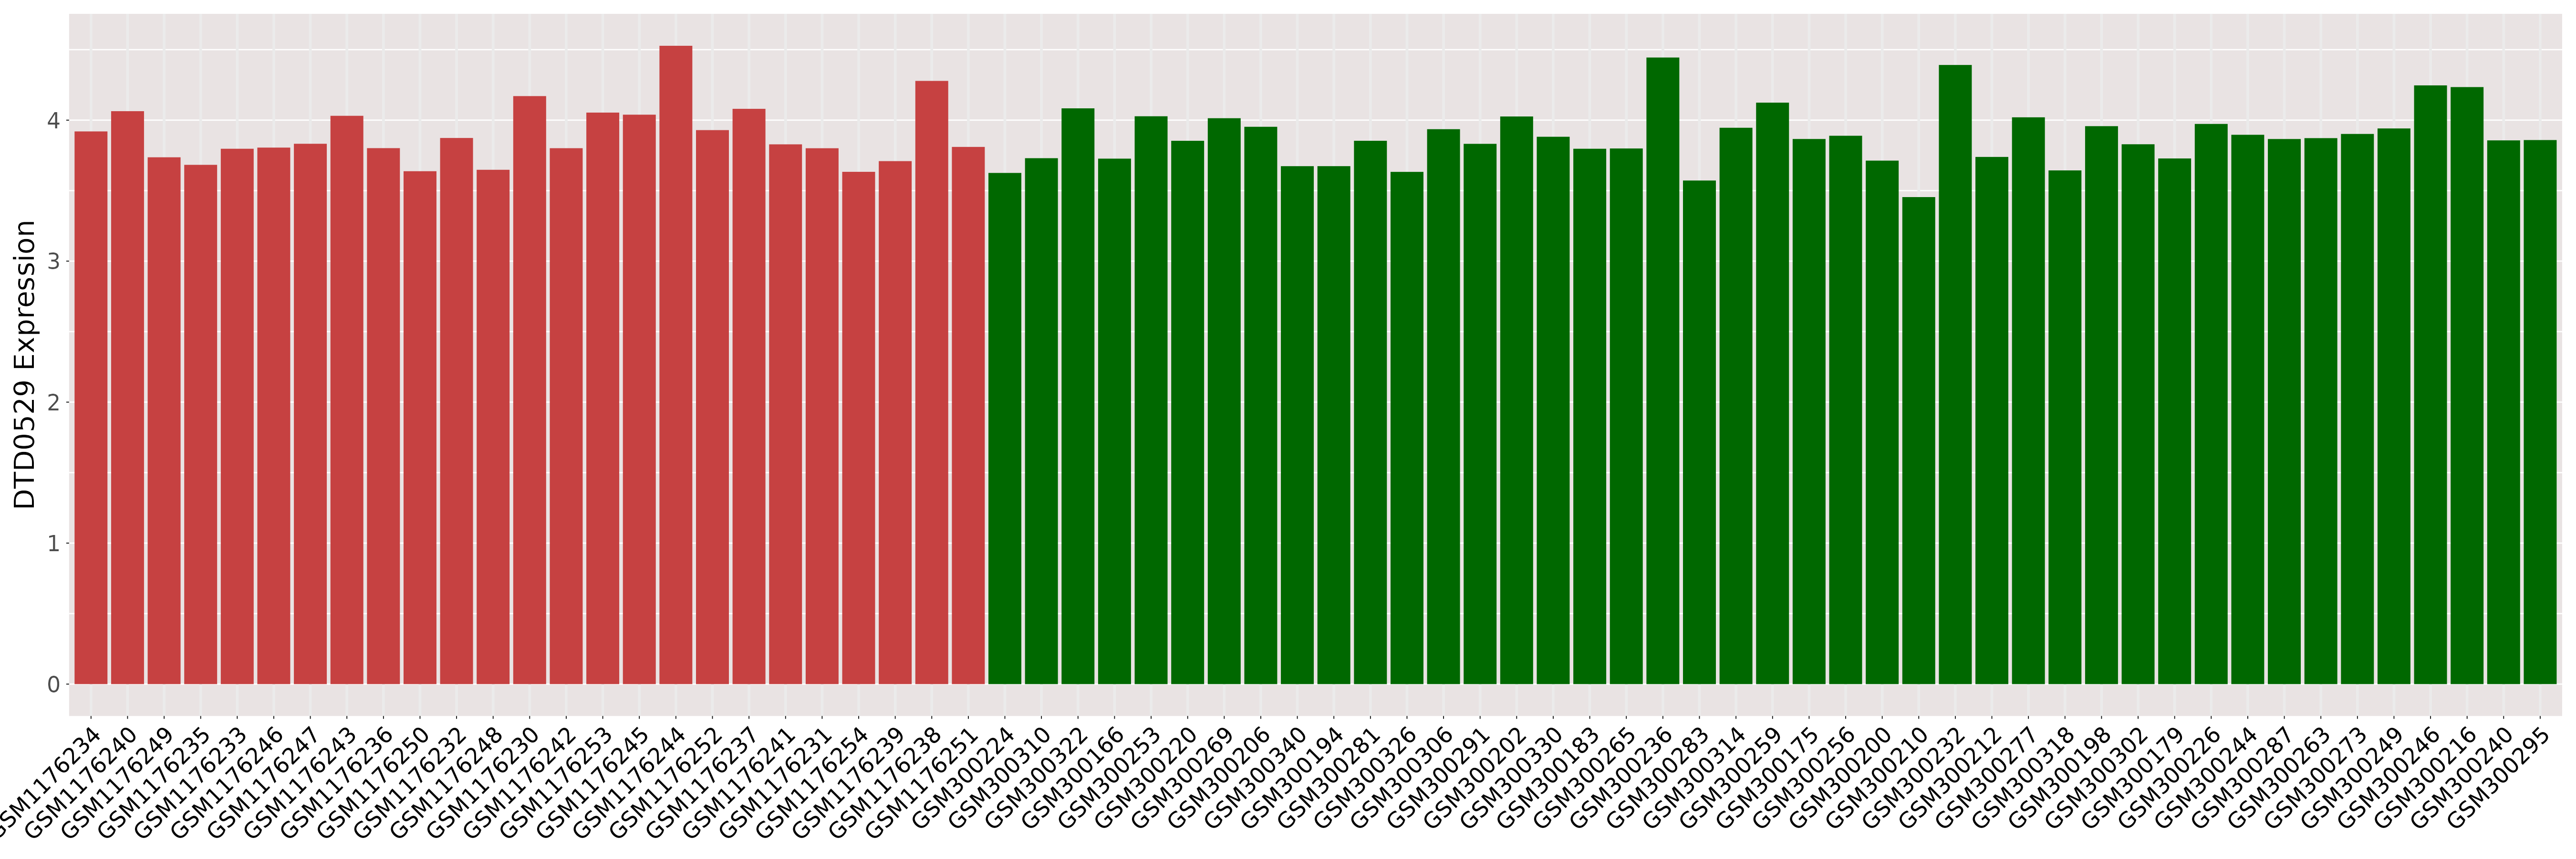
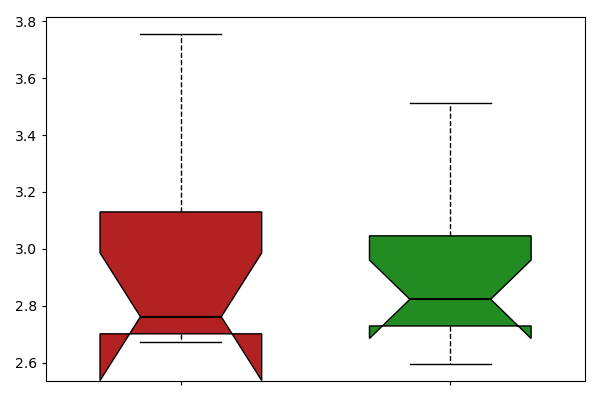
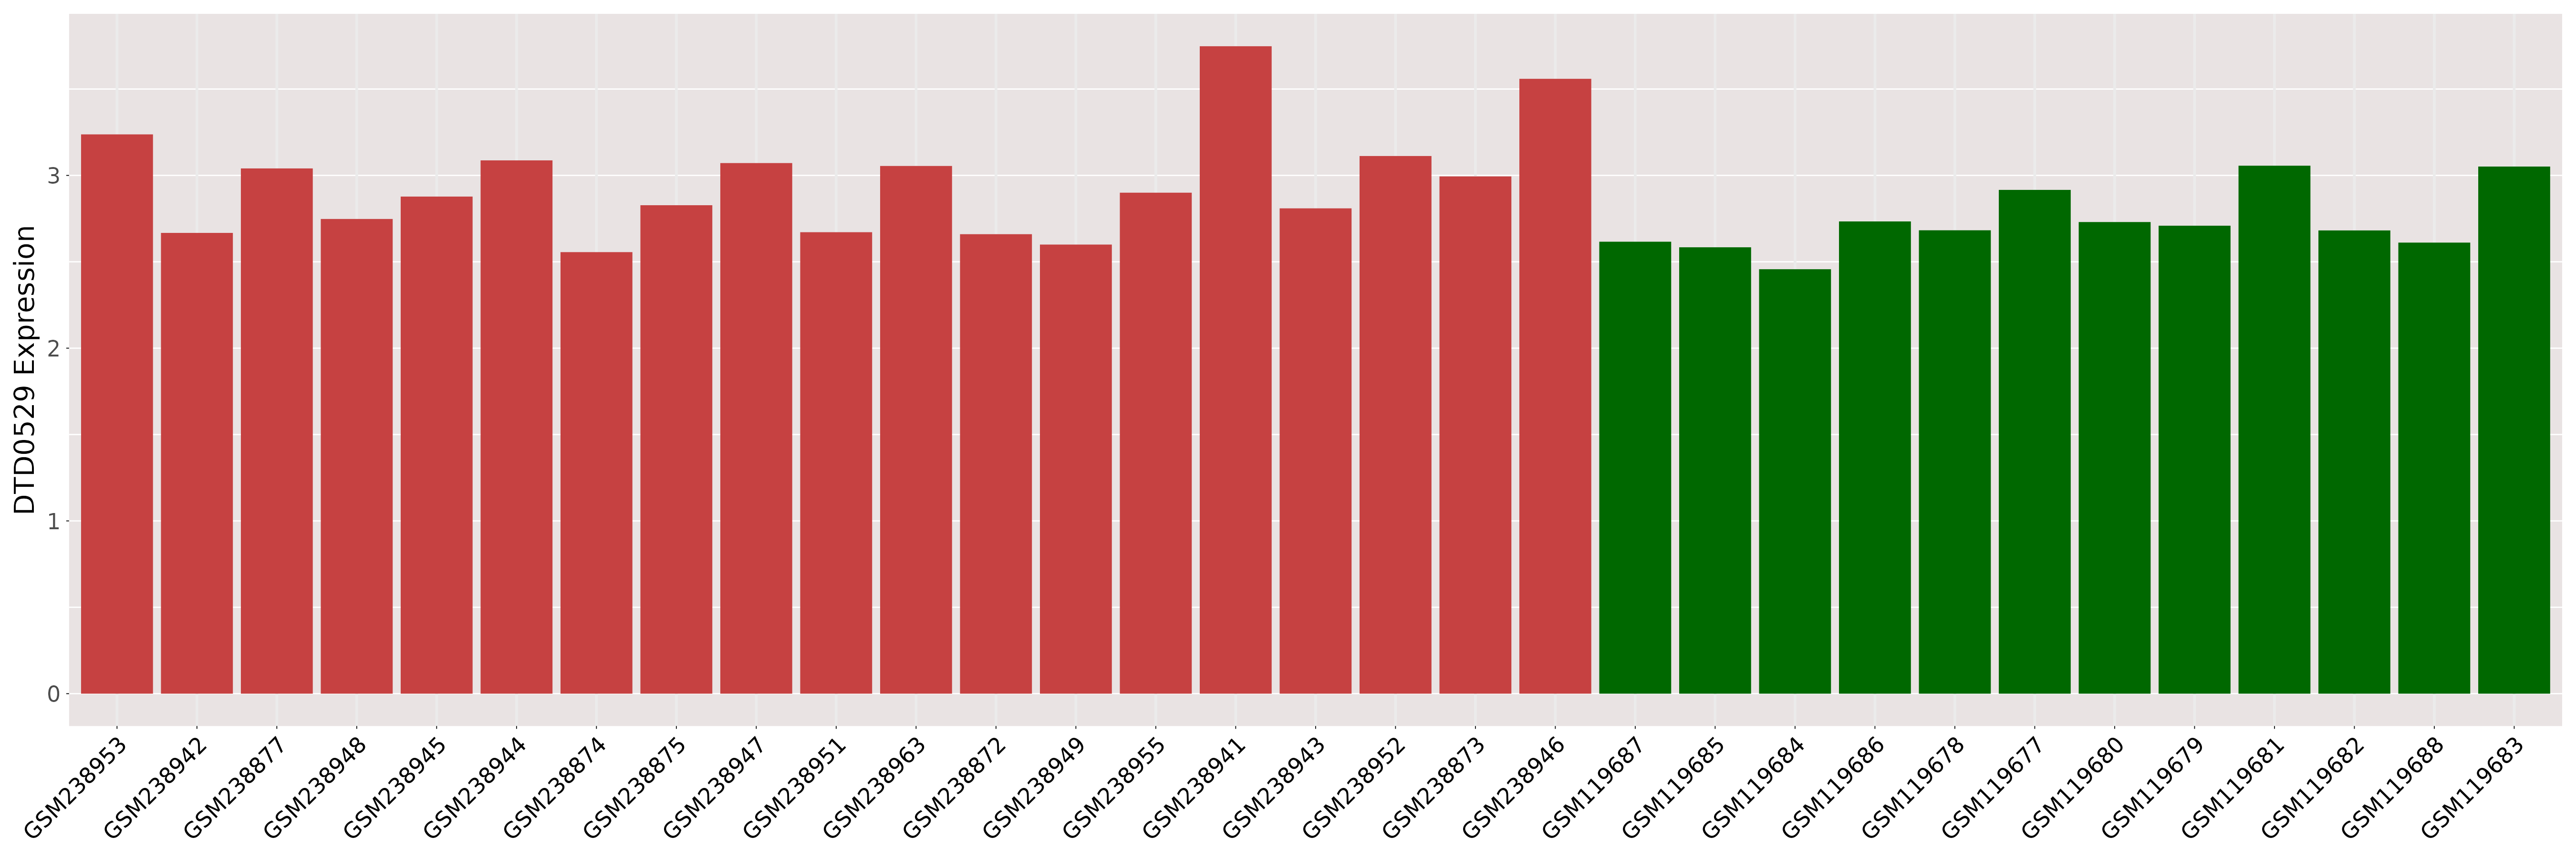
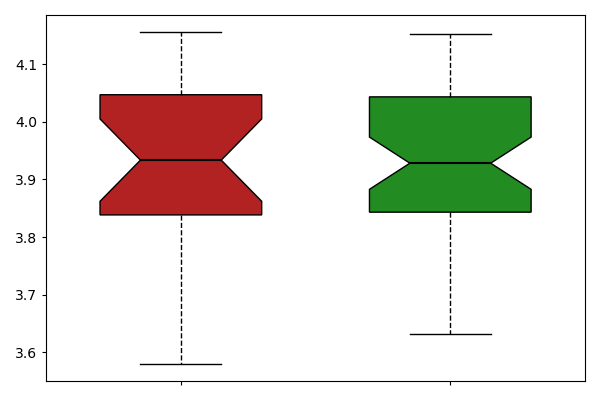
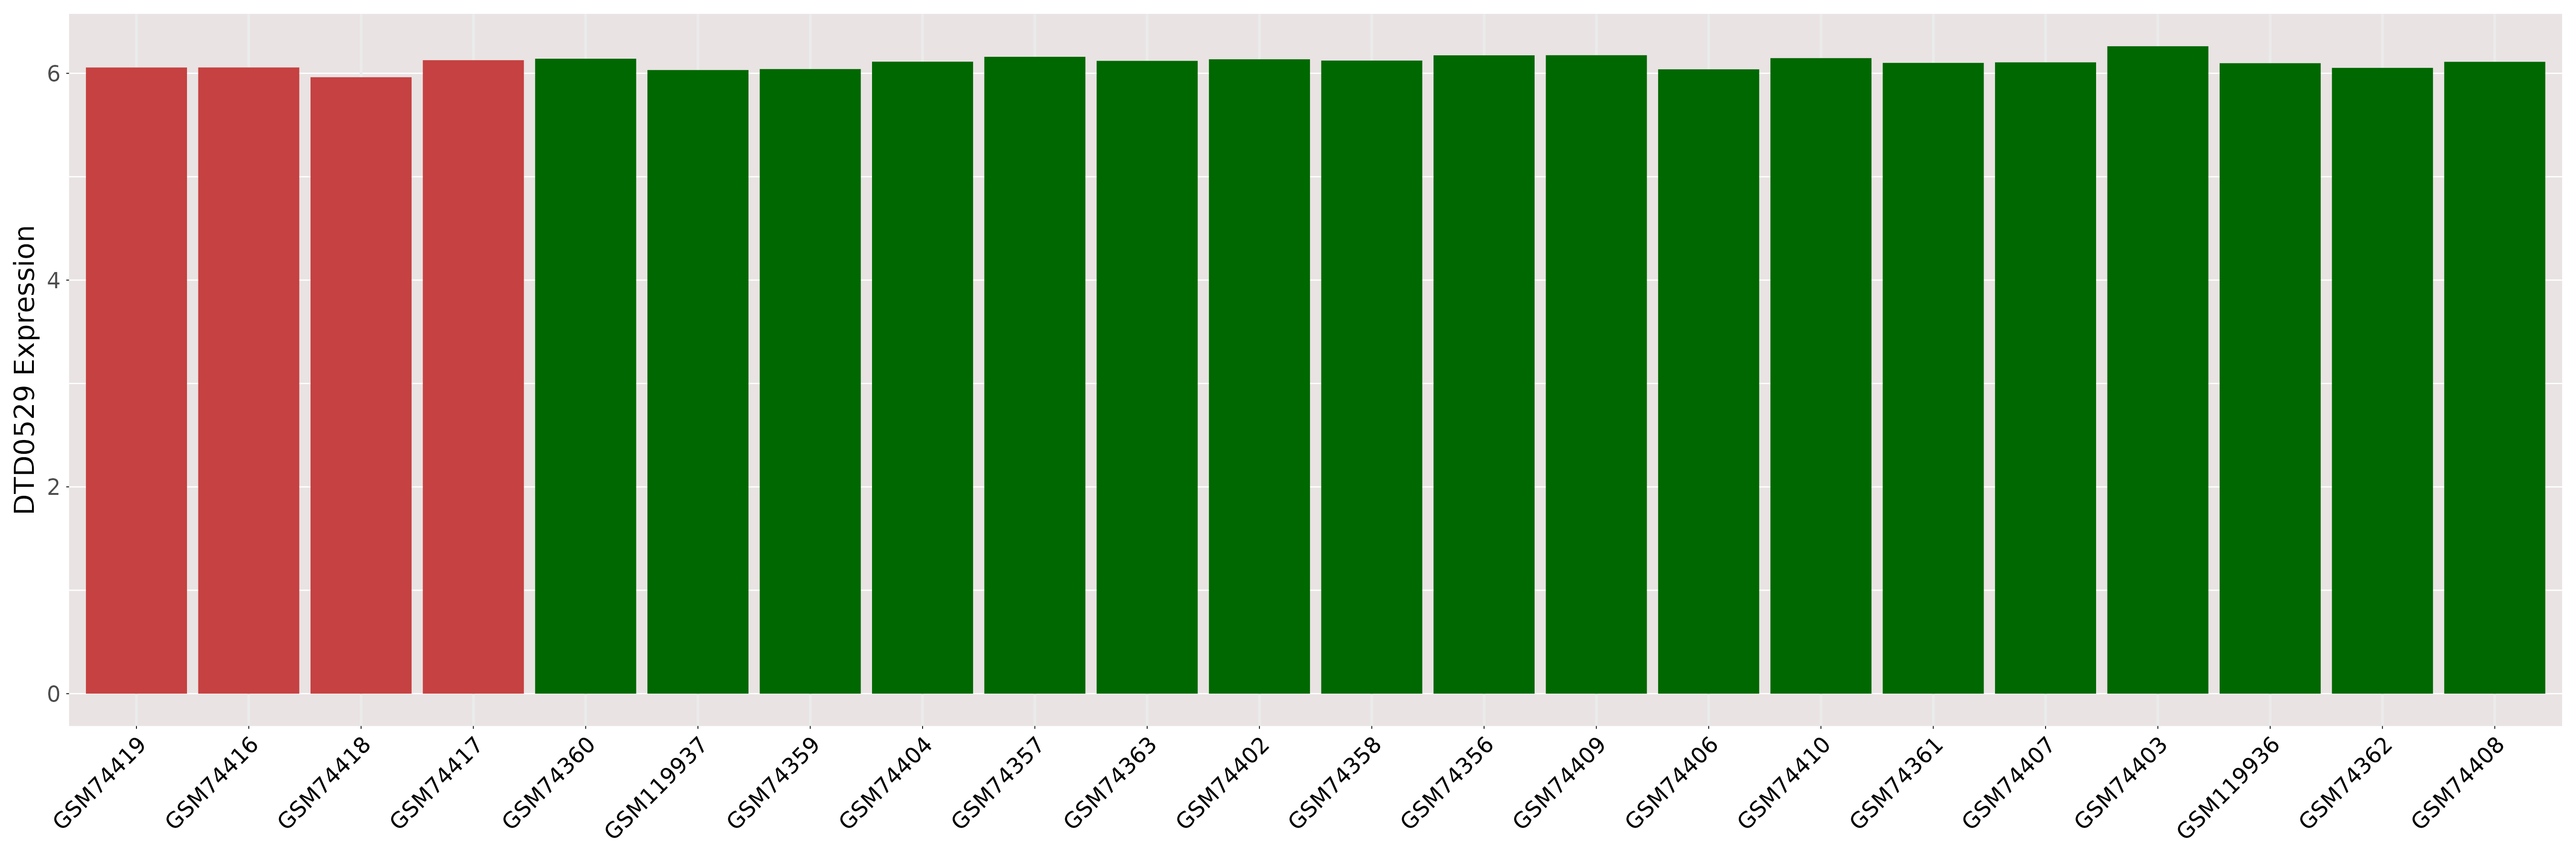
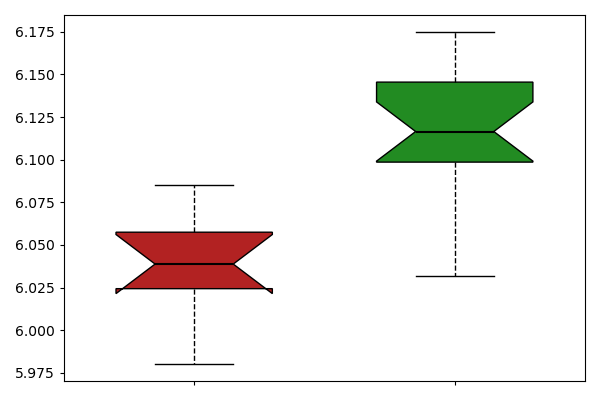
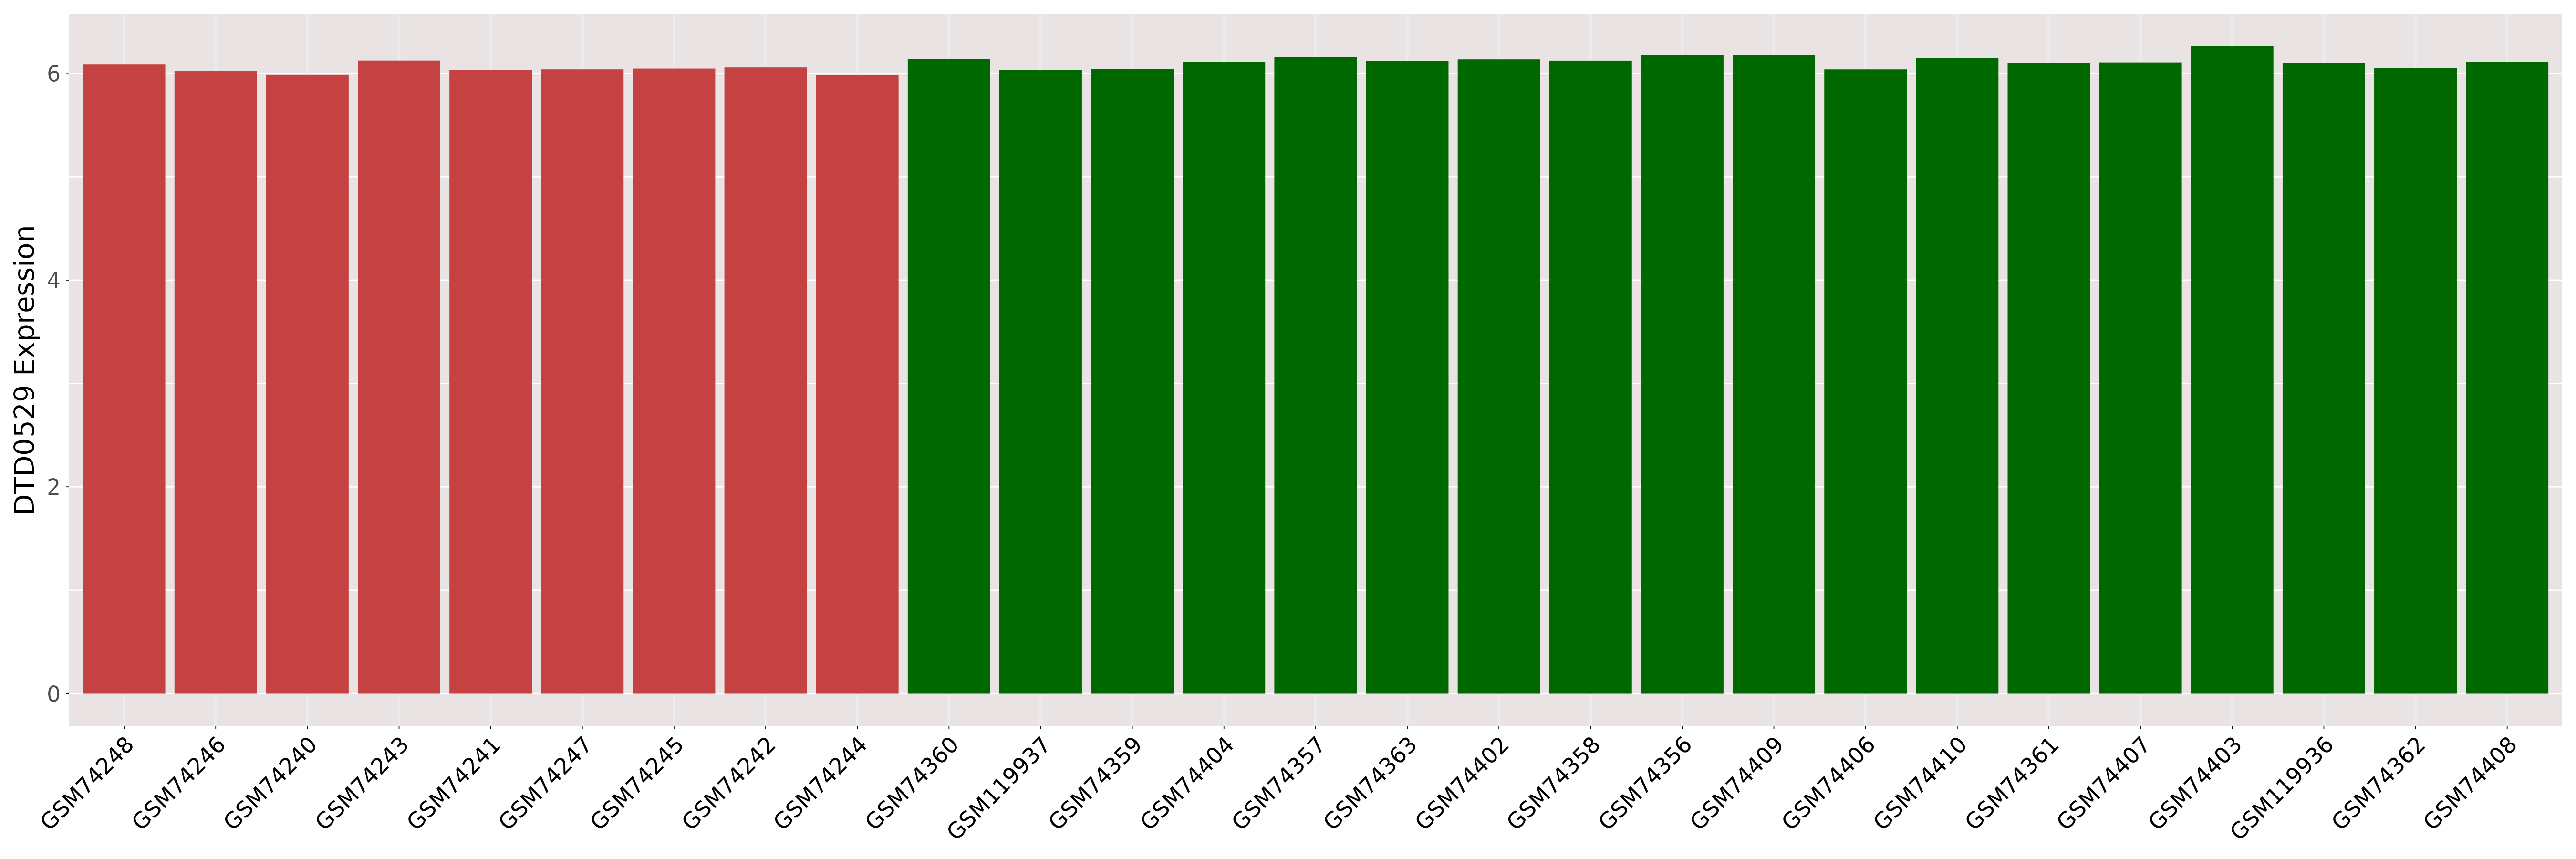
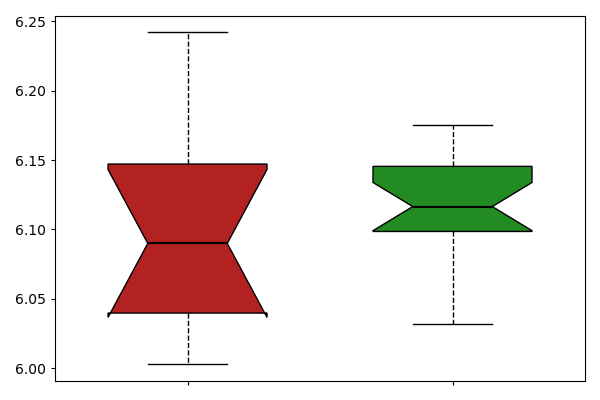
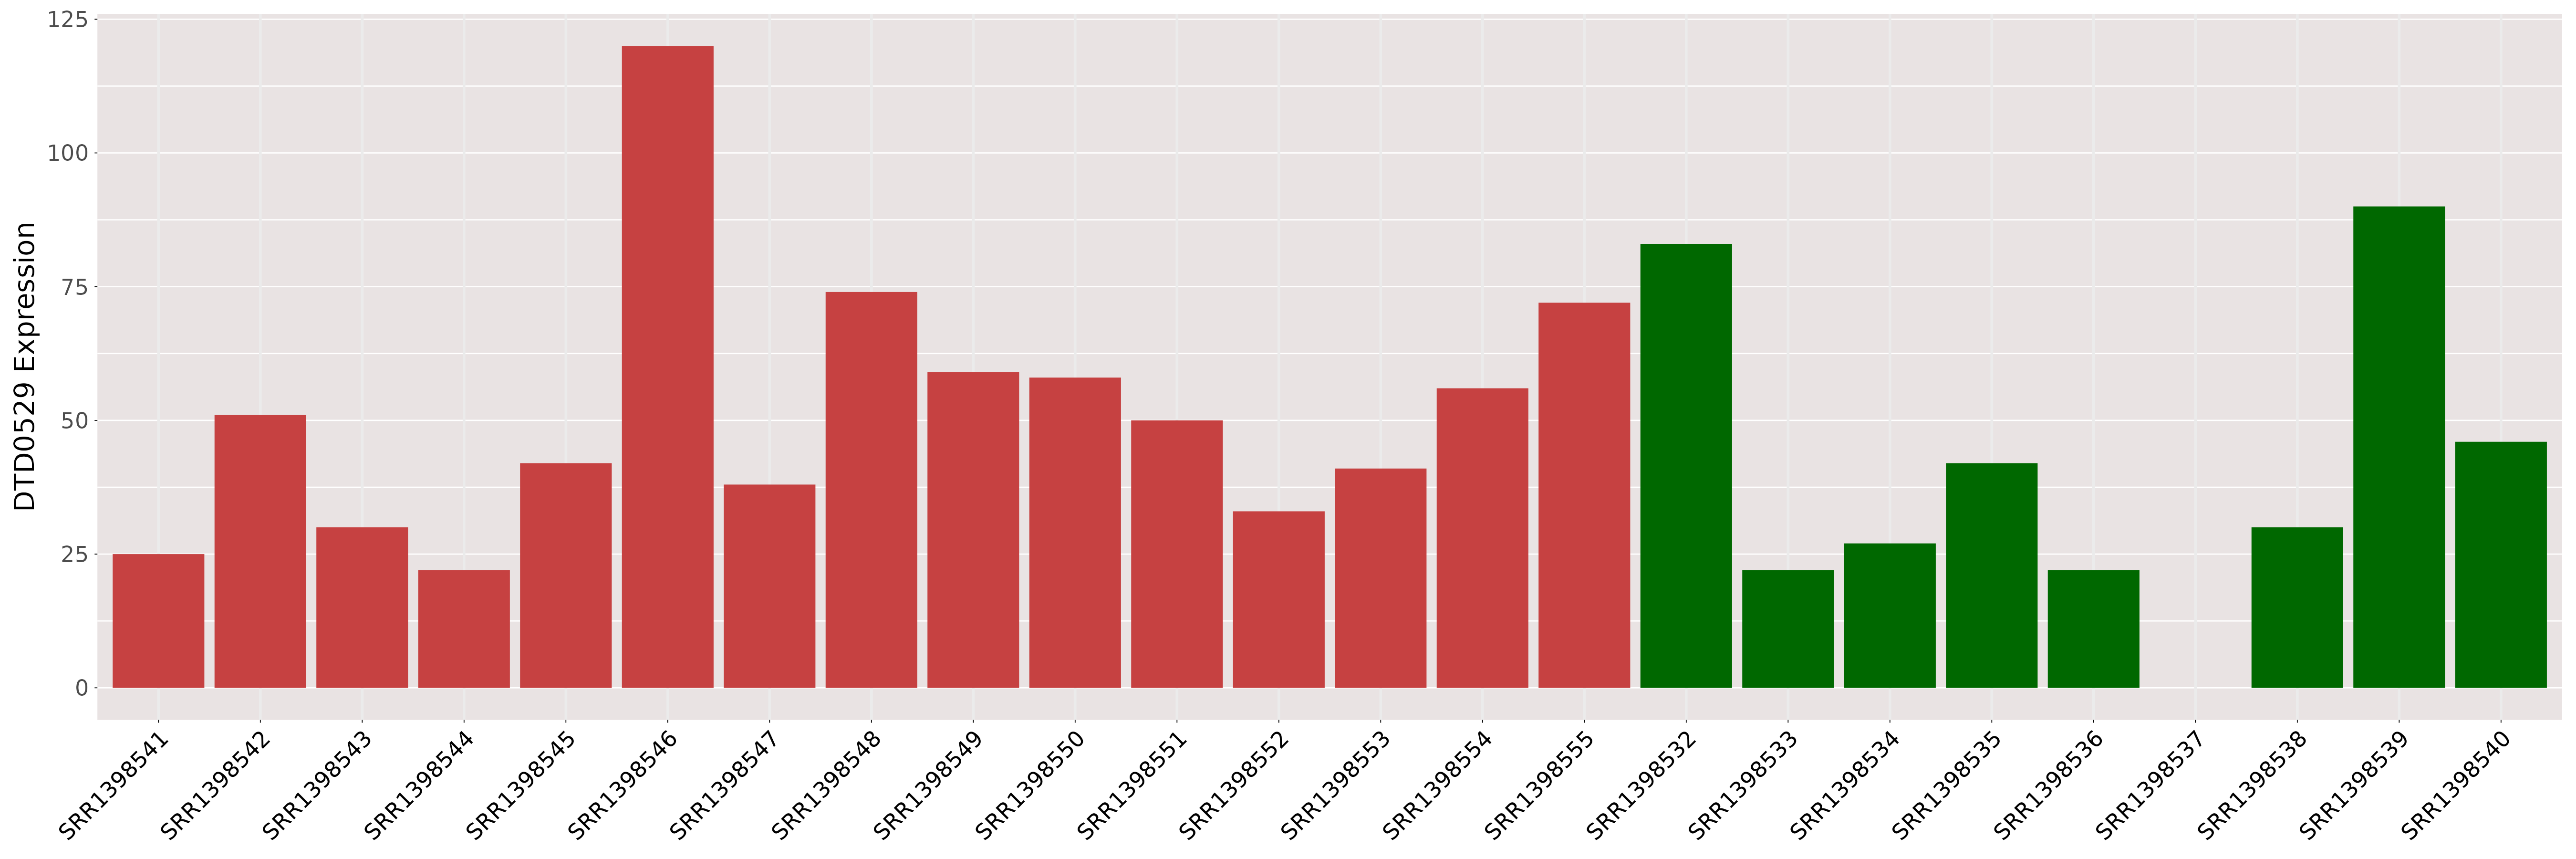
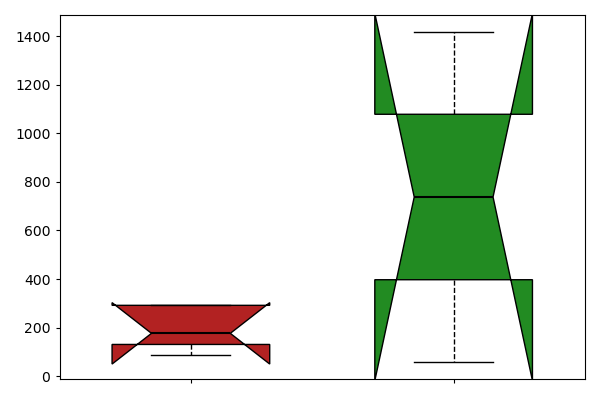
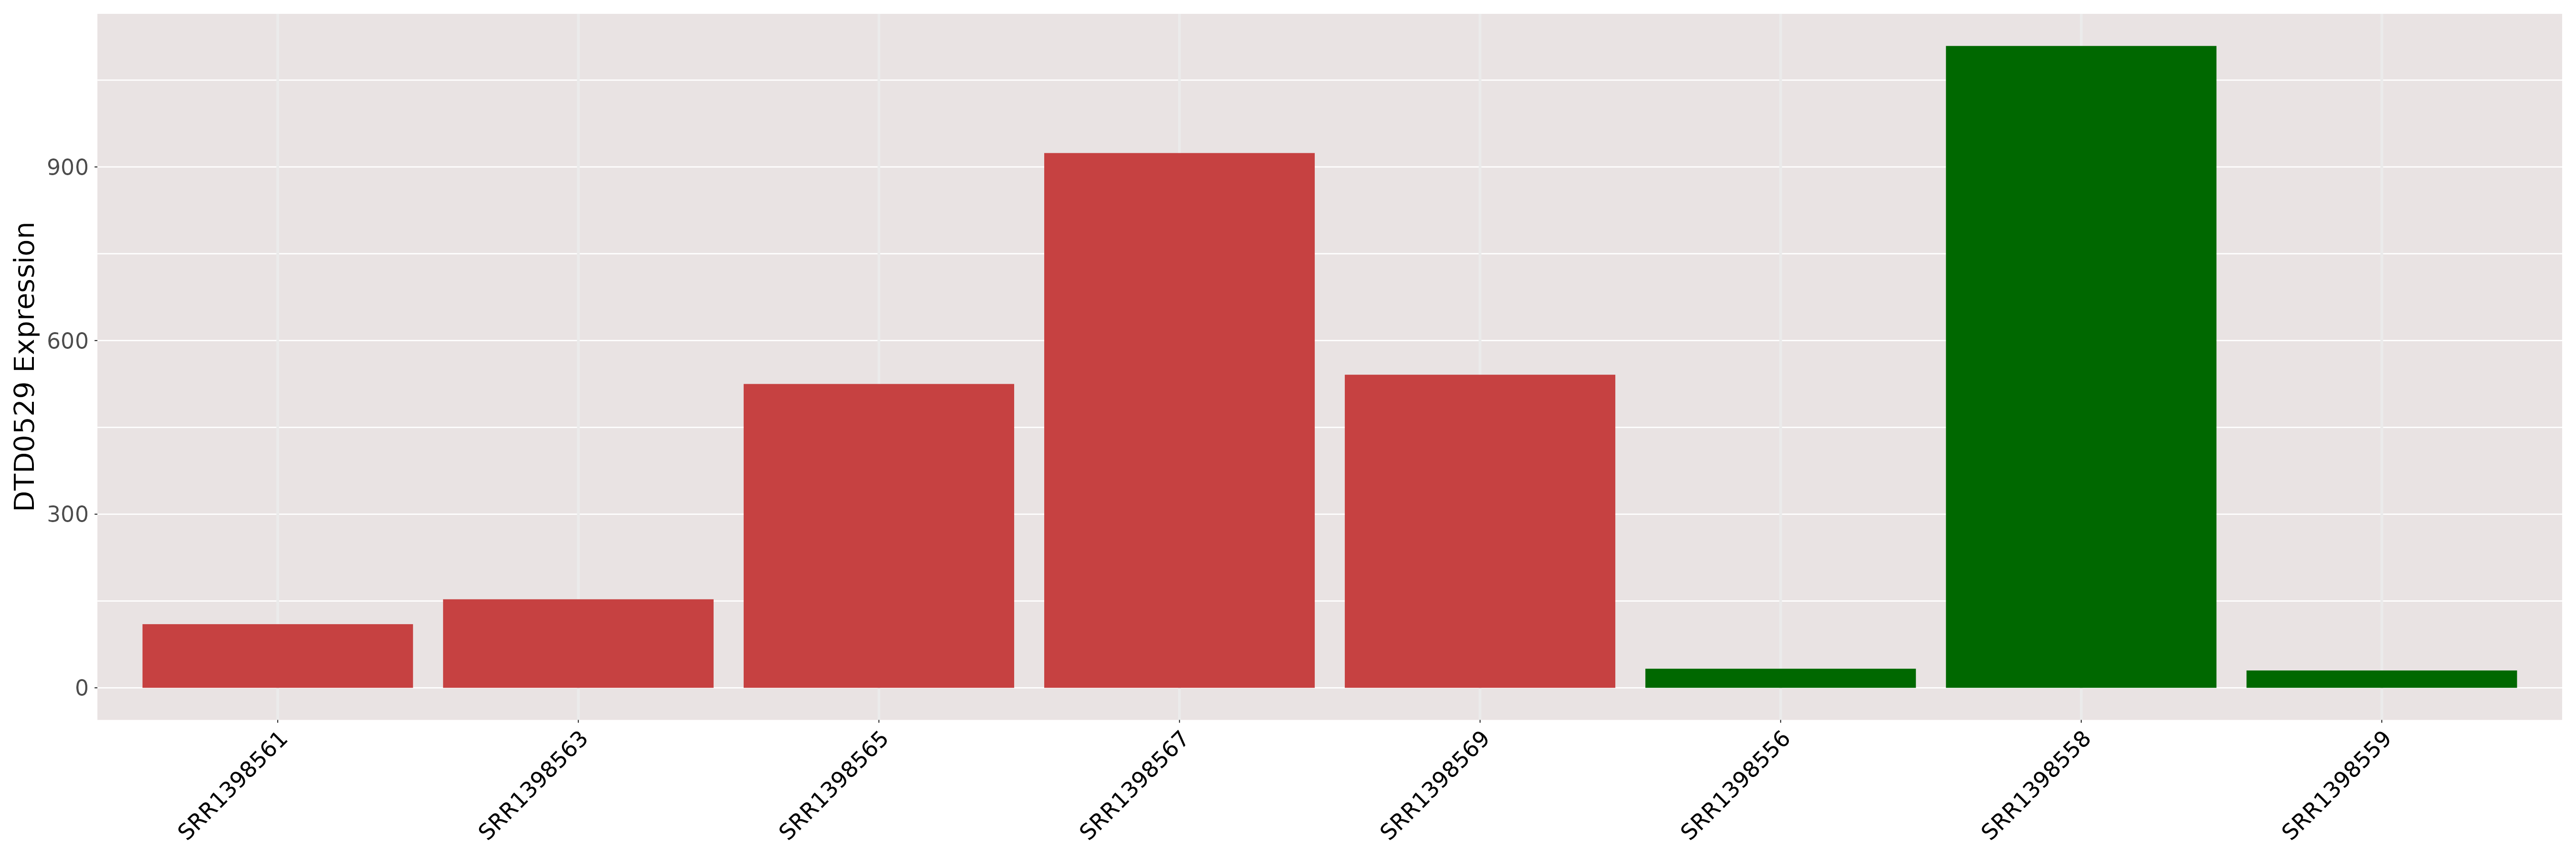
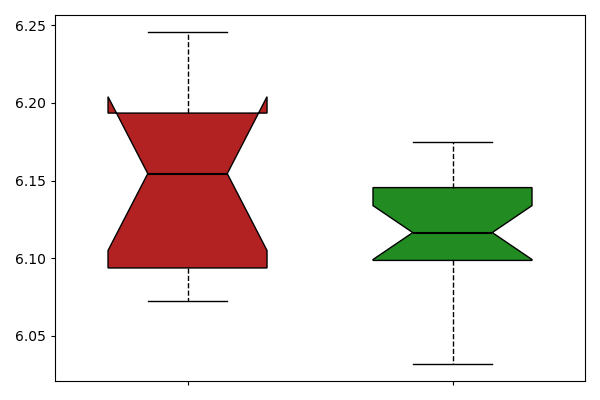
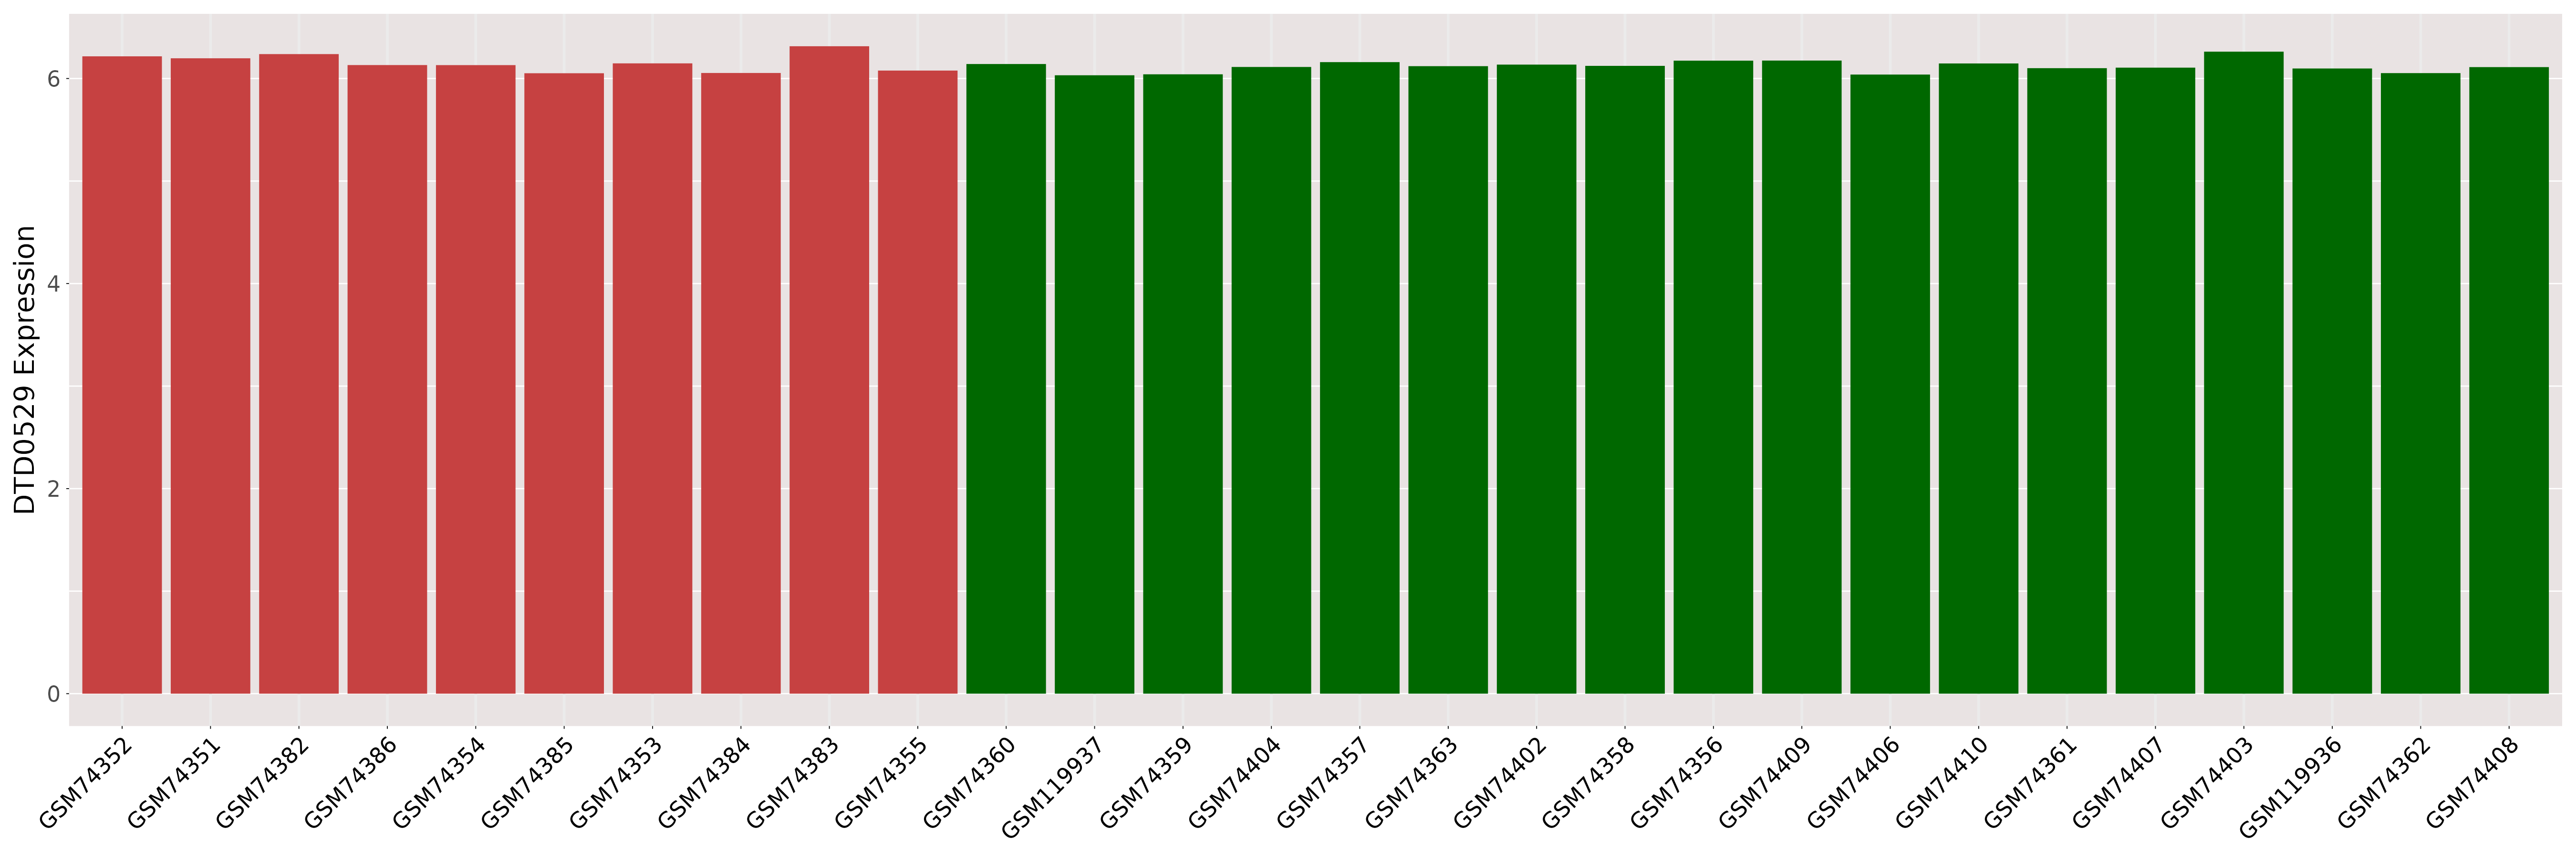
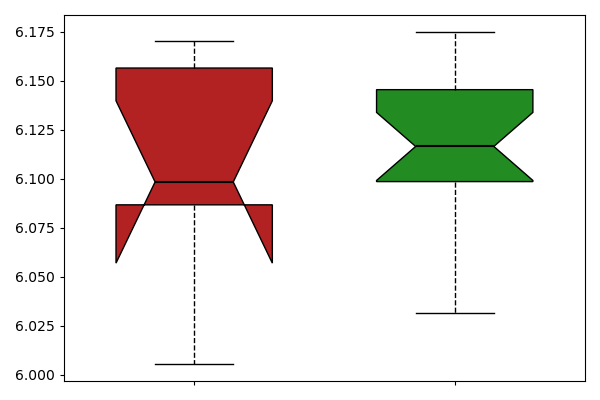
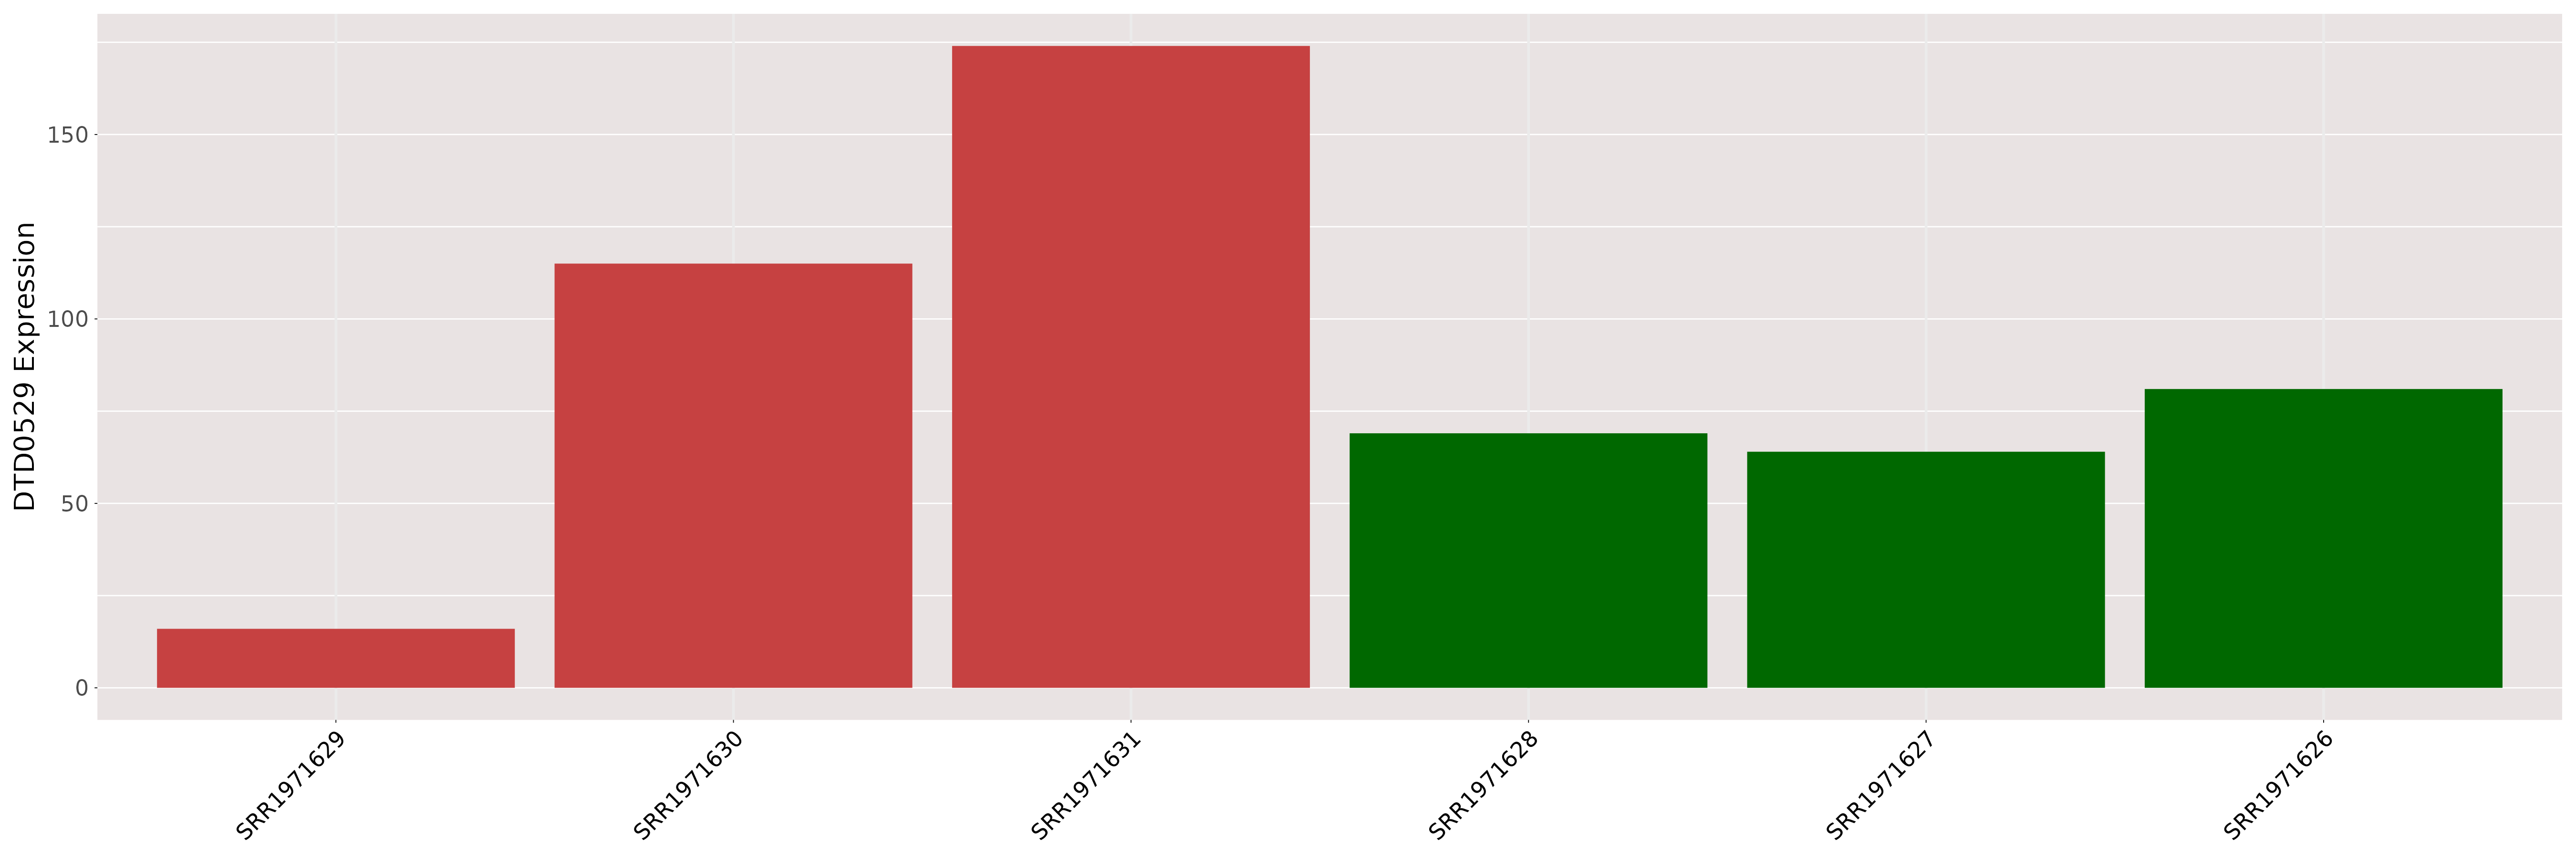
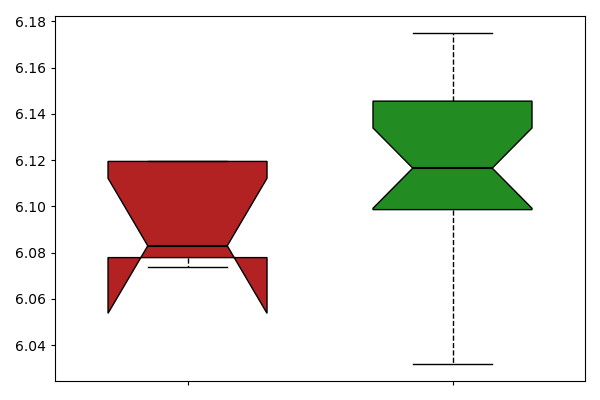
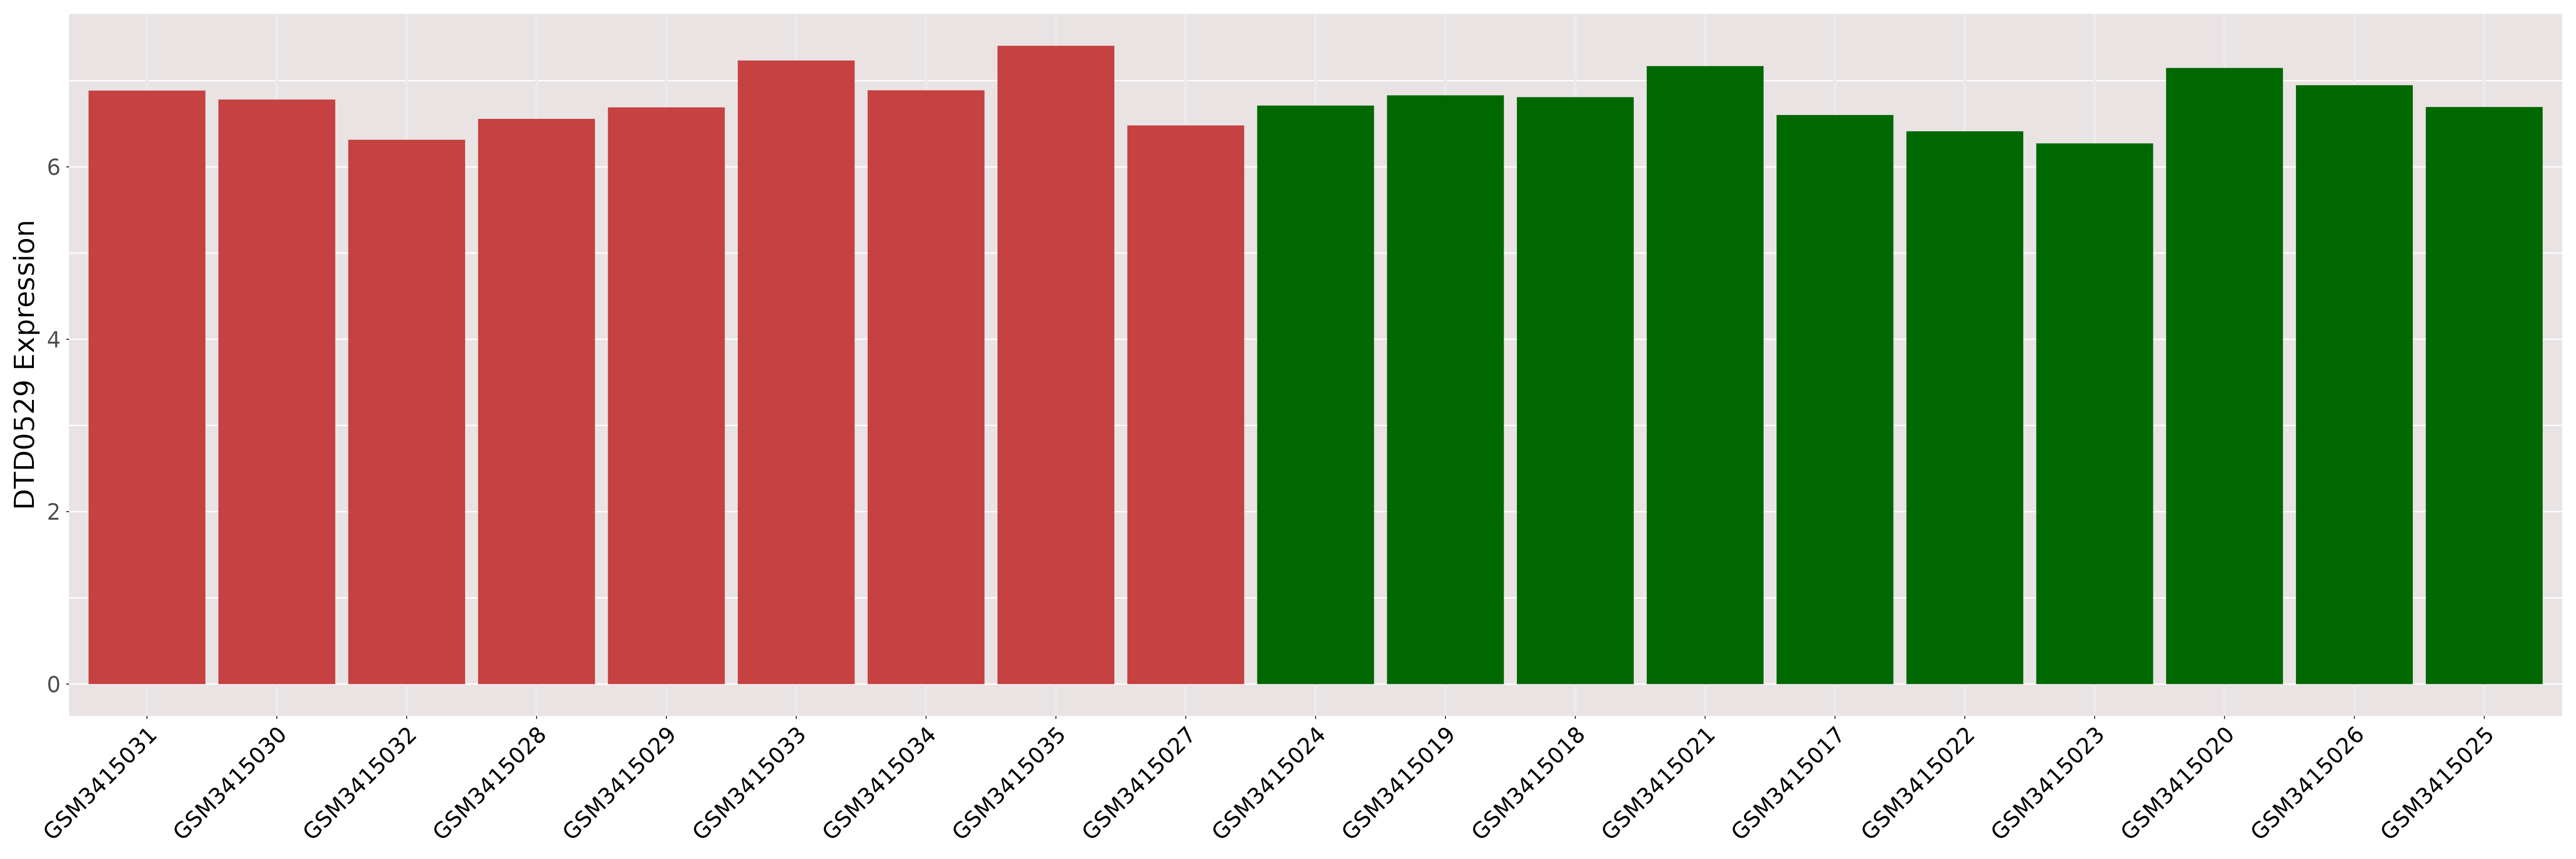
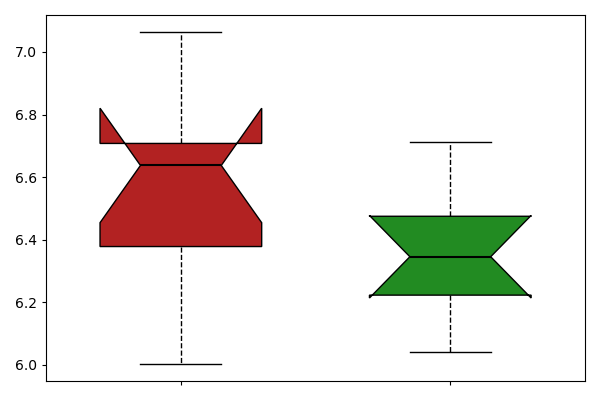
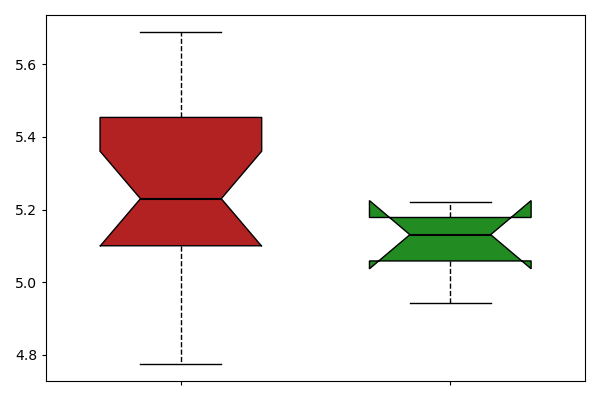
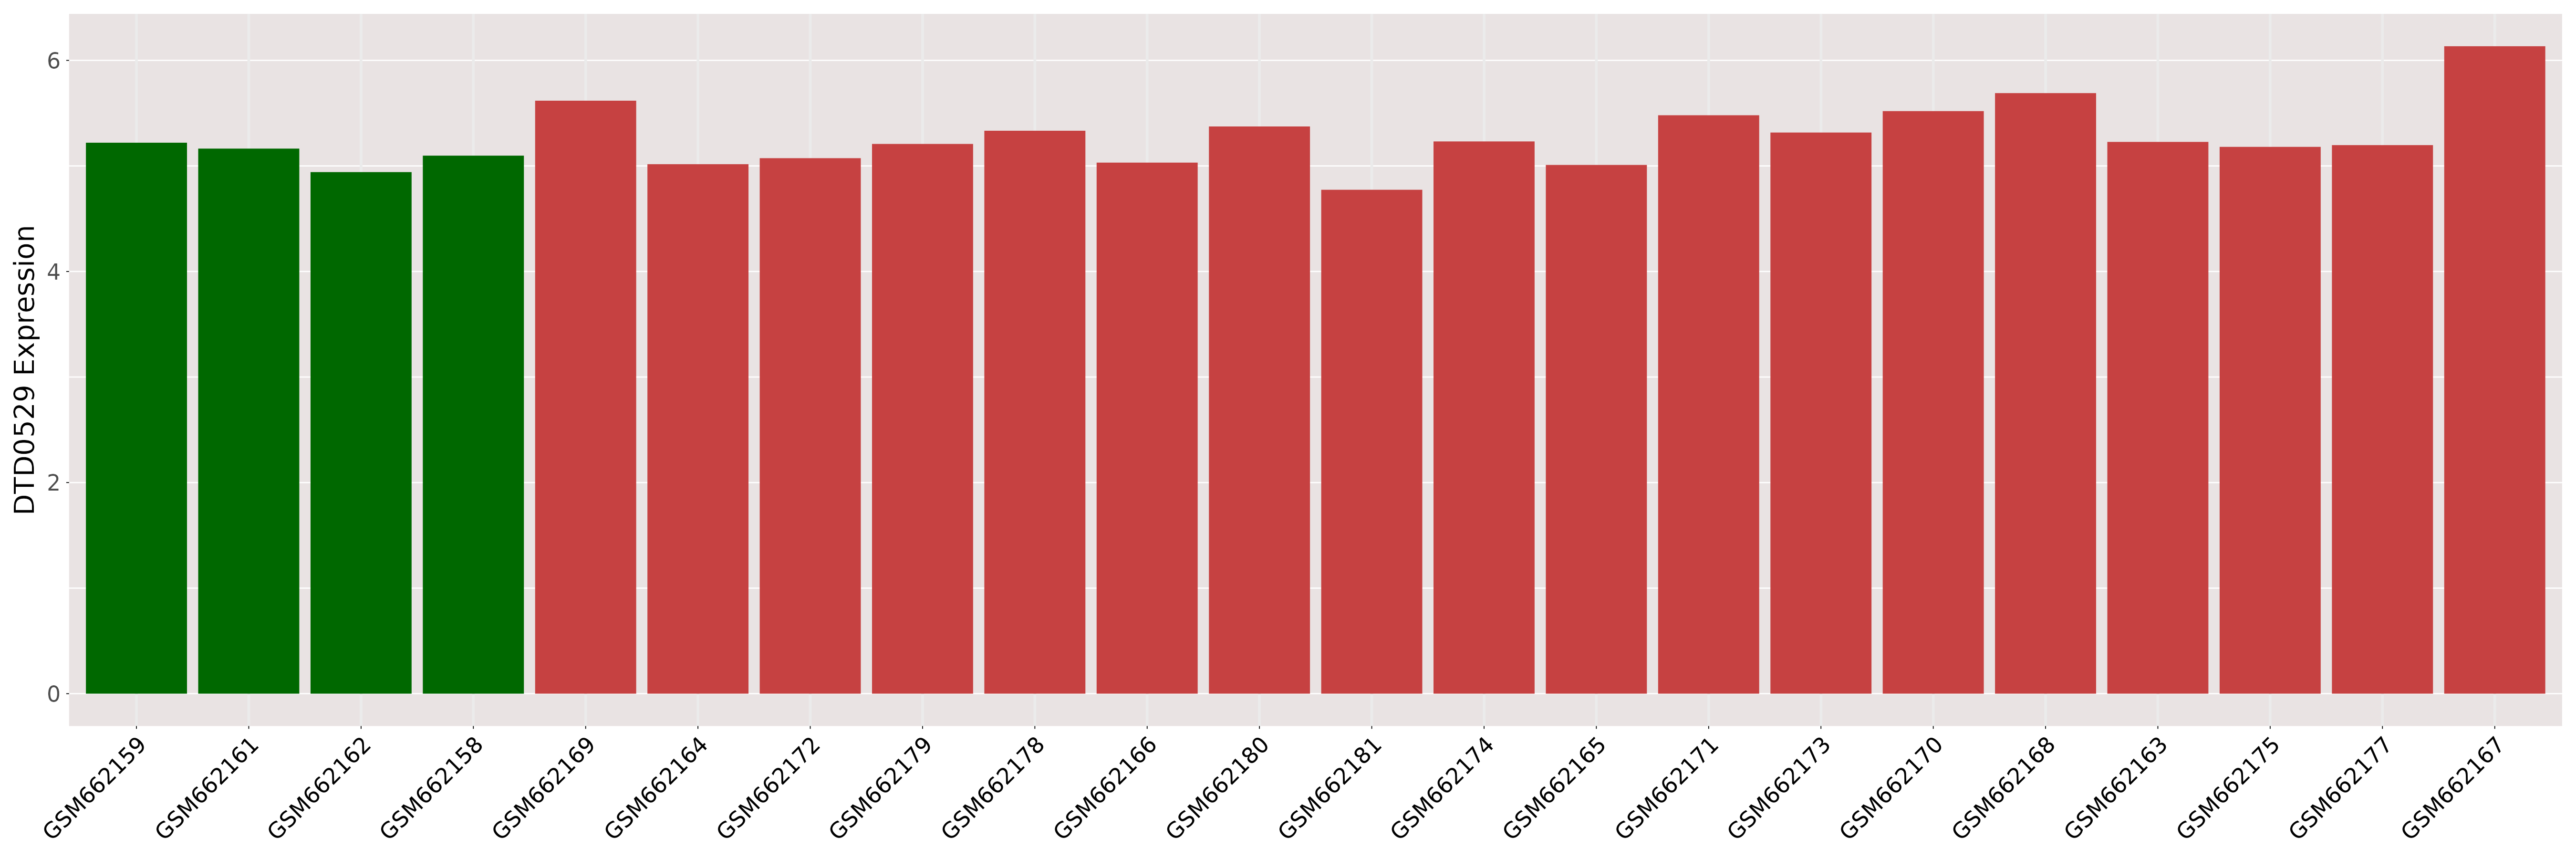
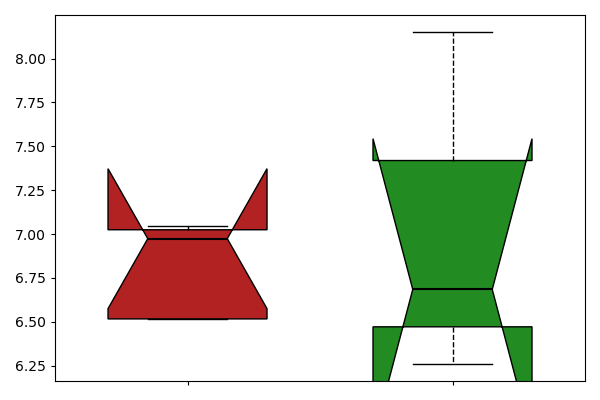
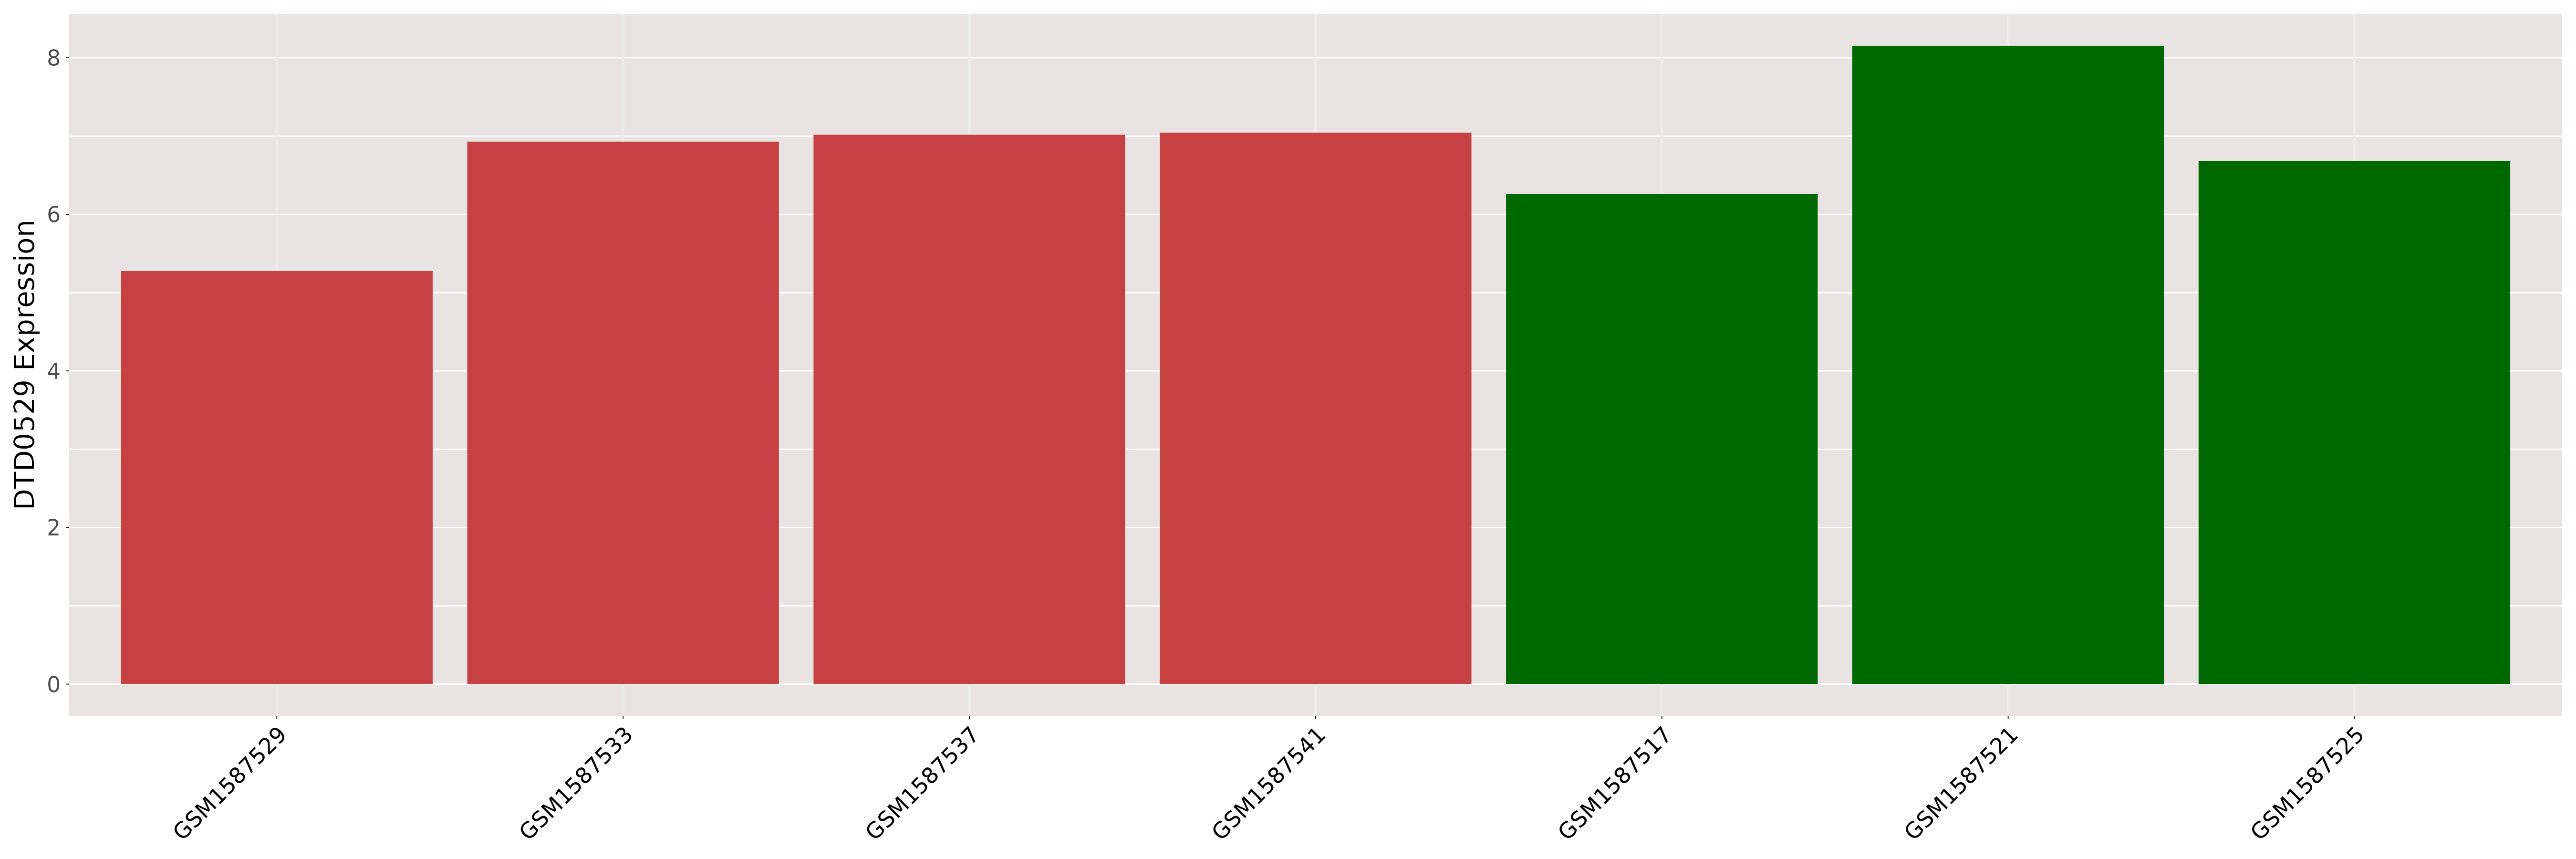
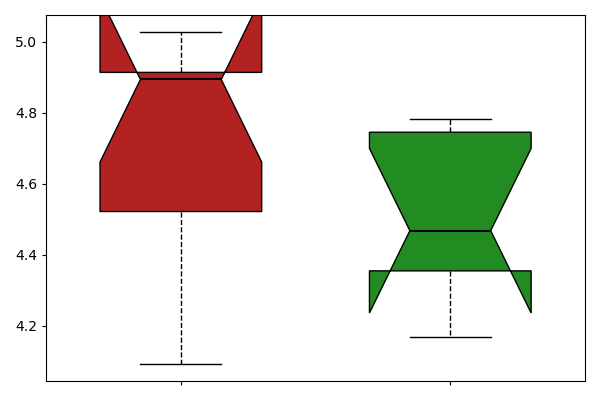
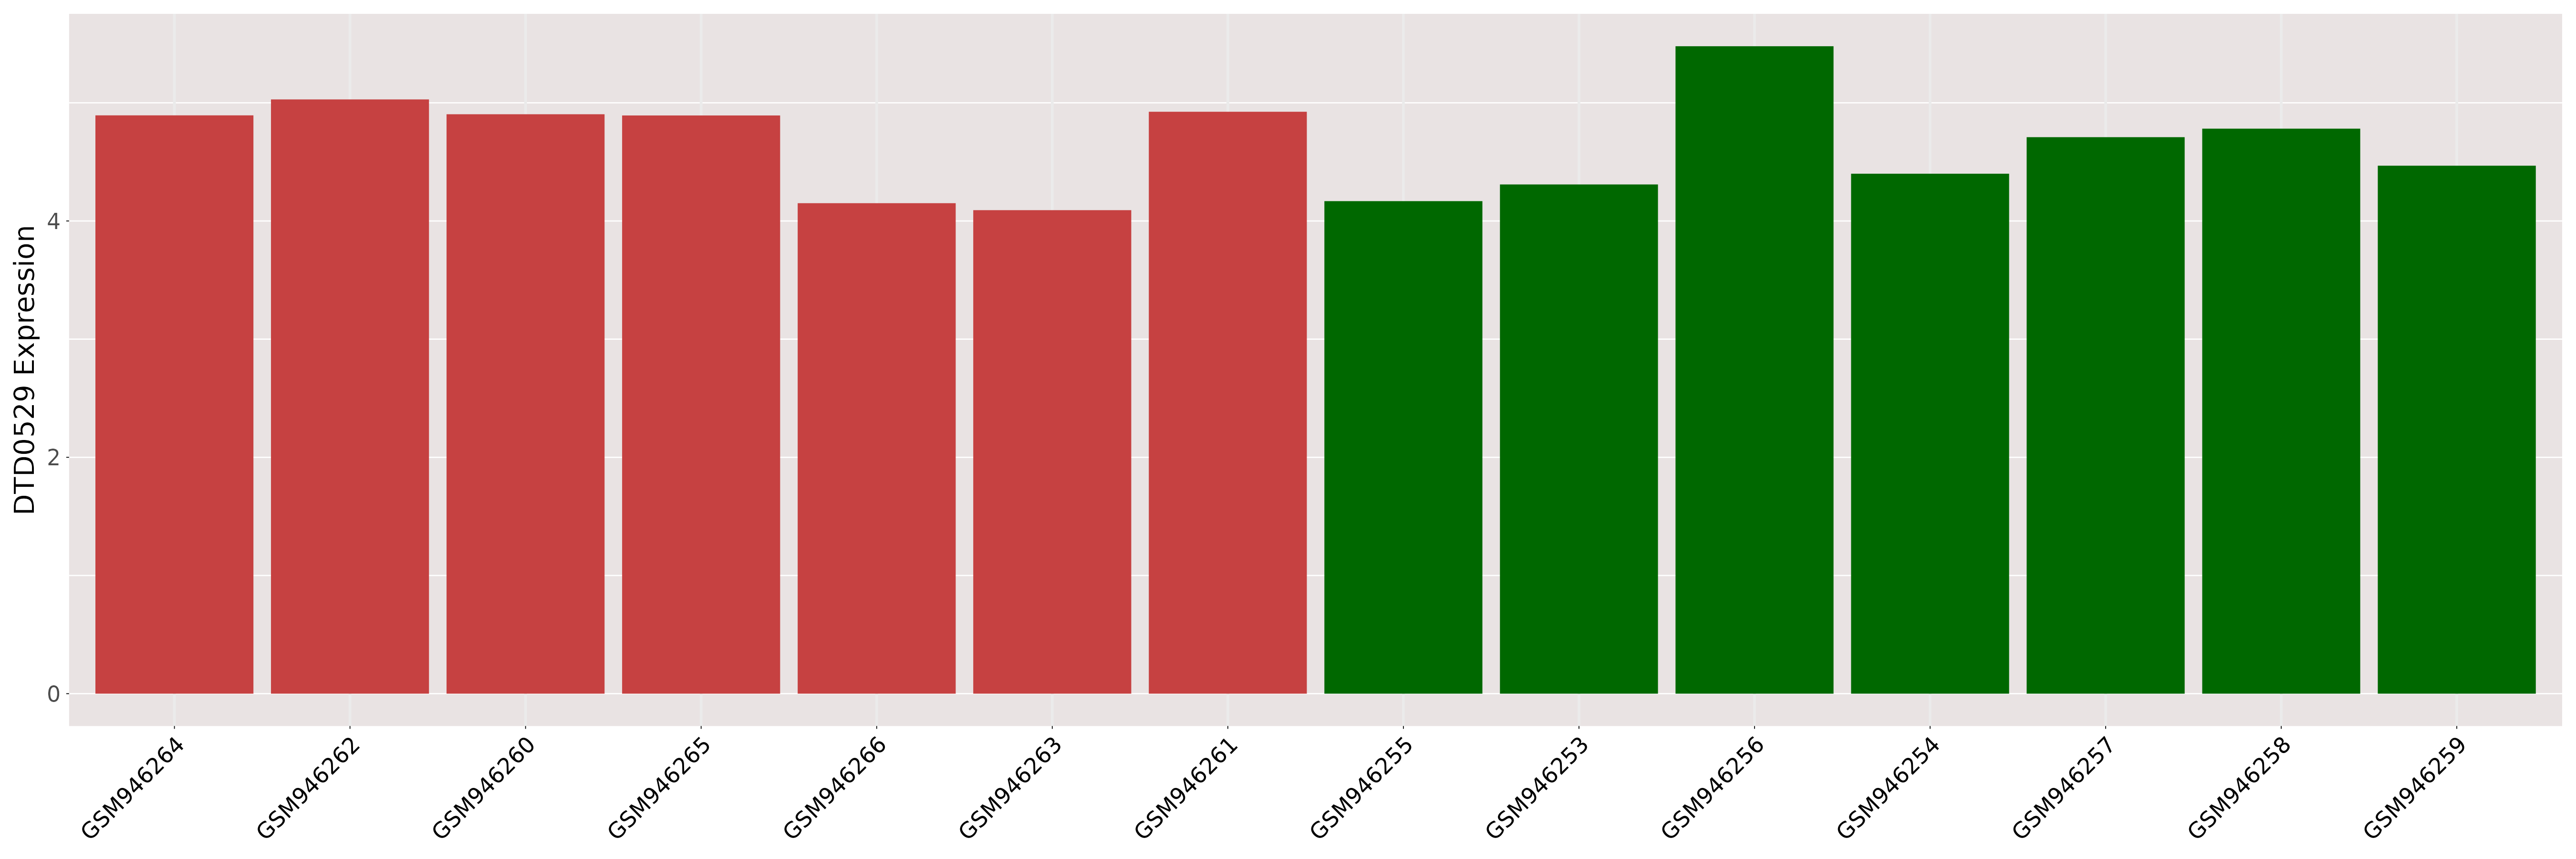
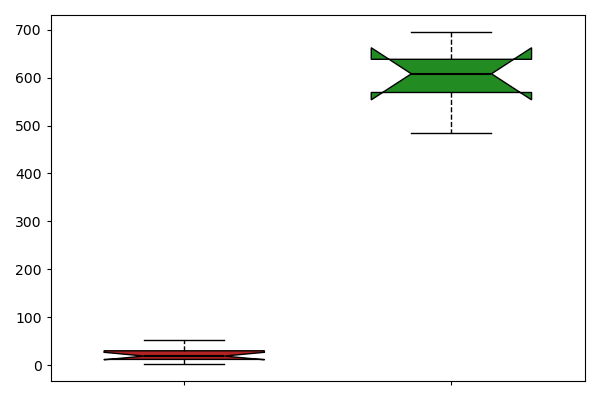
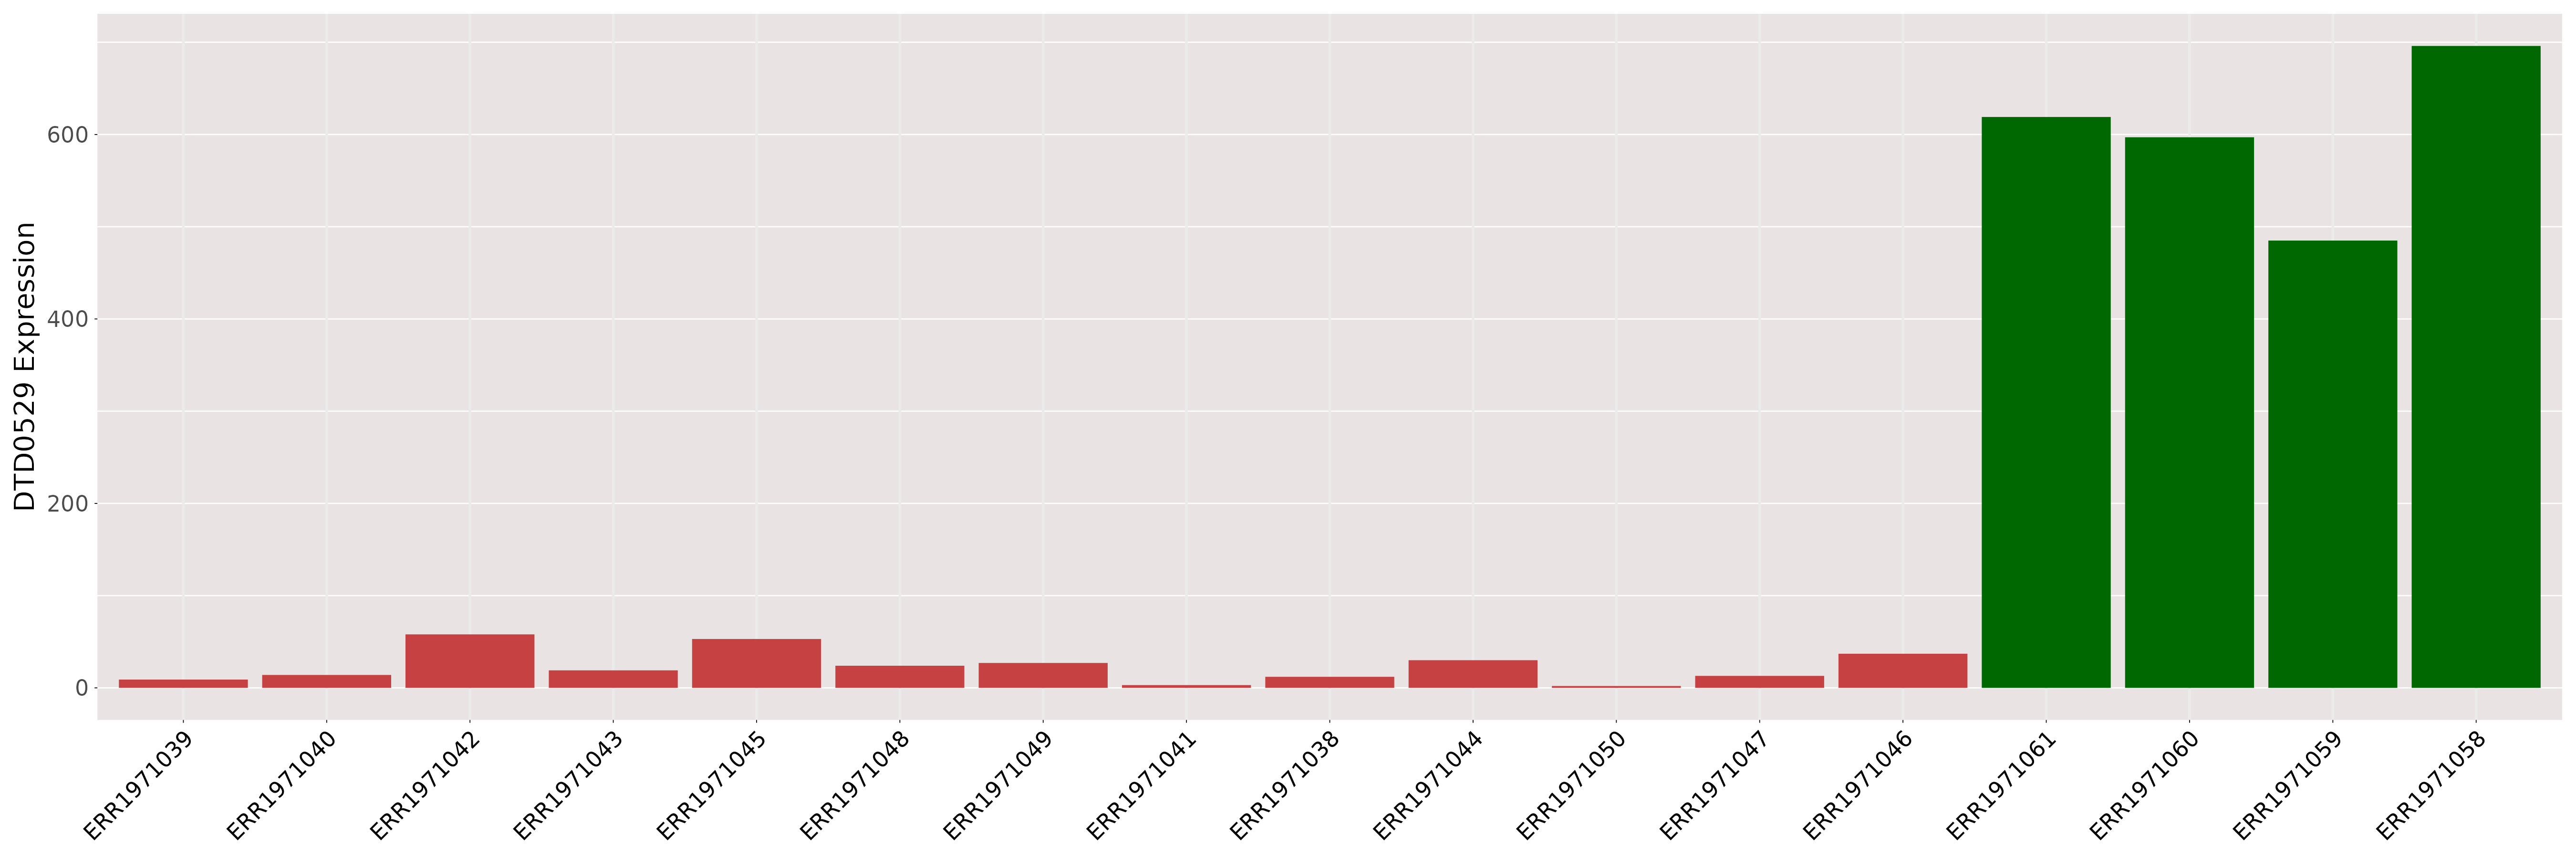
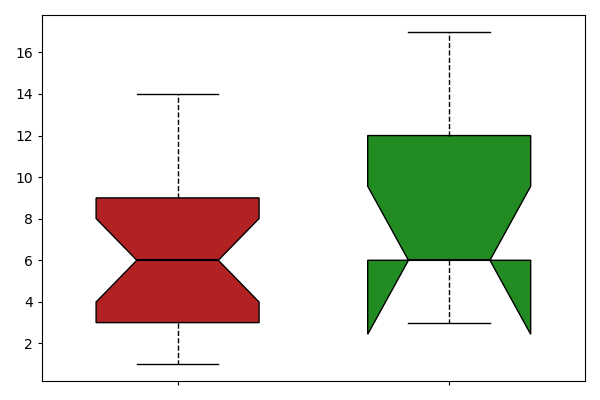
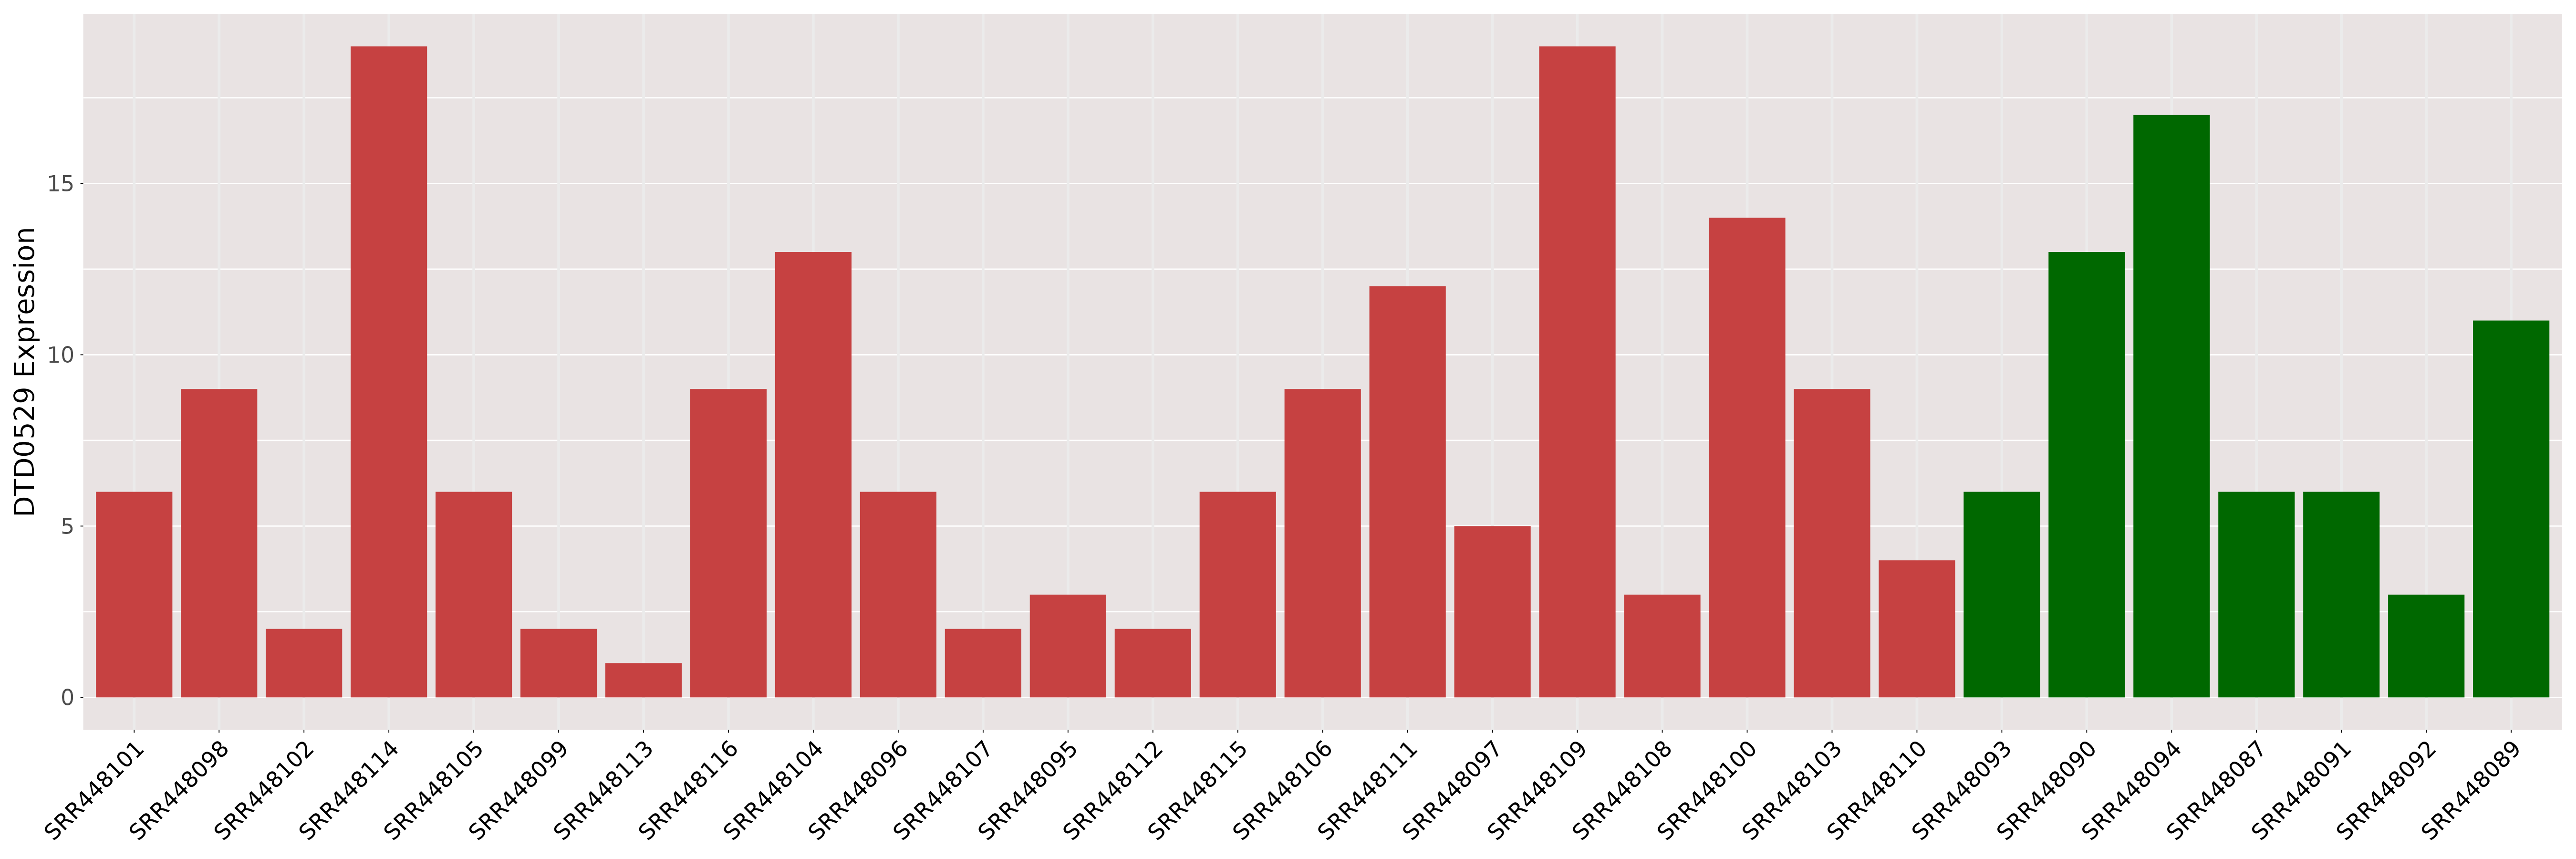
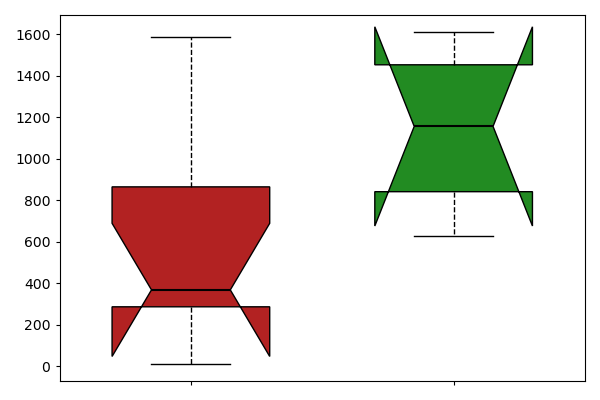
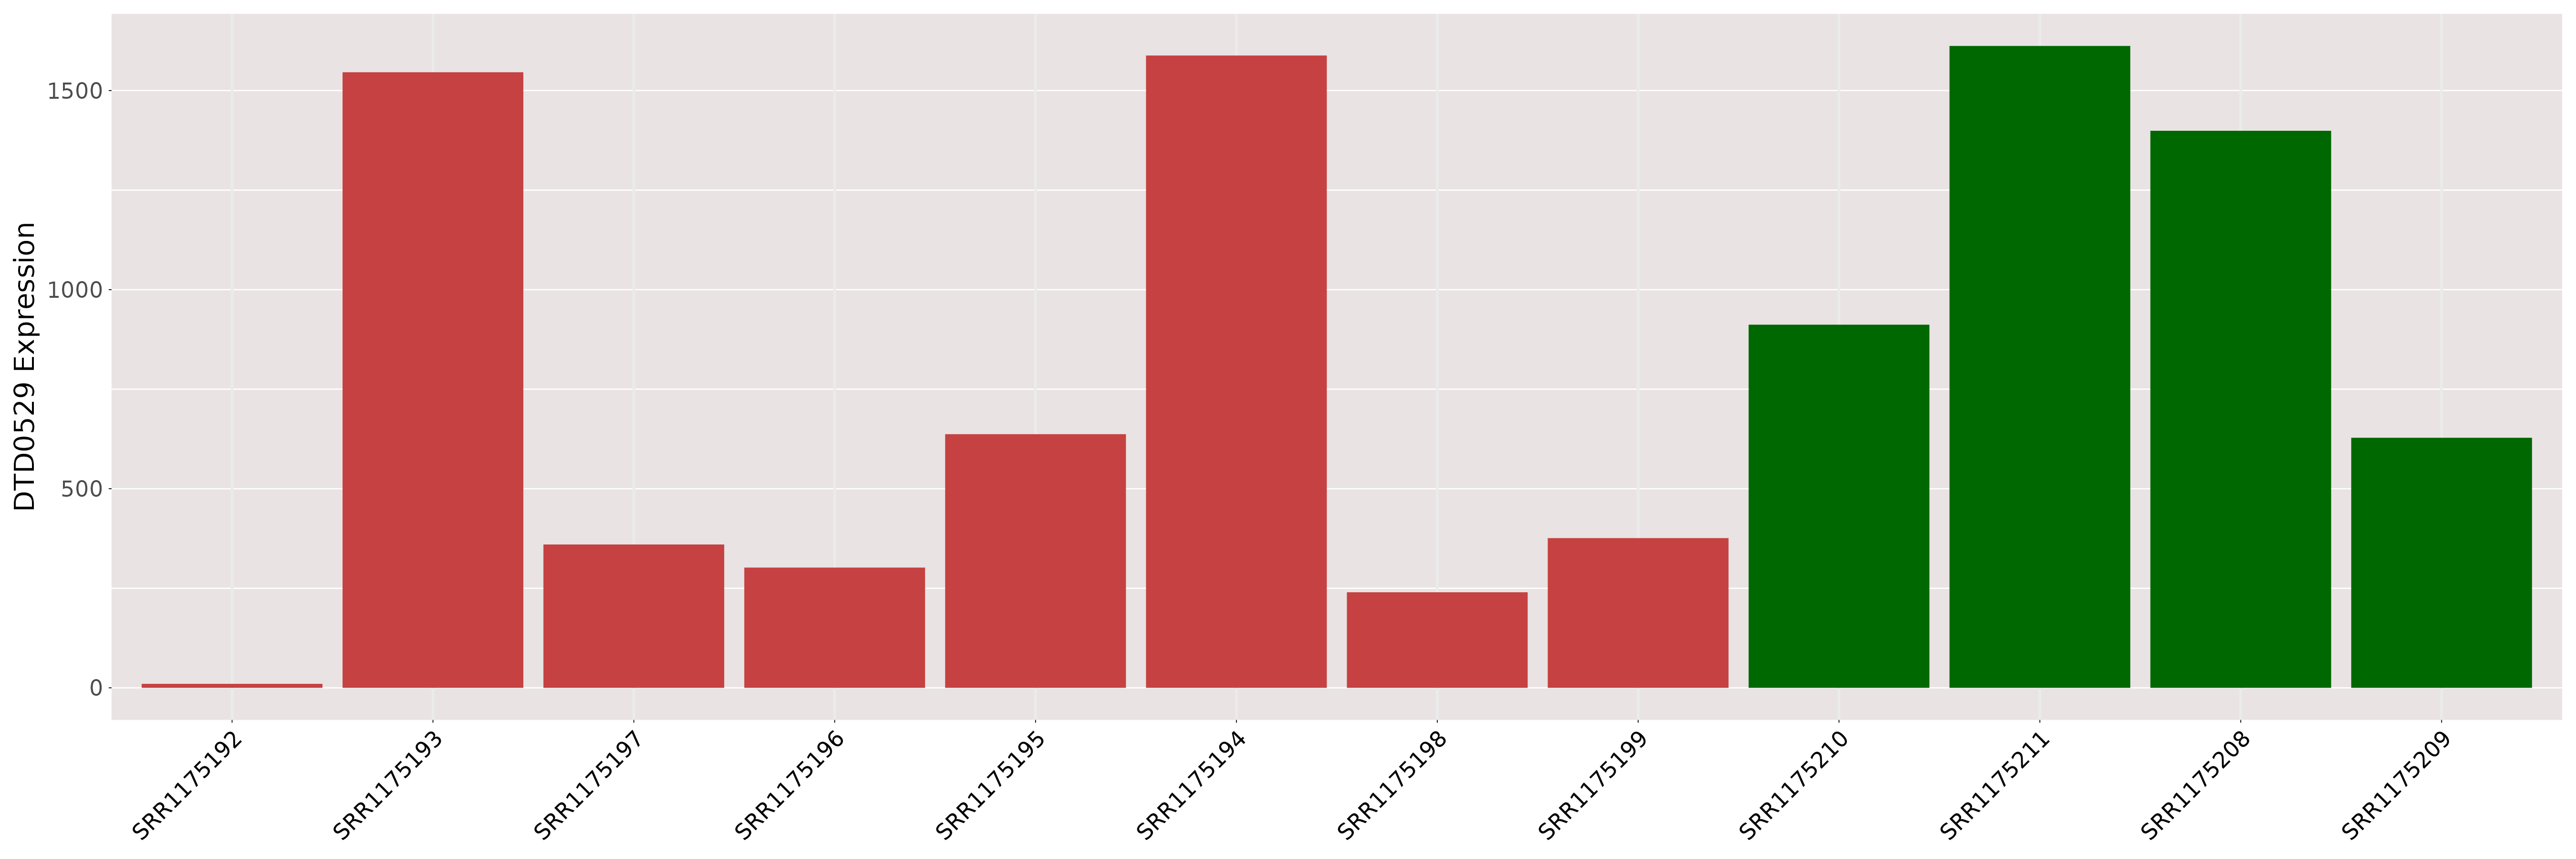
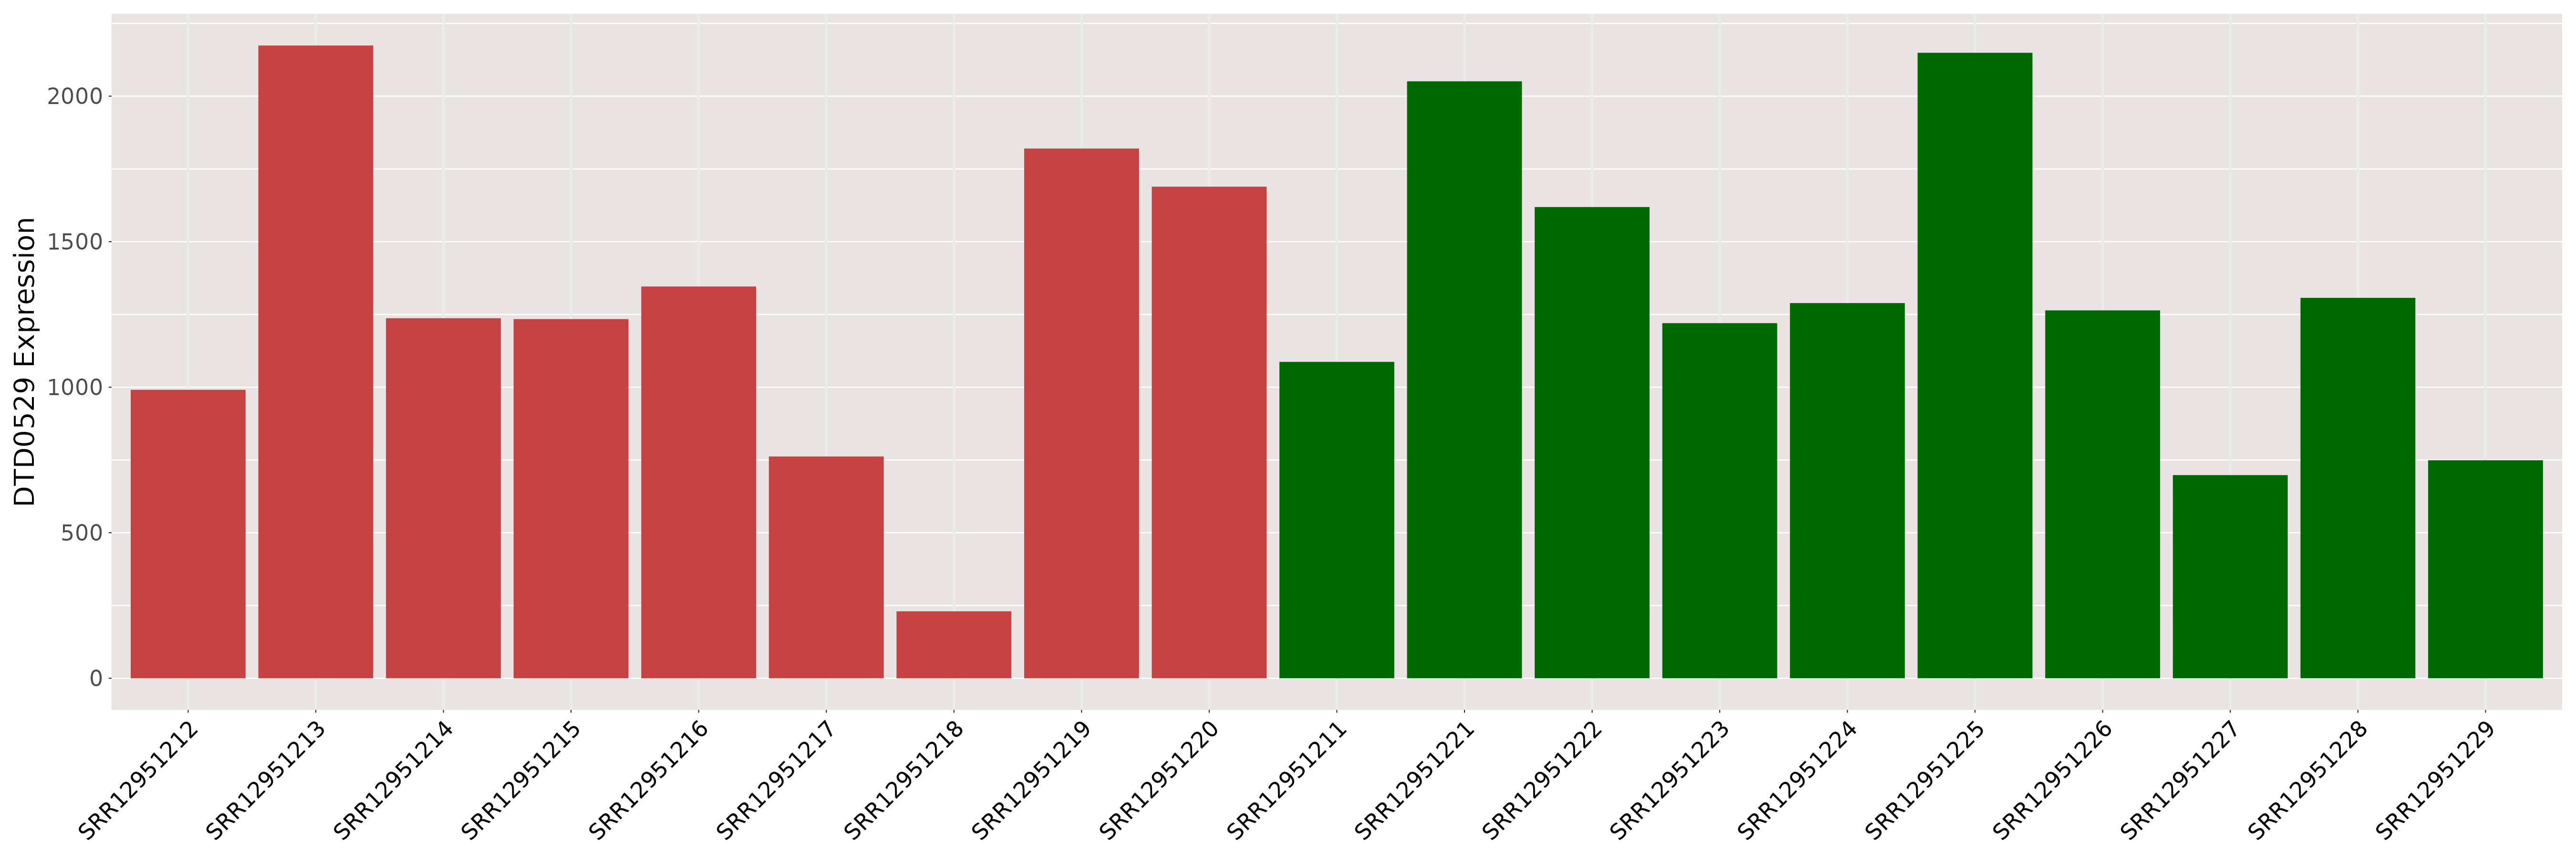
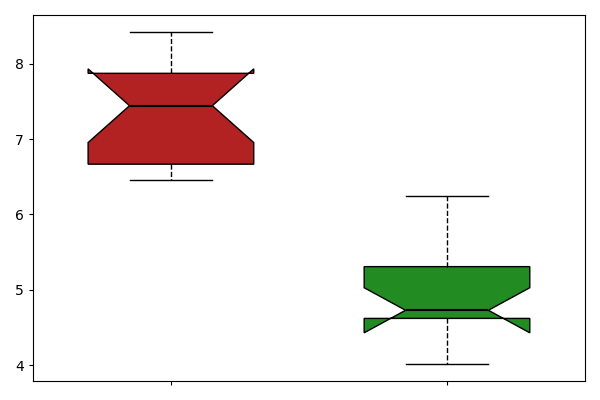
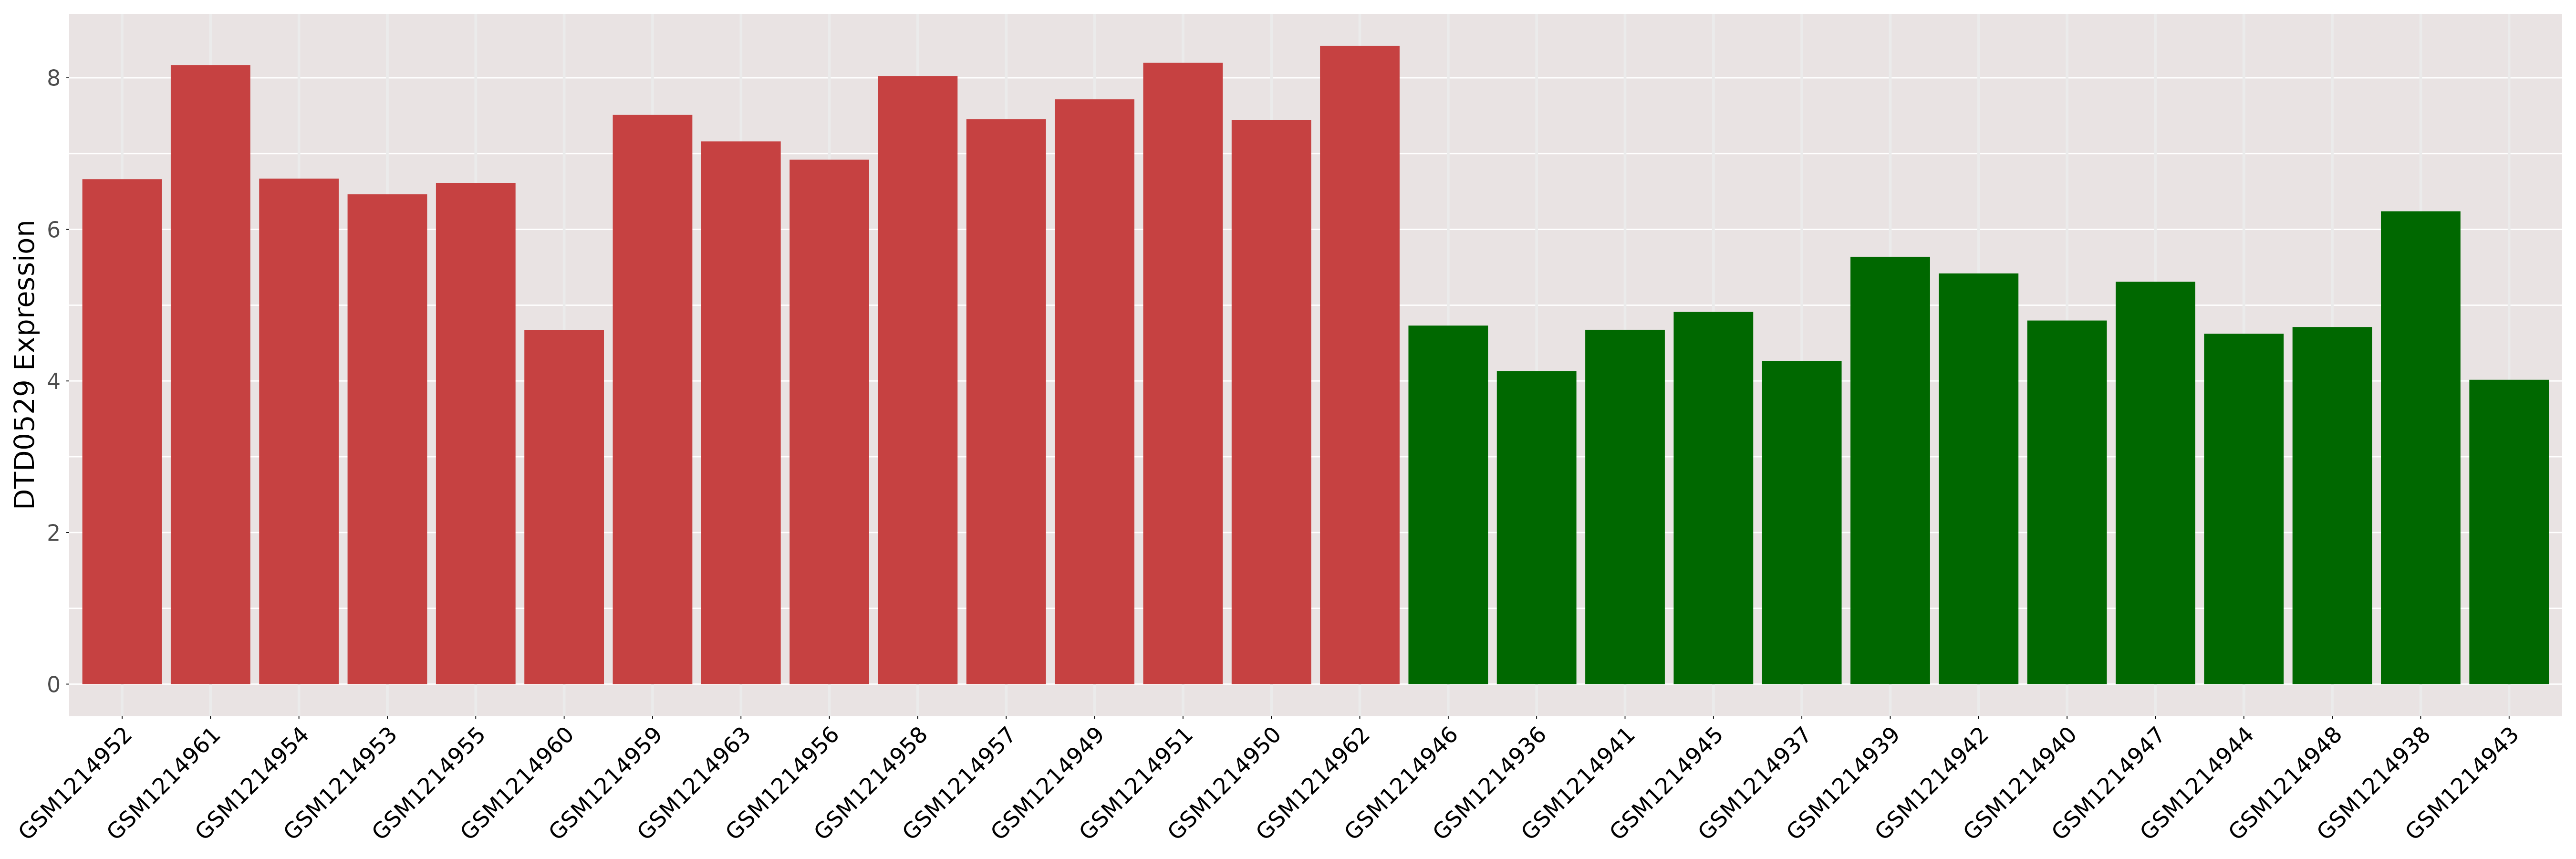
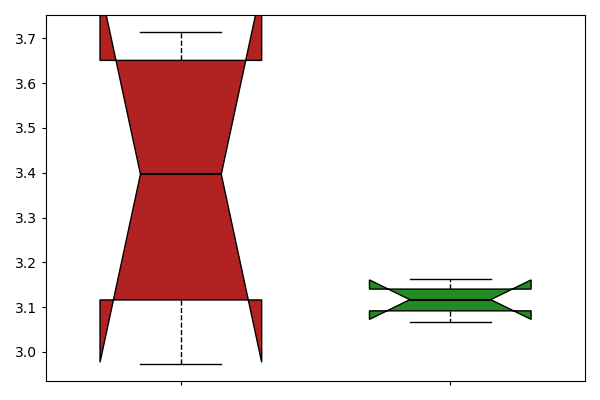
| [+] ICD-11: 1G50.0 Plasmodium falciparum malaria | Click to Show/Hide the Full List | ||||
| The Studied Tissue | Blood | ||||
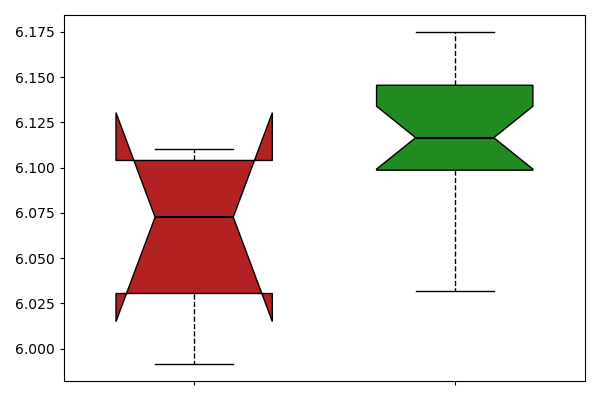
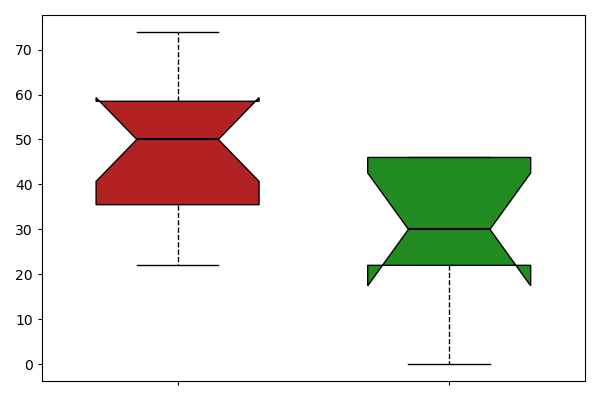
| The Specified Disease | Plasmodium falciparum malaria [ICD-11:1G50.0] | ||||
| The Expression Level of Disease Section Compare with the Healthy Individual Tissue | p-value:0.0213498274070324; Fold-change:0.9580685754055556; Z-score:-0.705436668 | ||||
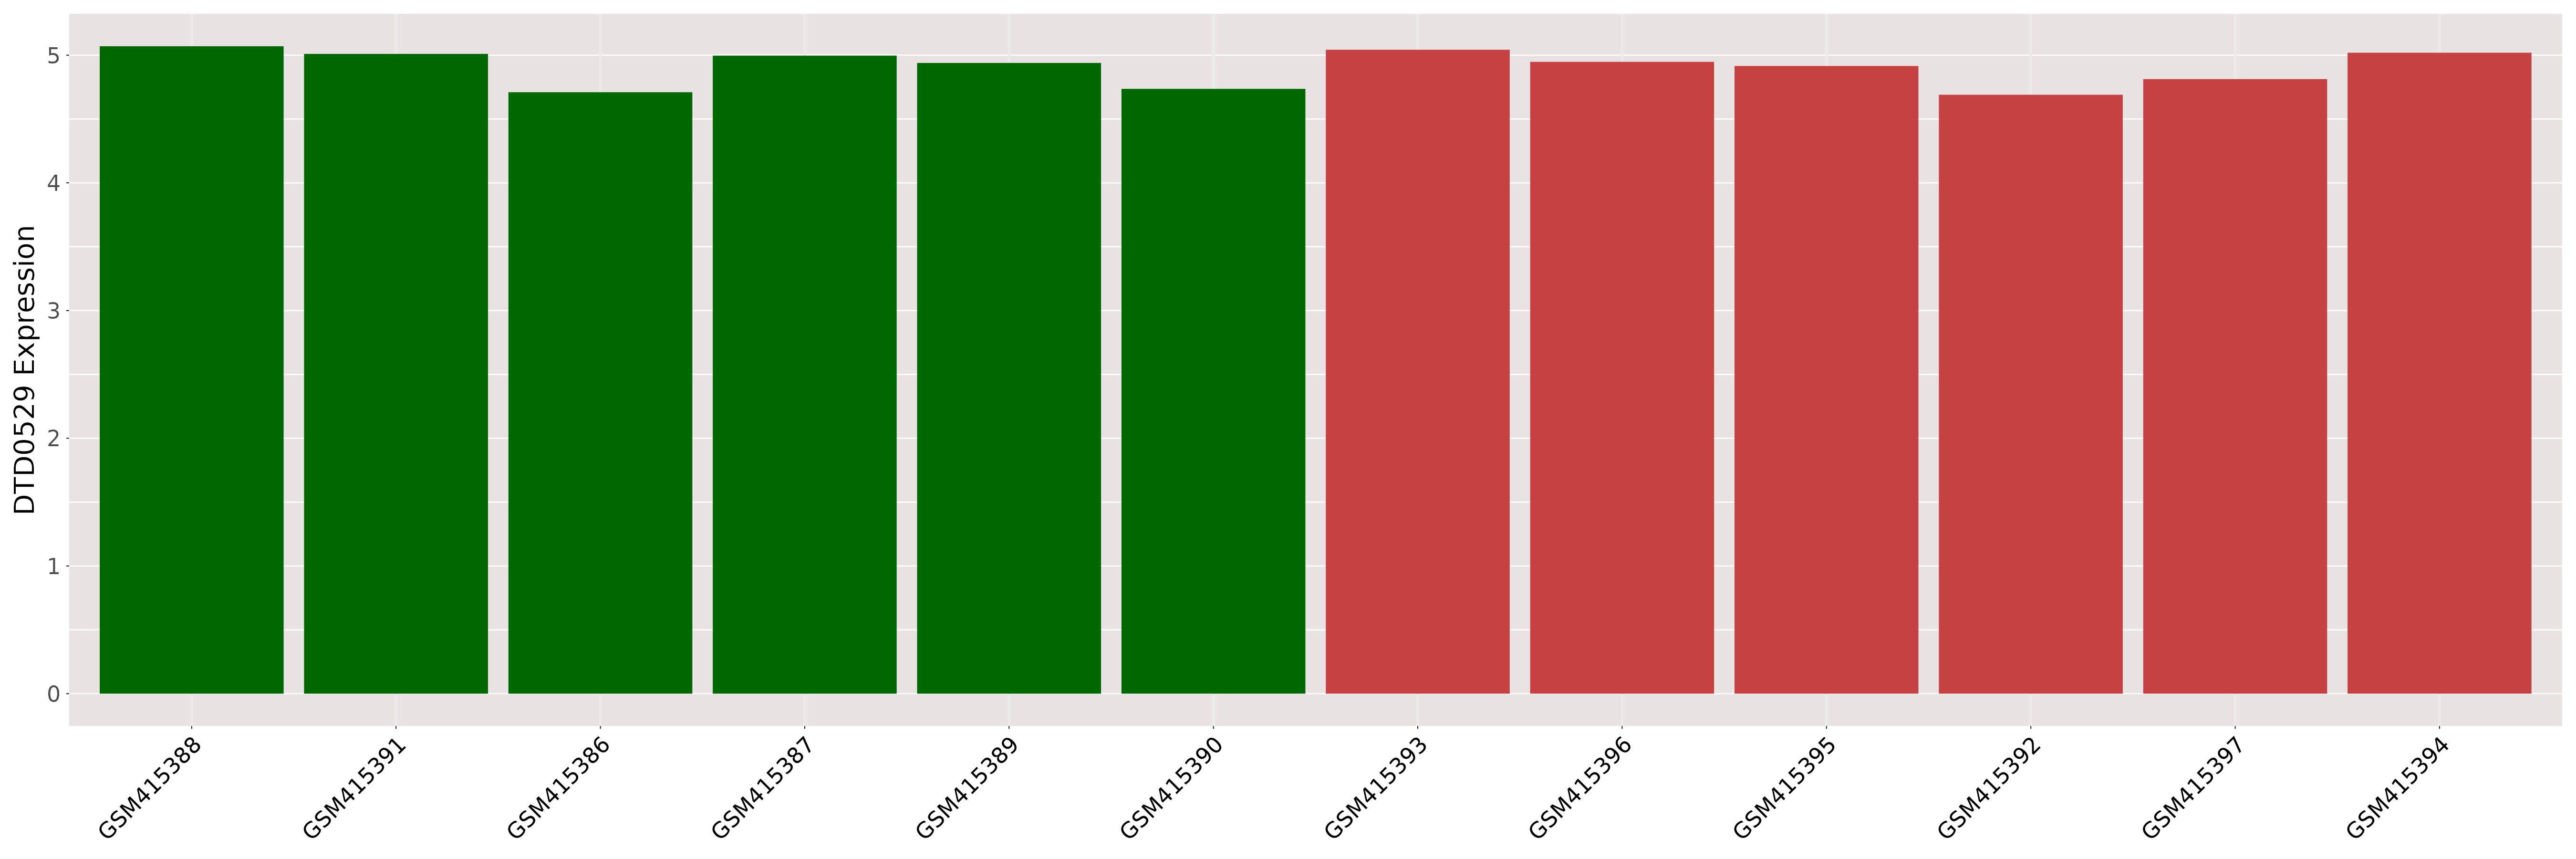
| DT expression in the diseased tissue of patients
DT expression in the normal tissue of healthy individuals
|
|||||
|
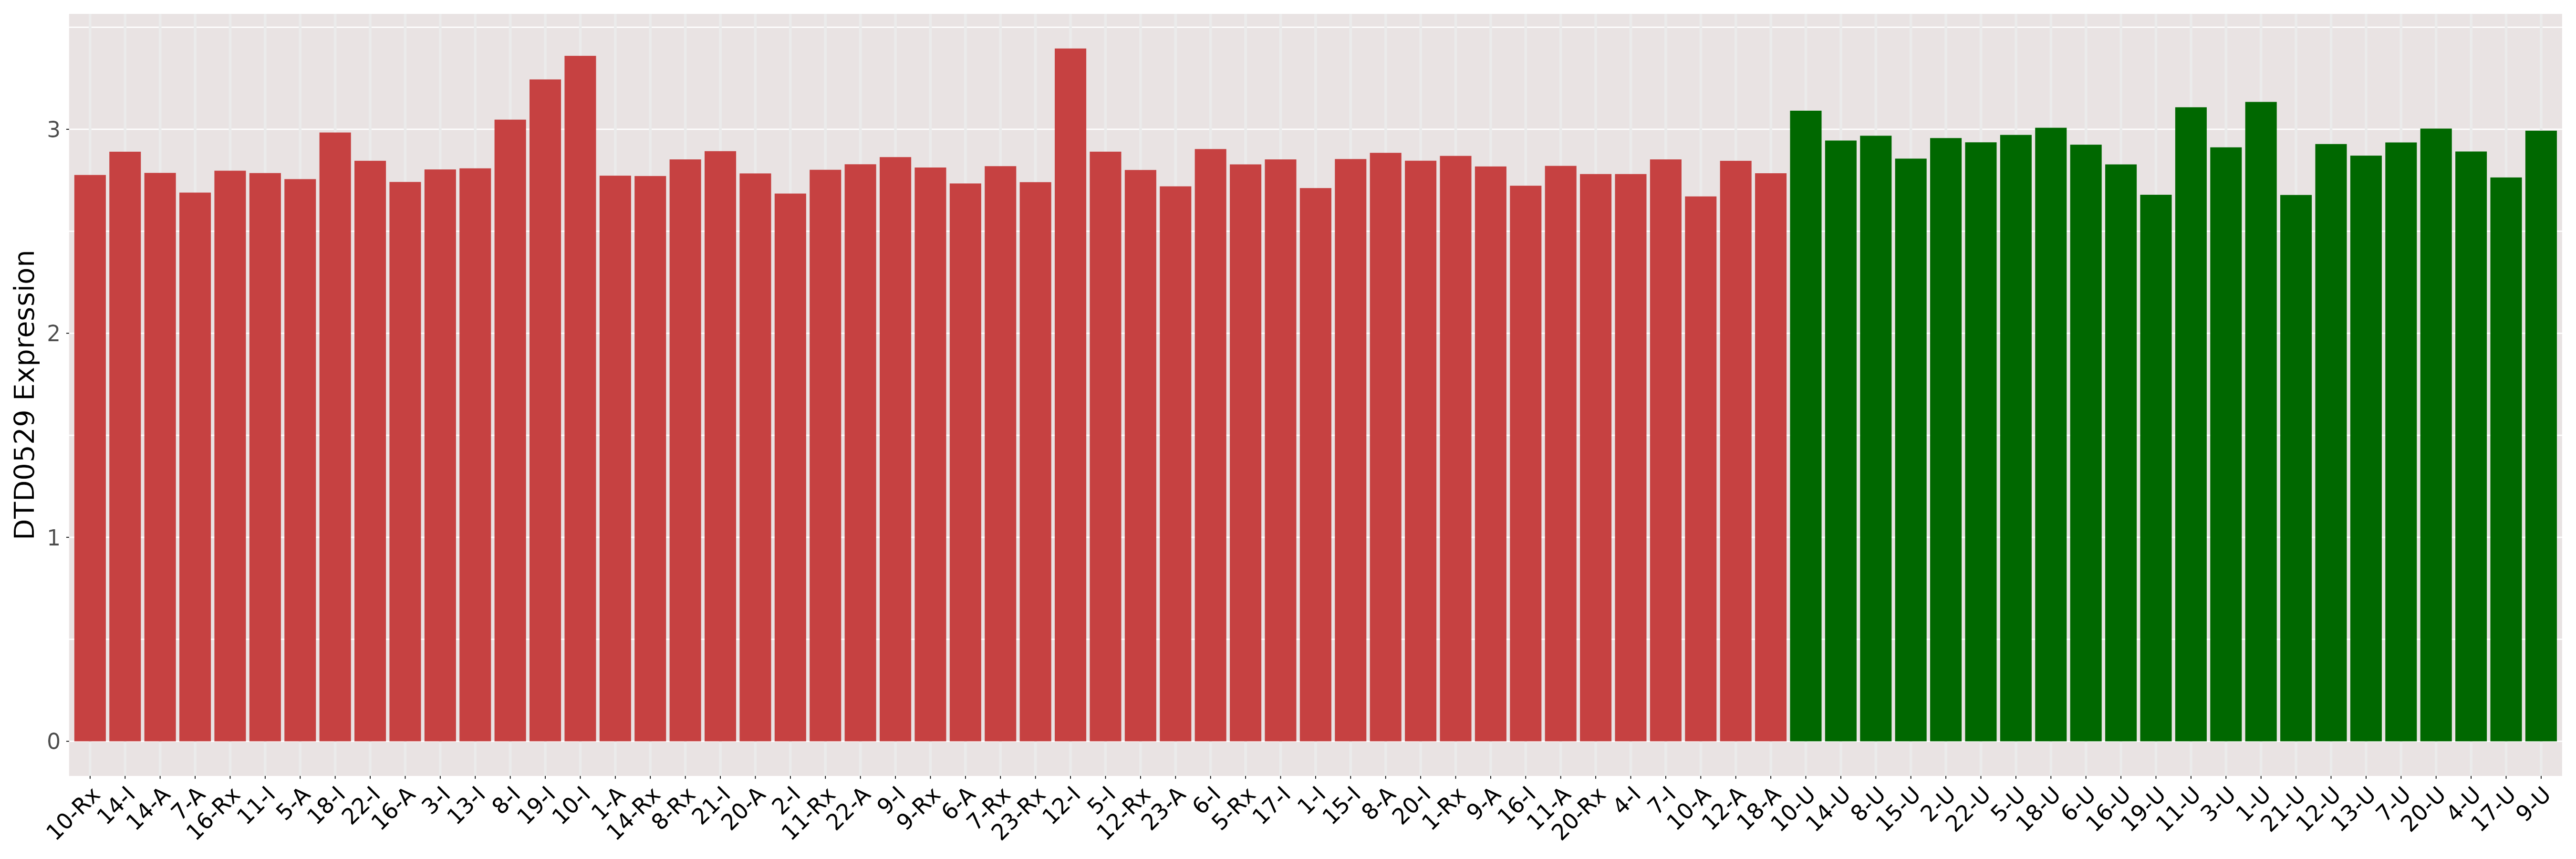 Please Click the above Thumbnail to View/Download
the Expression Barchart for All Samples Please Click the above Thumbnail to View/Download
the Expression Barchart for All Samples
|
||||
| ICD-11: 02 Neoplasm | |||||
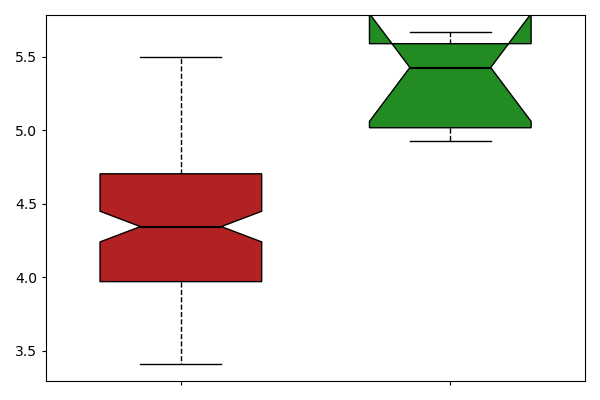
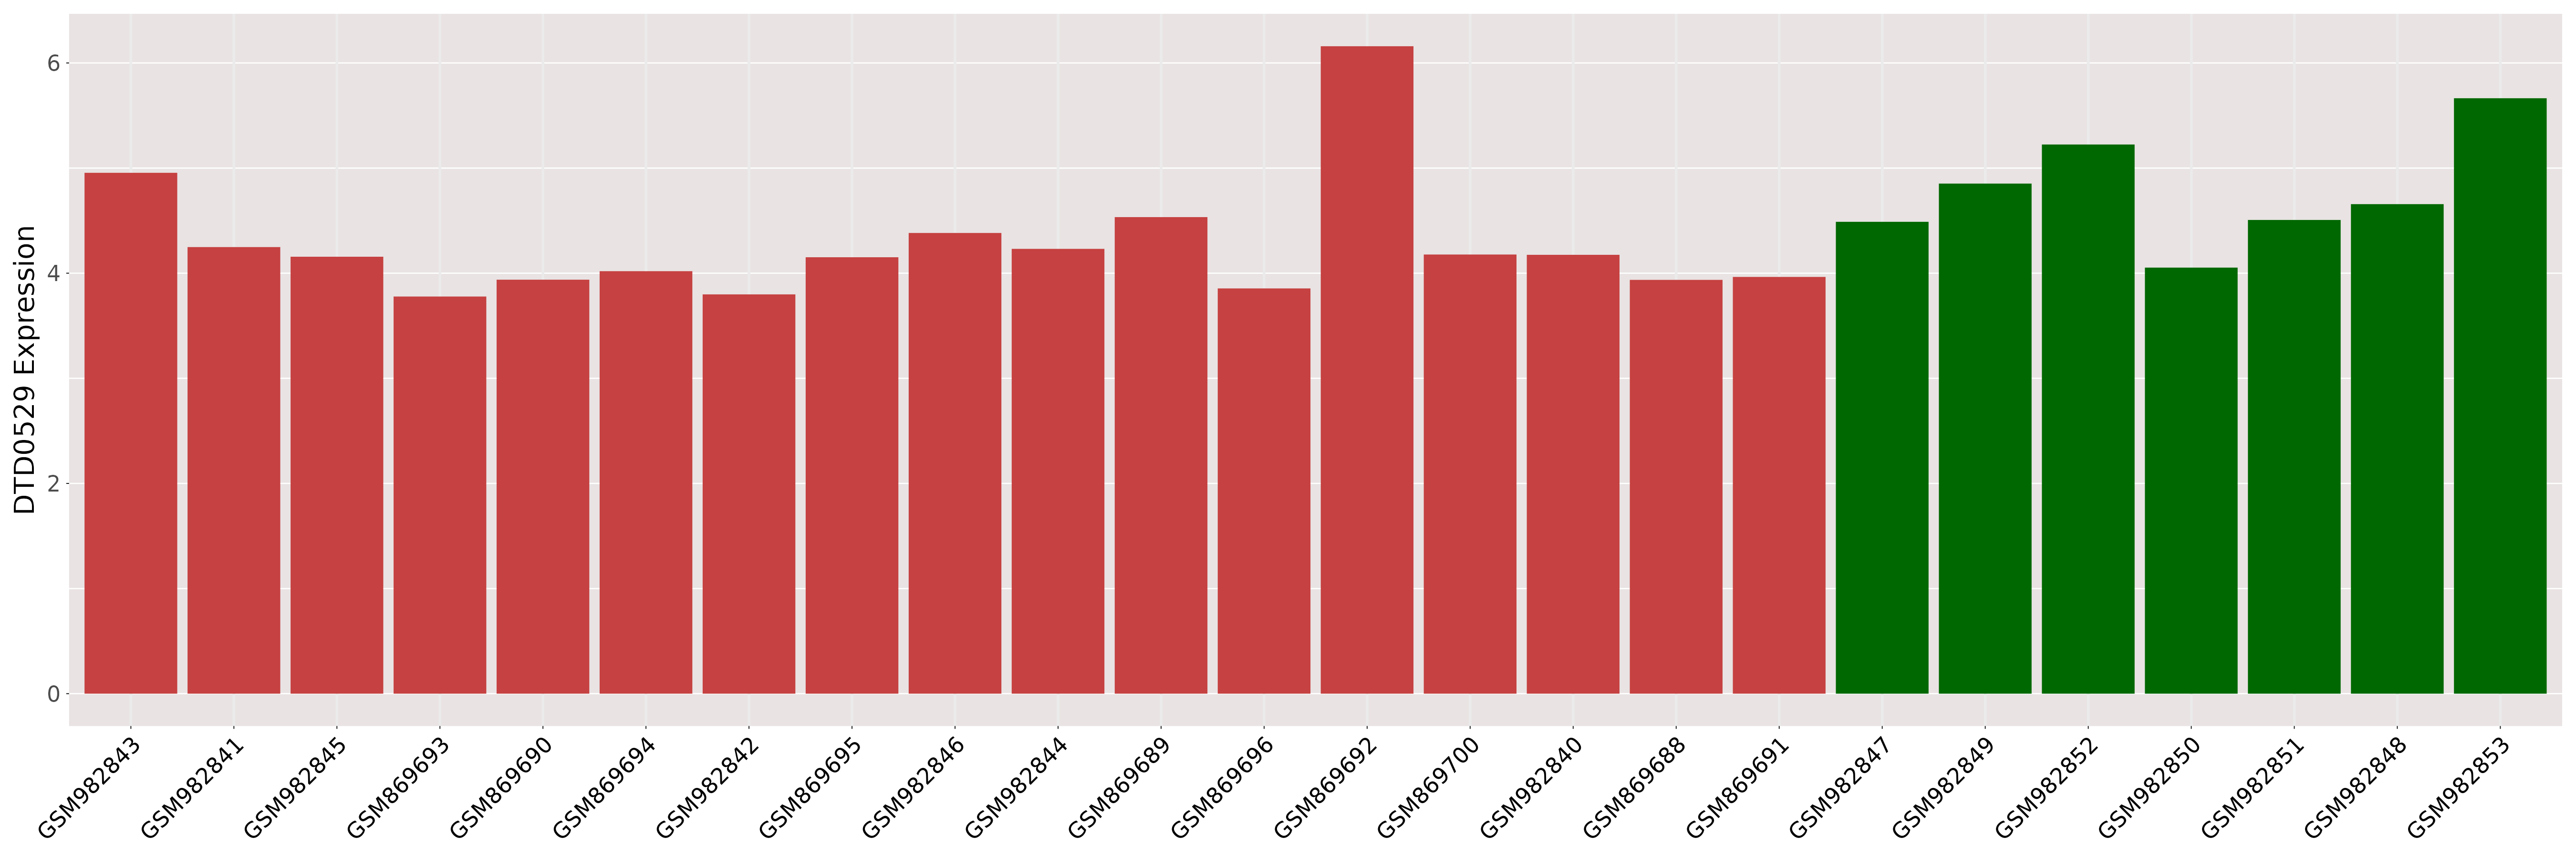
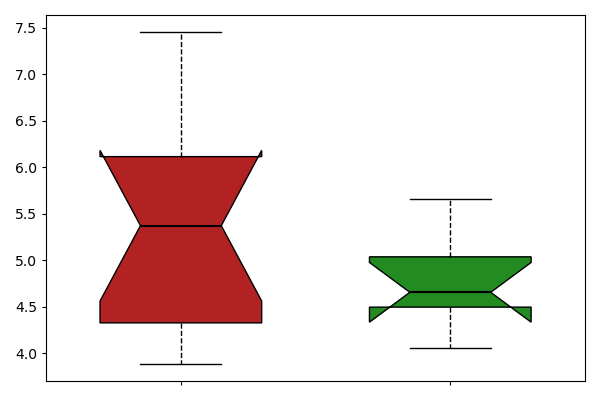
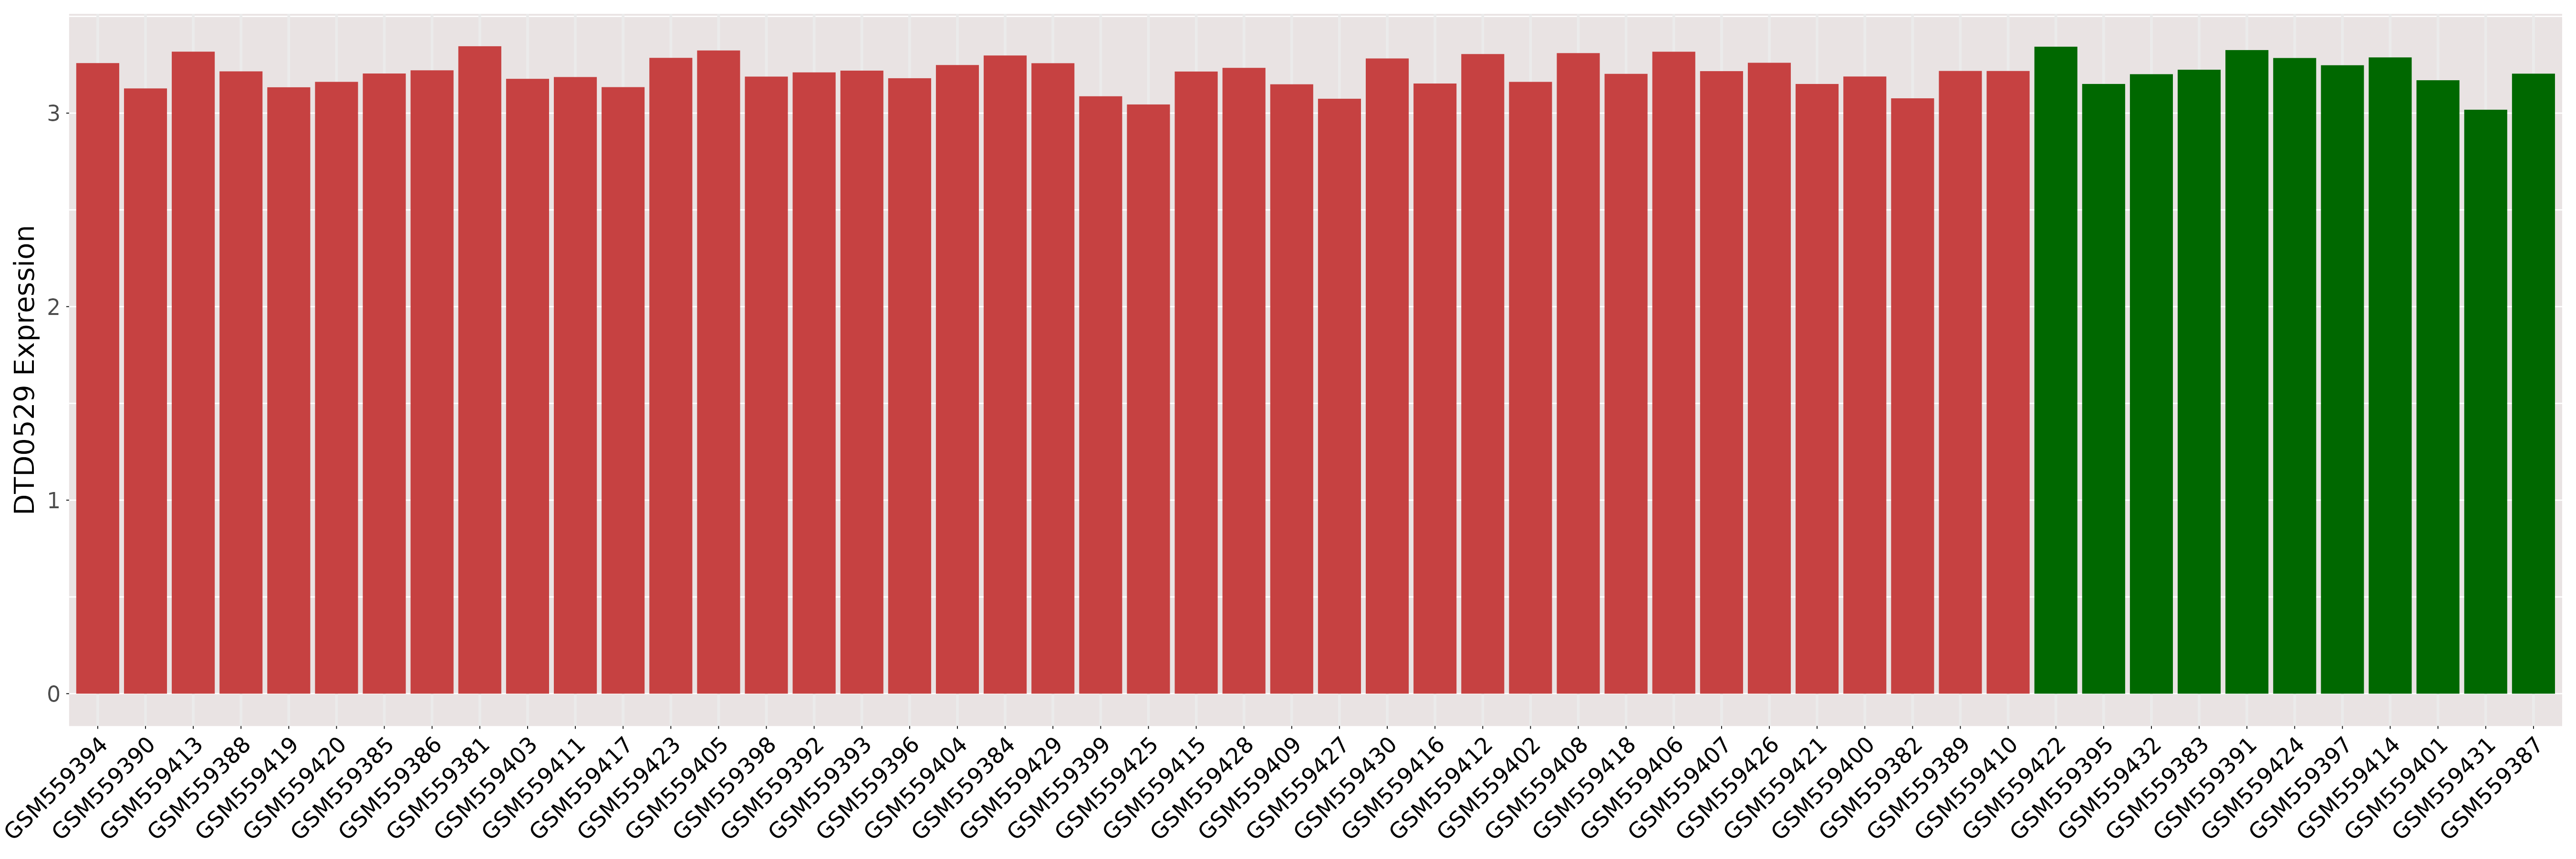
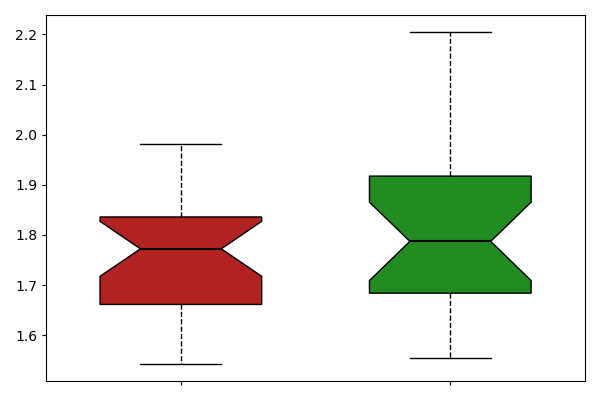
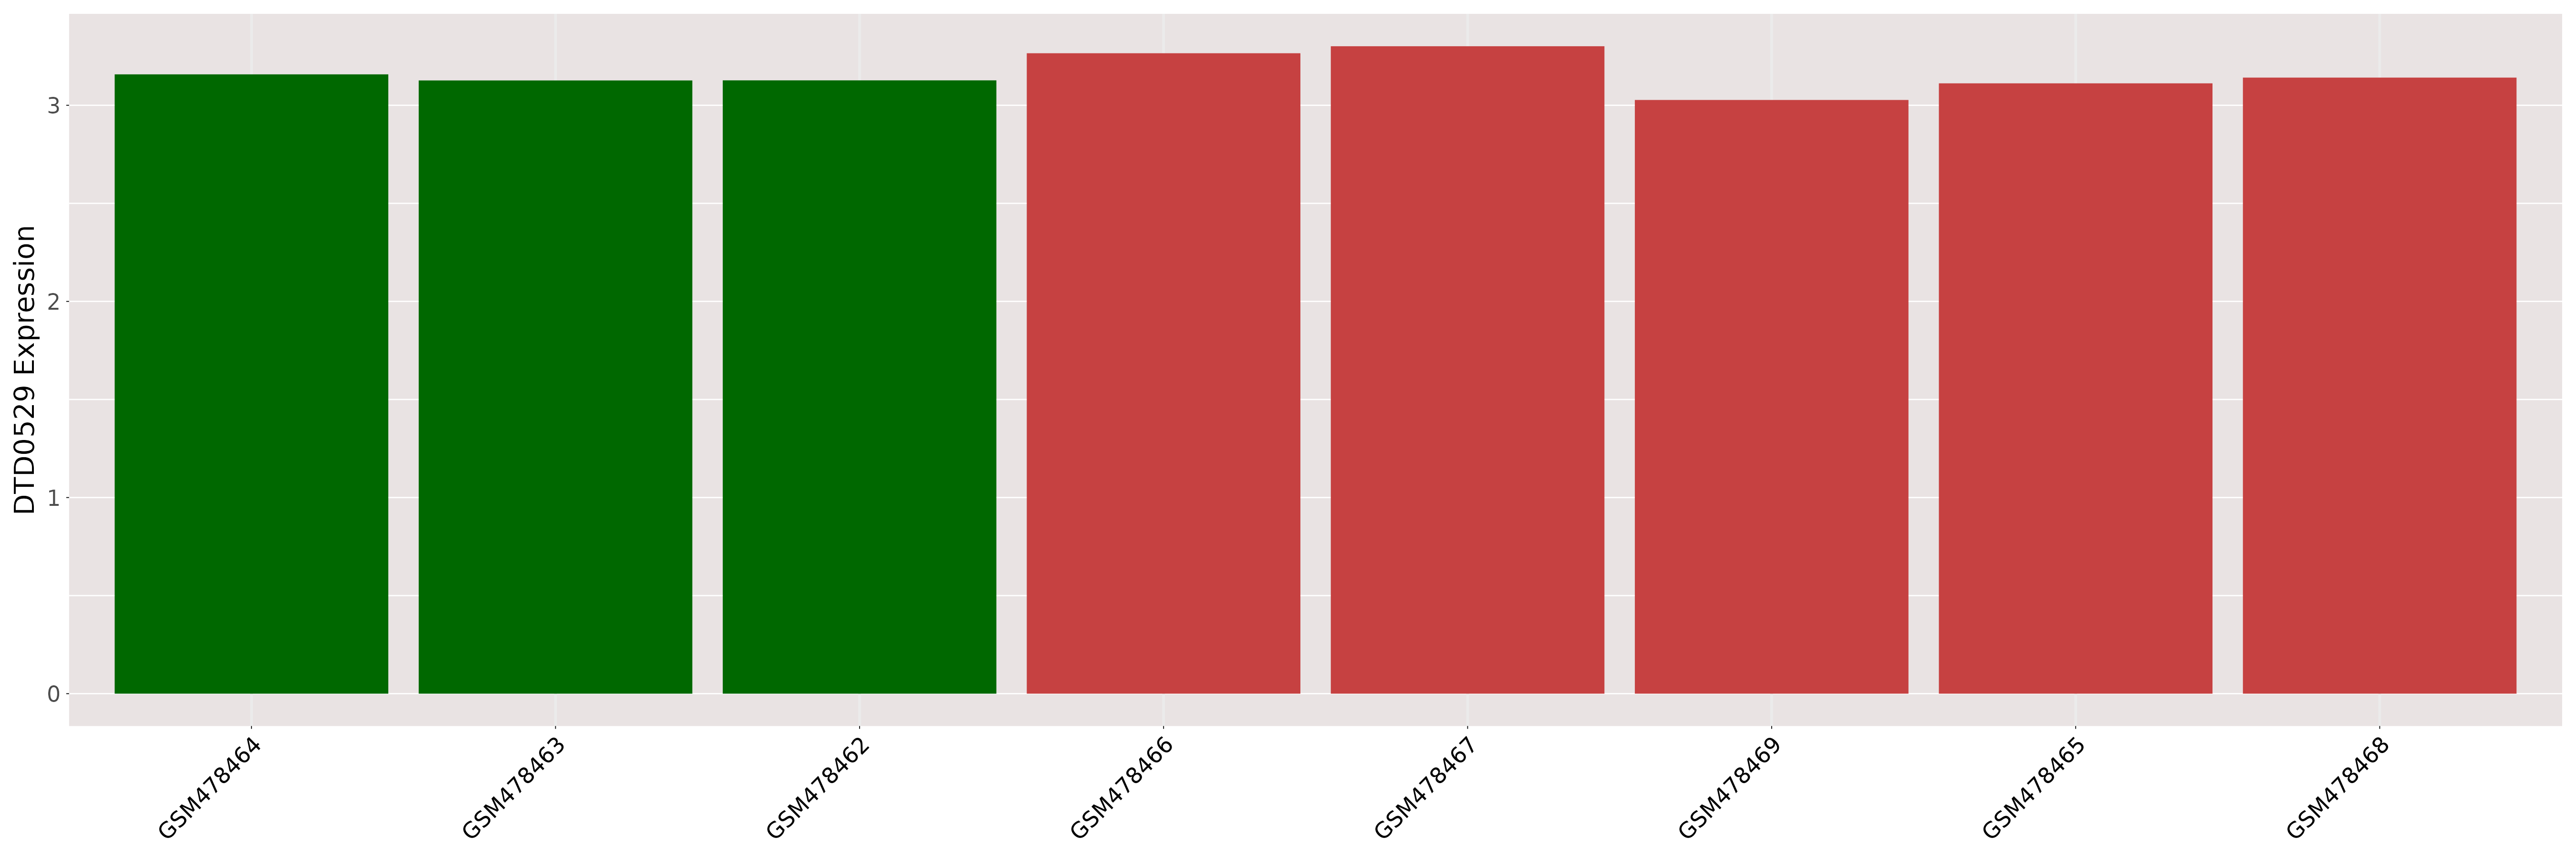
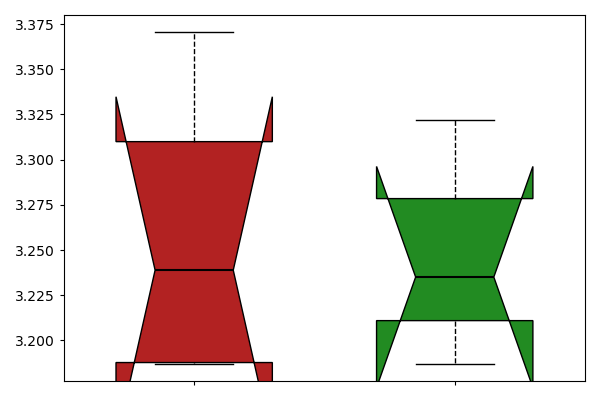
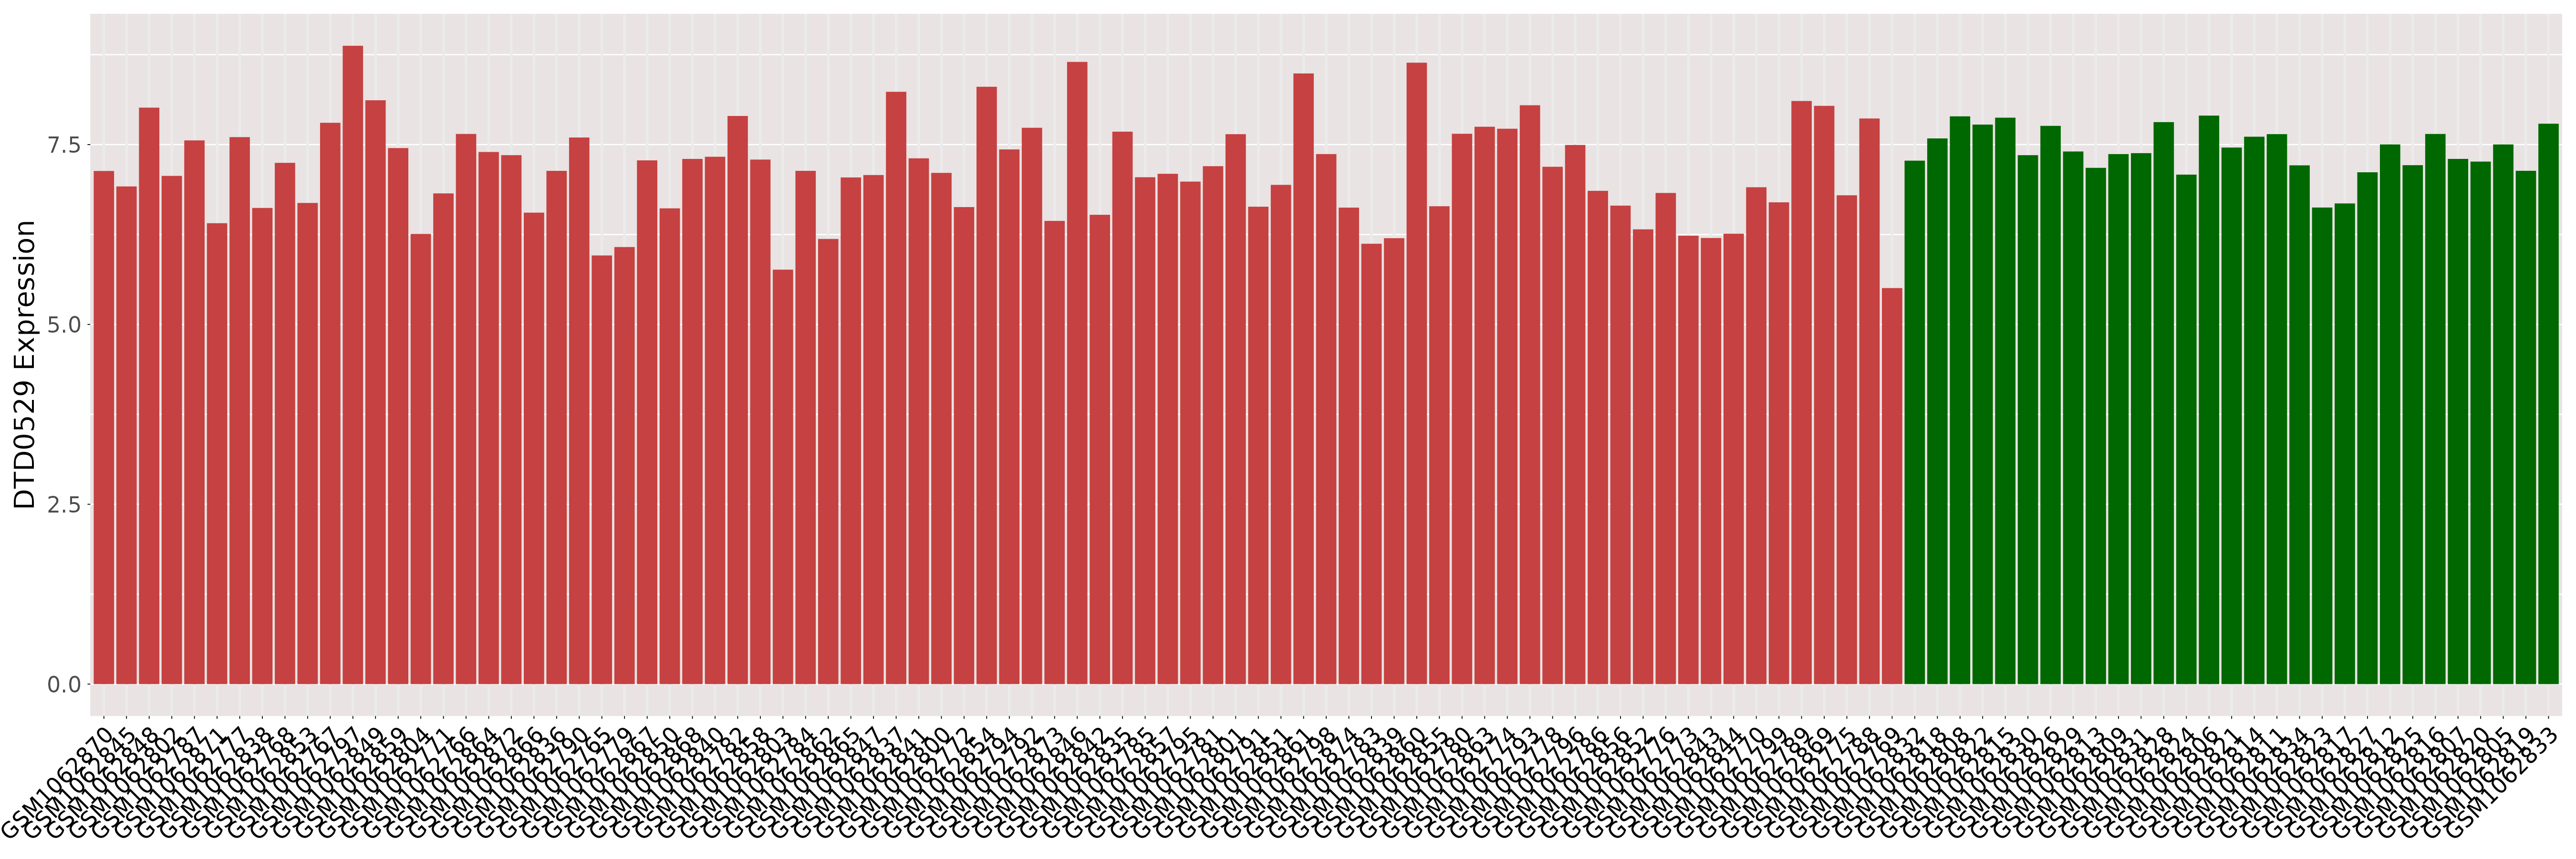
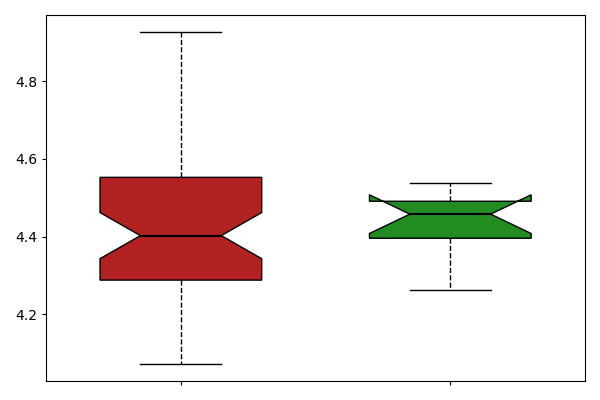
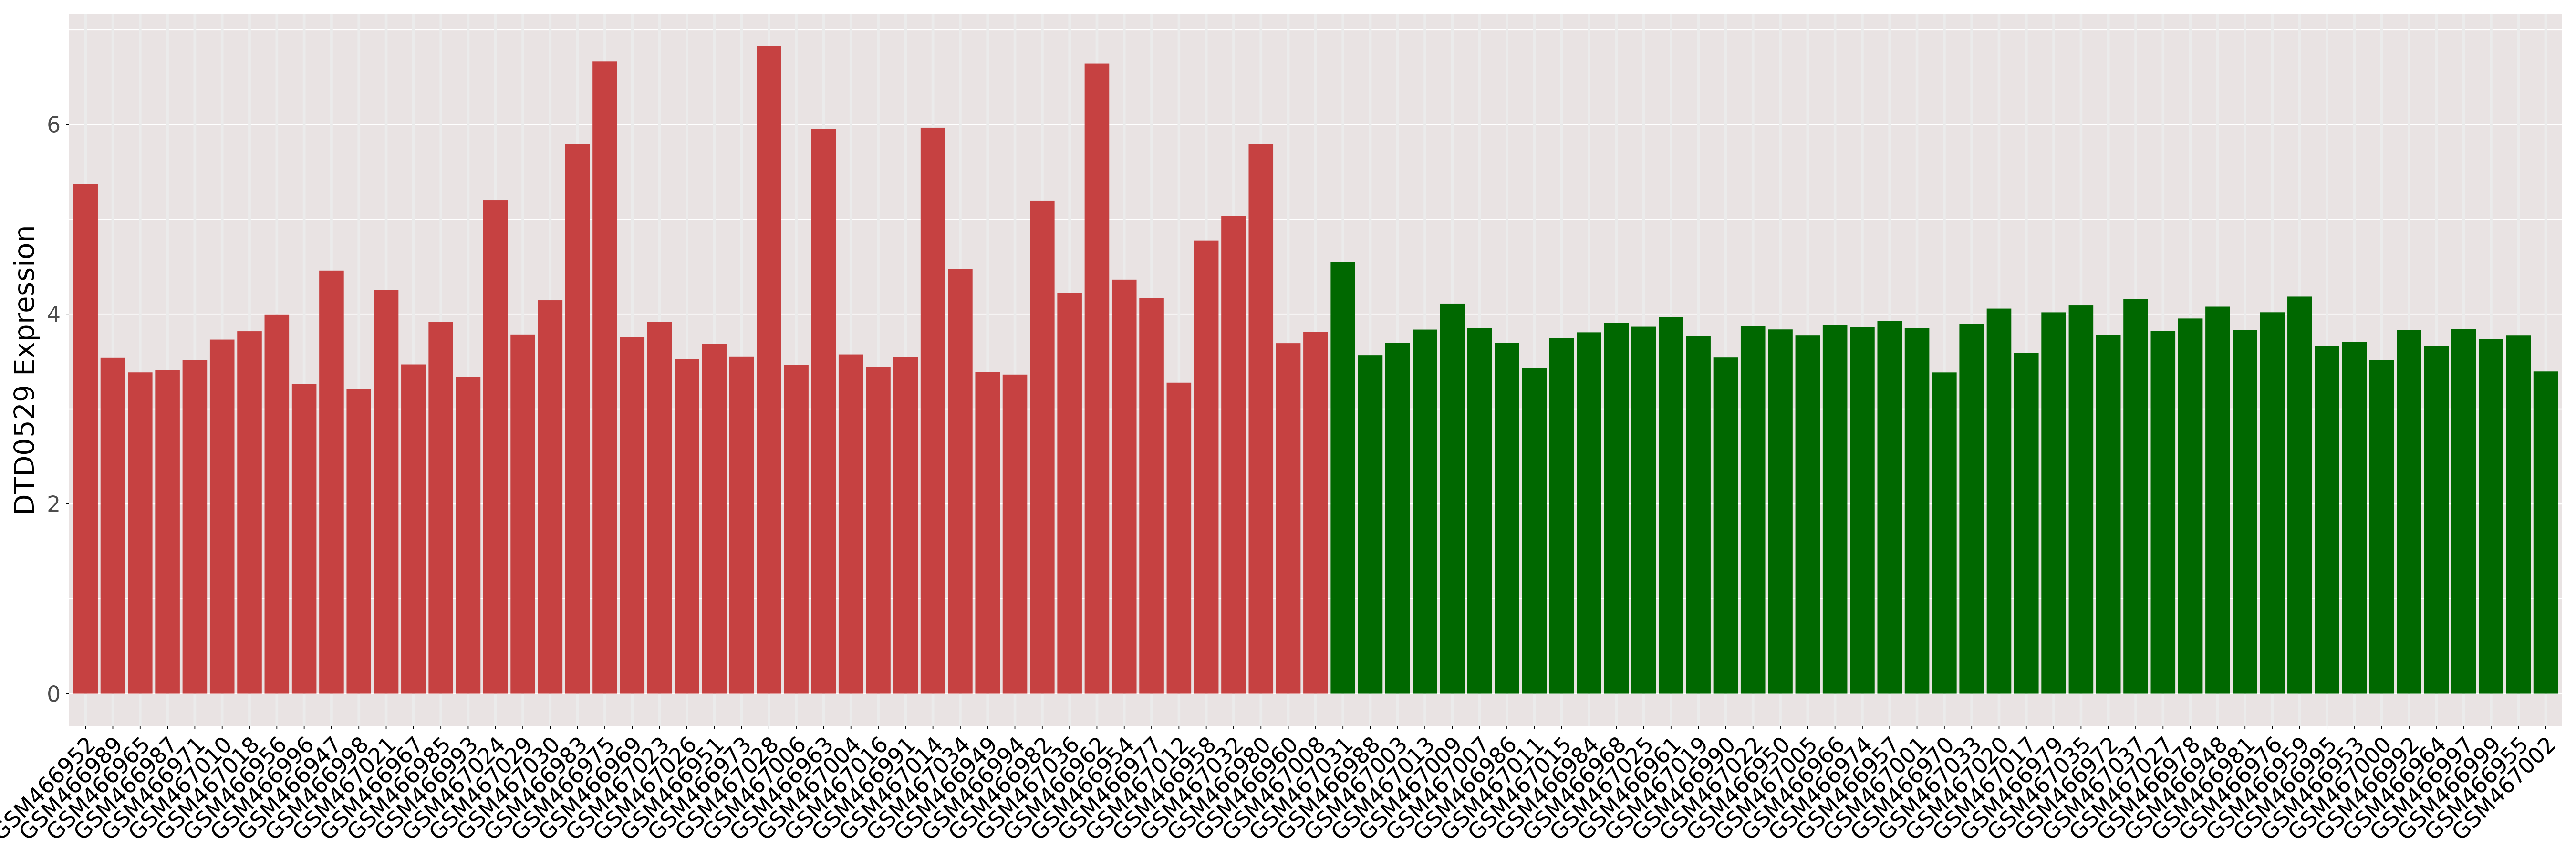
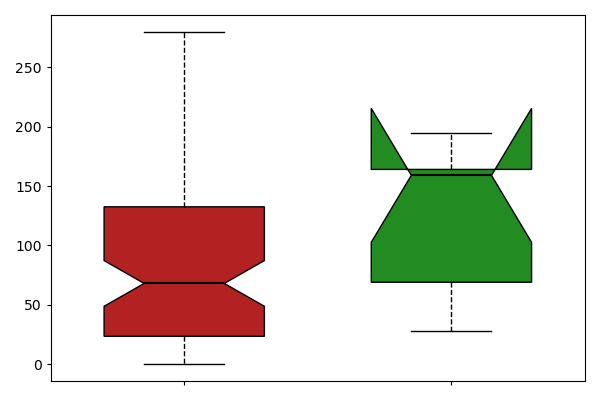
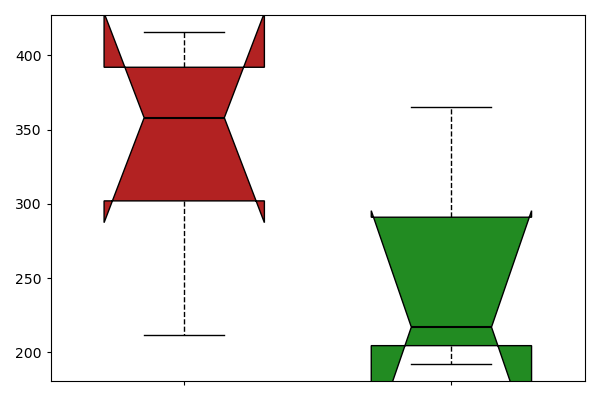
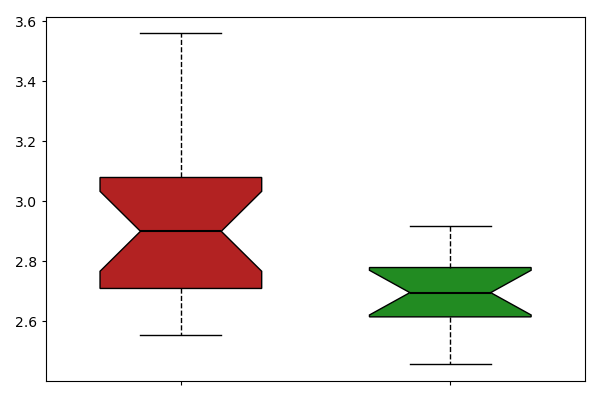
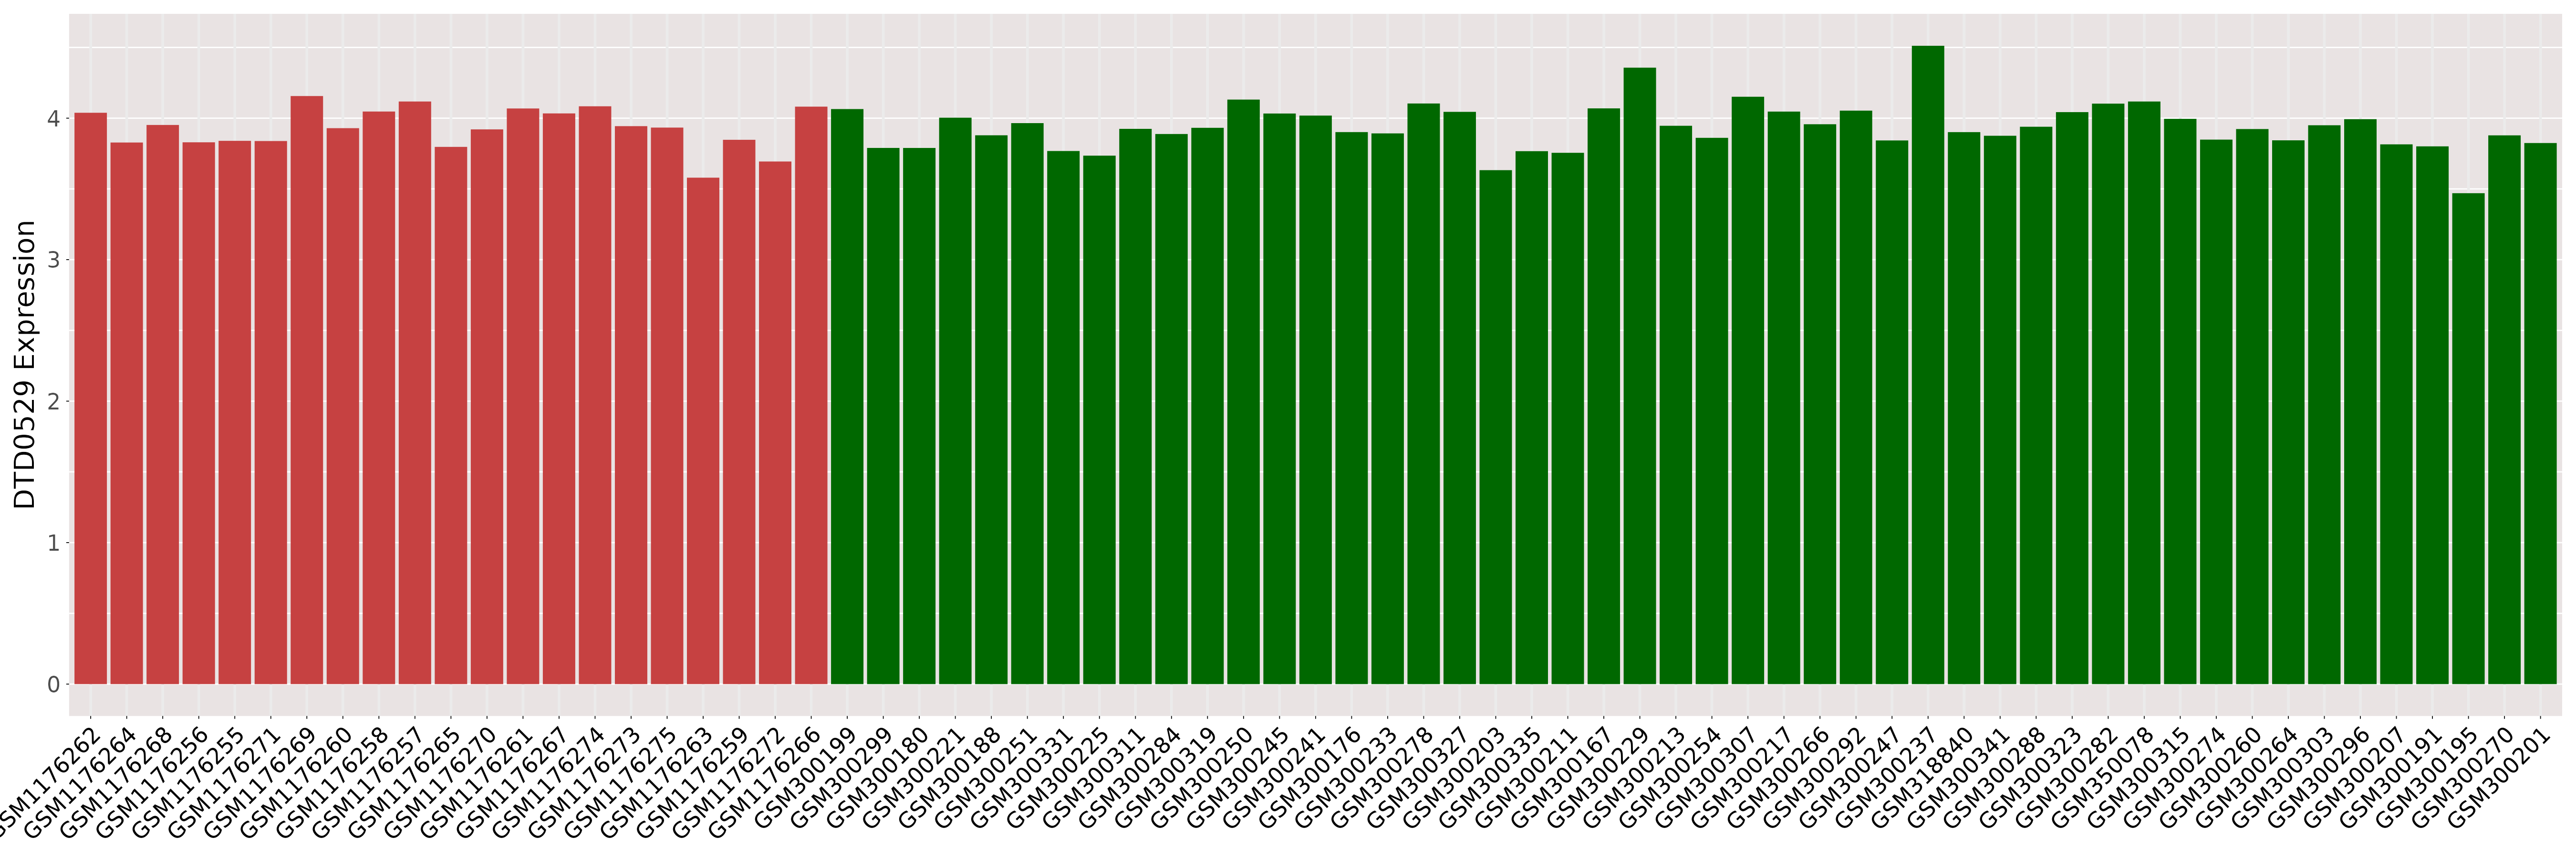
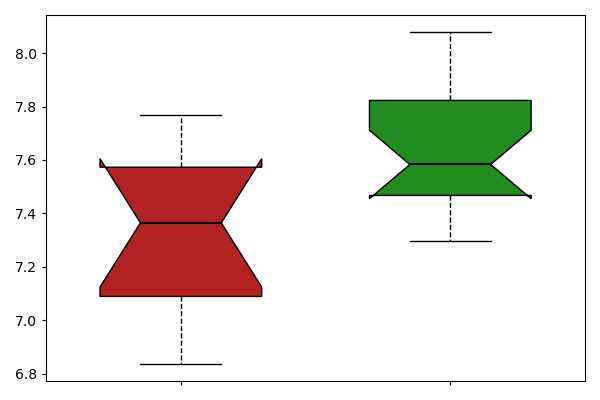
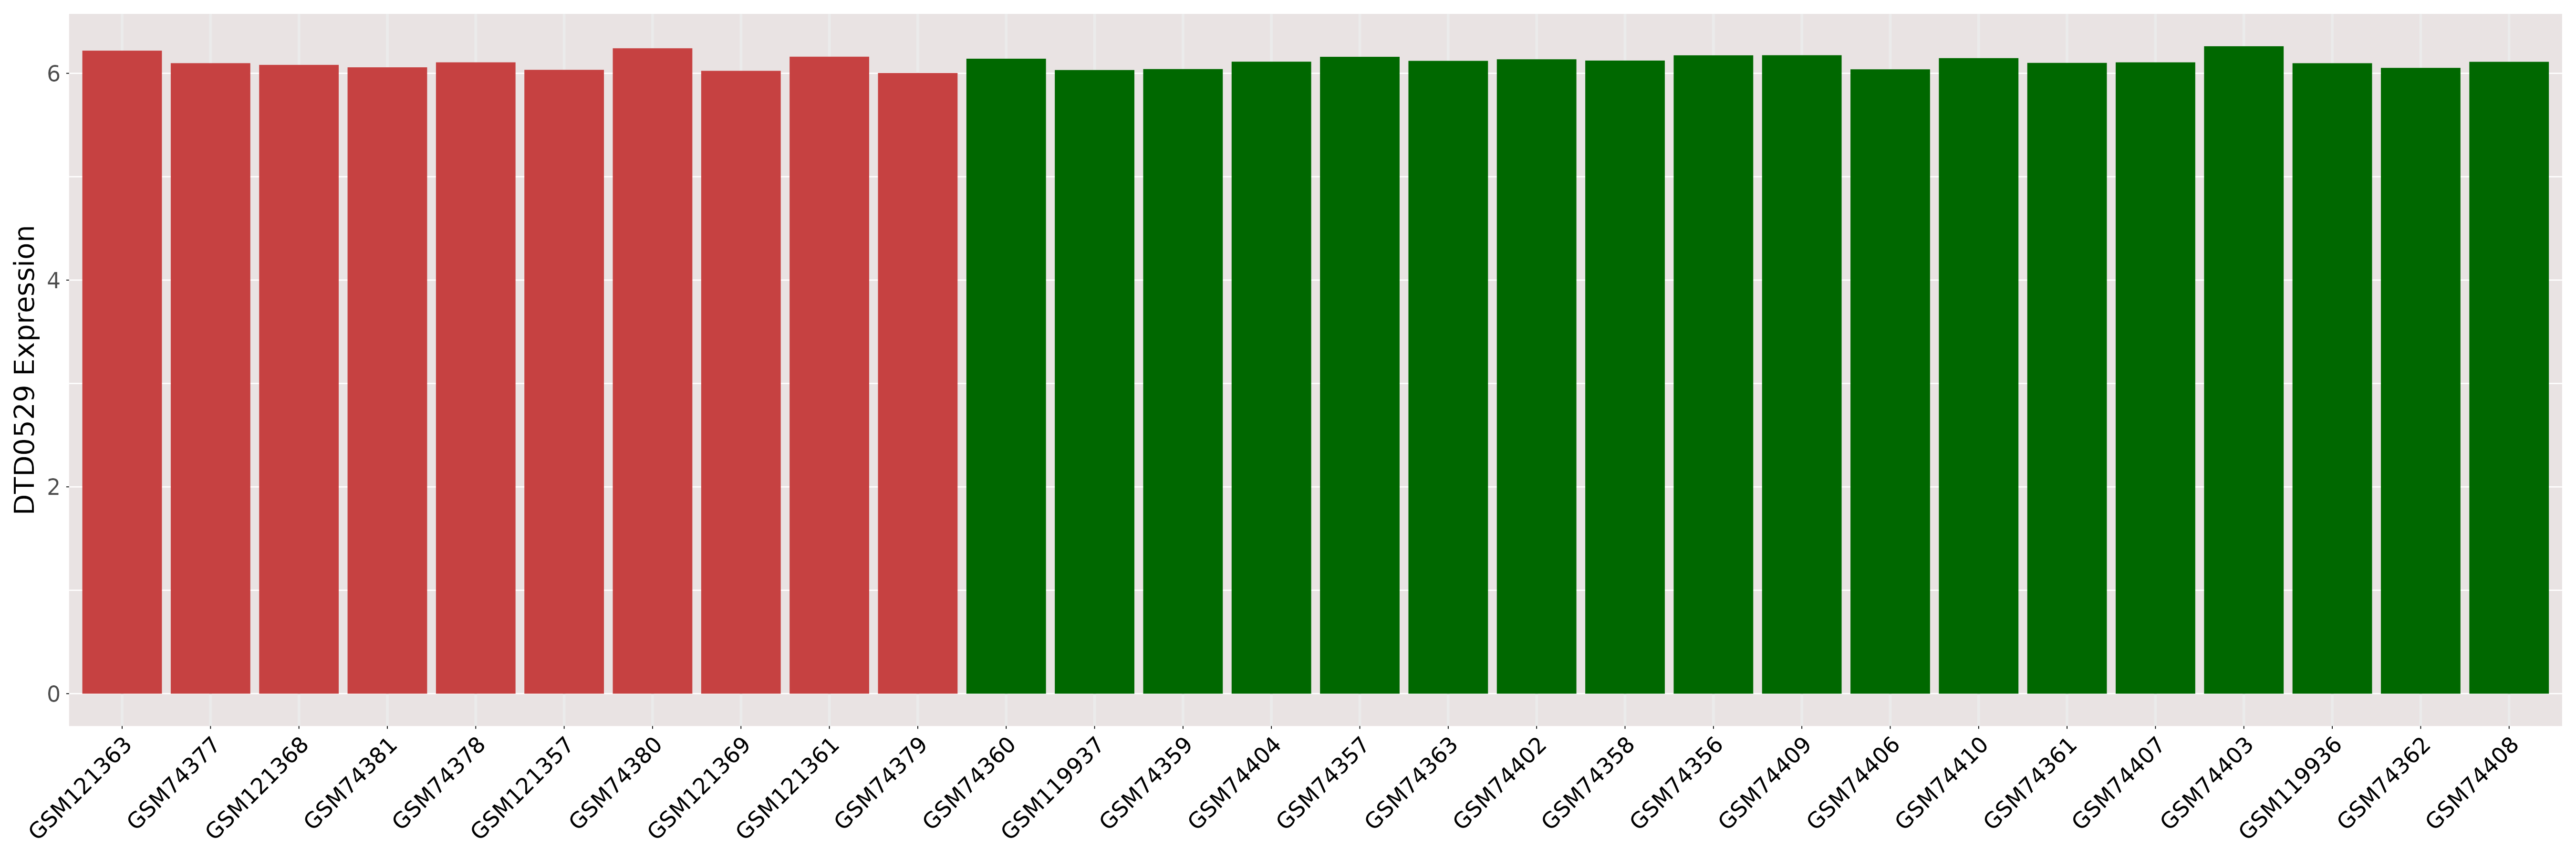
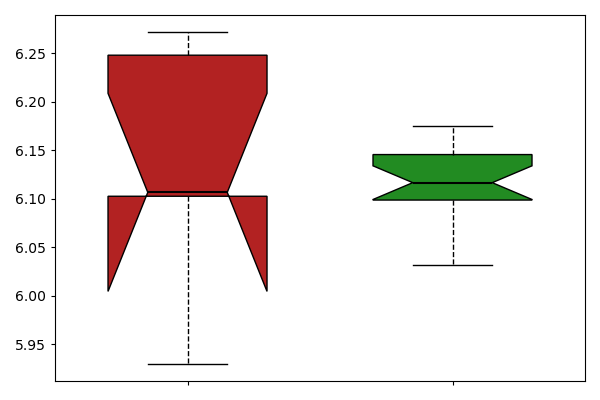
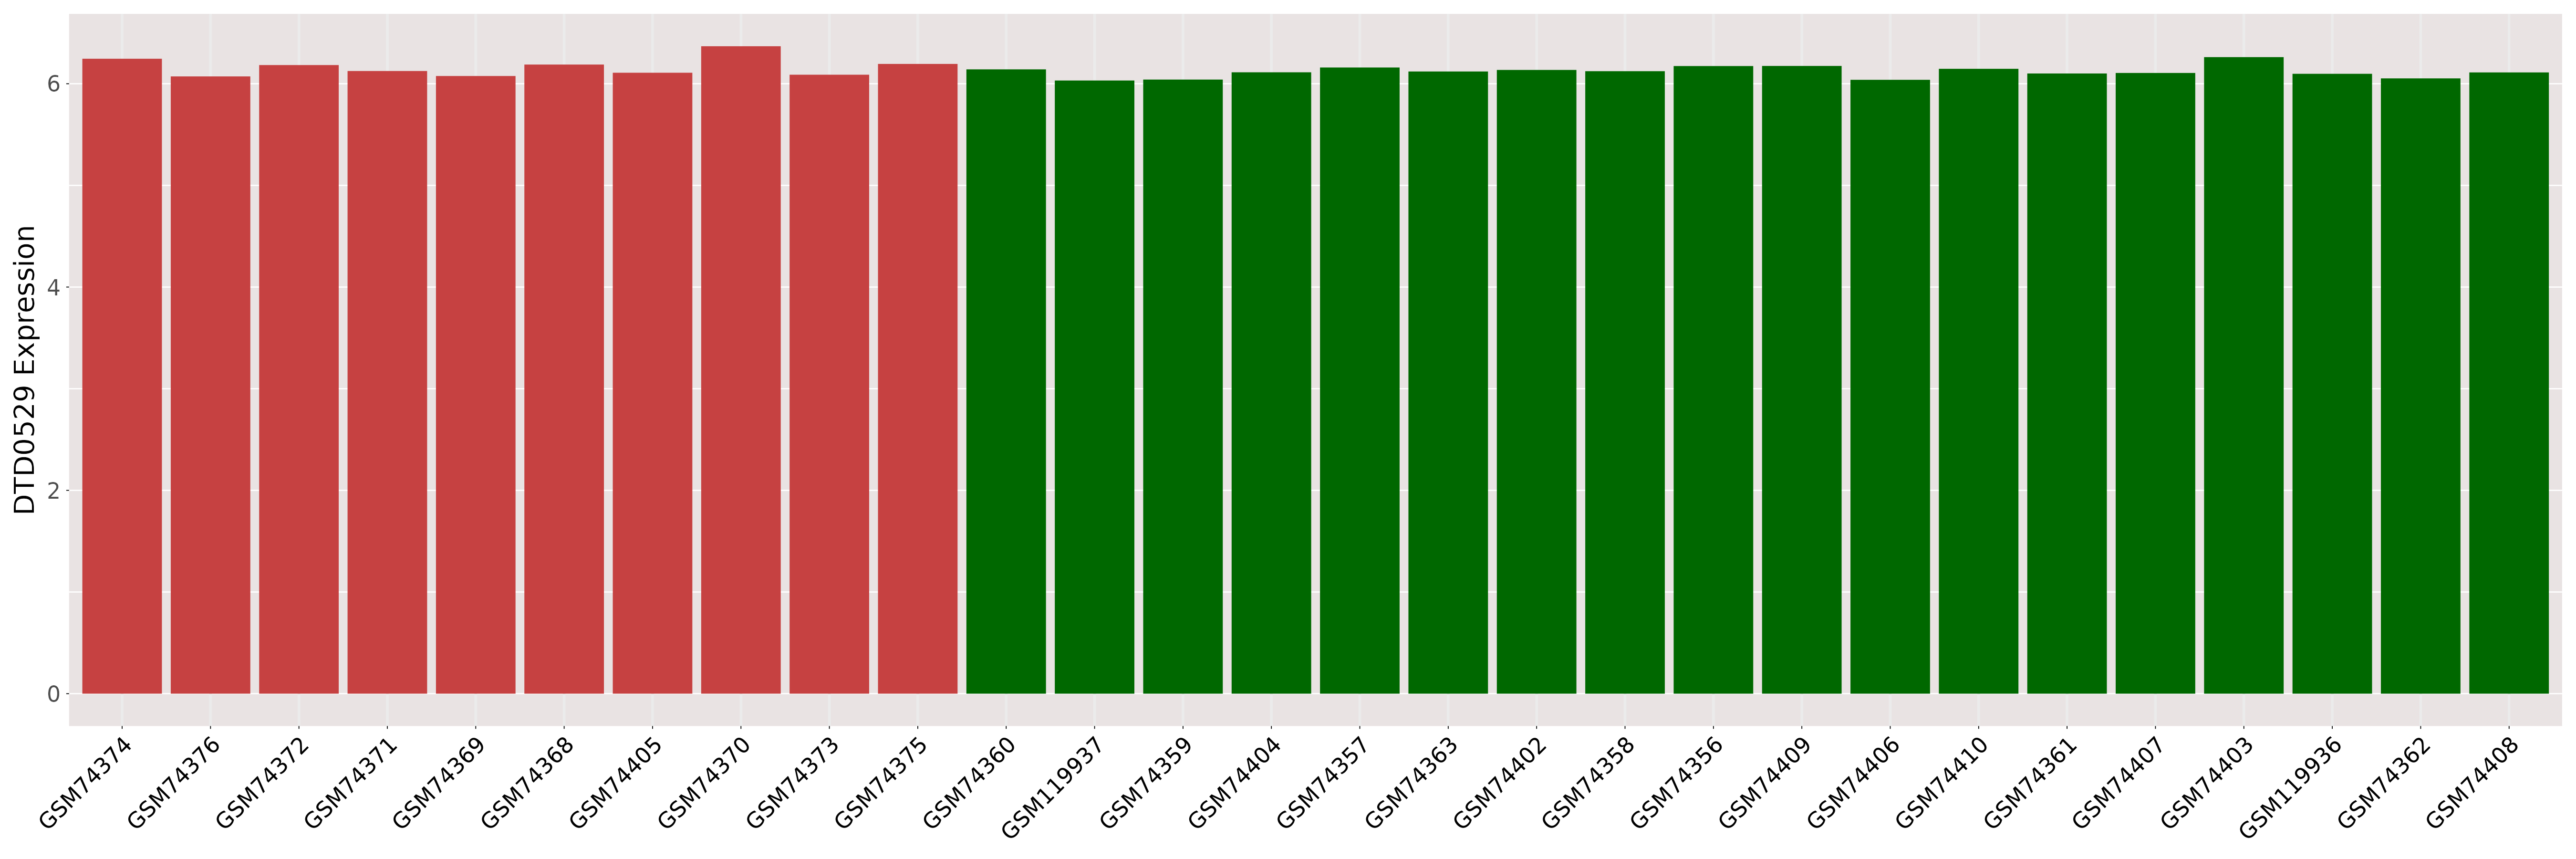
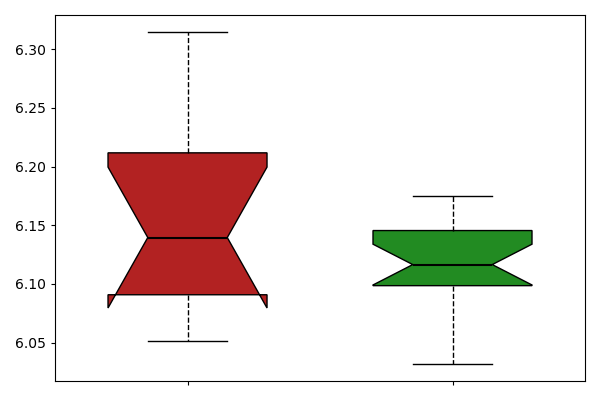
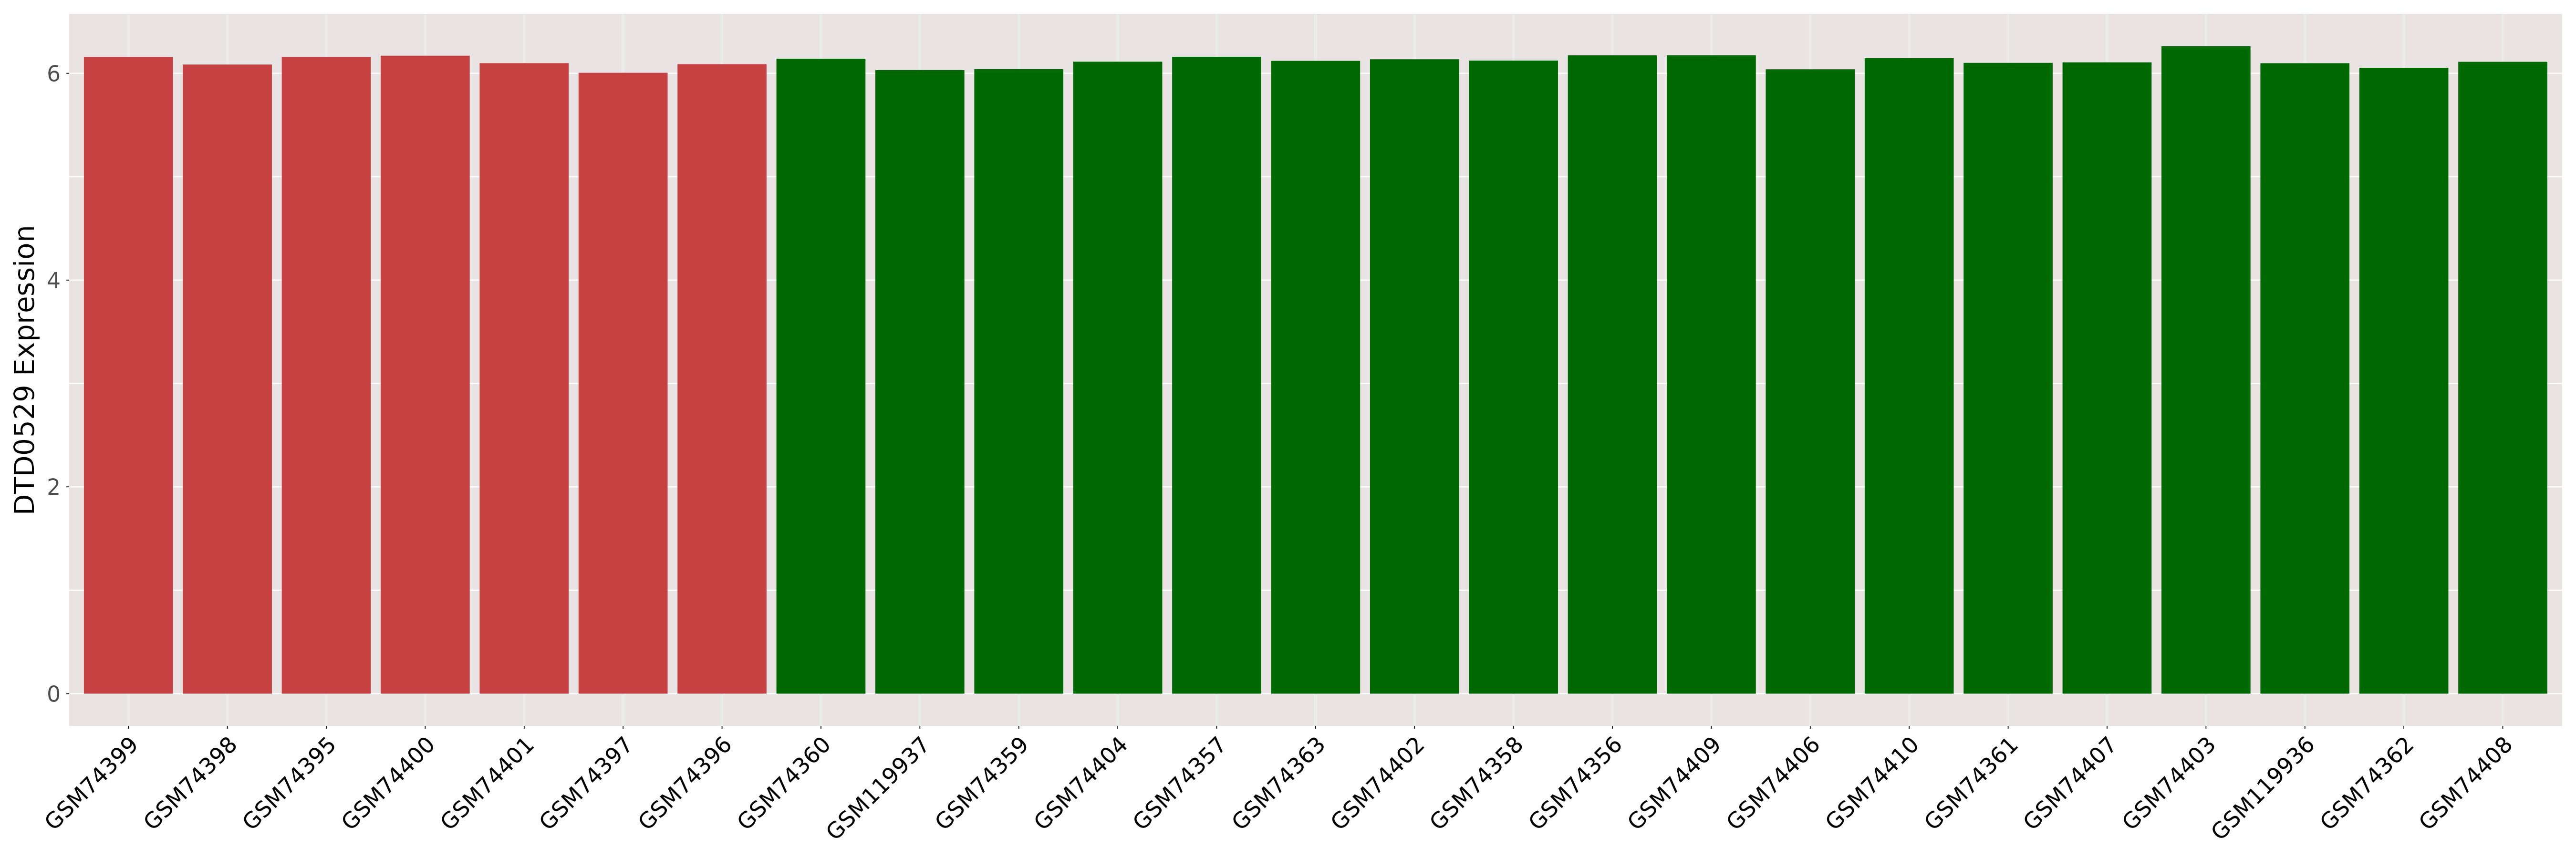
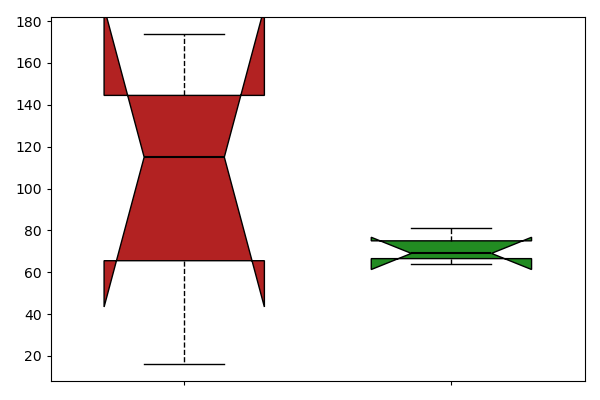
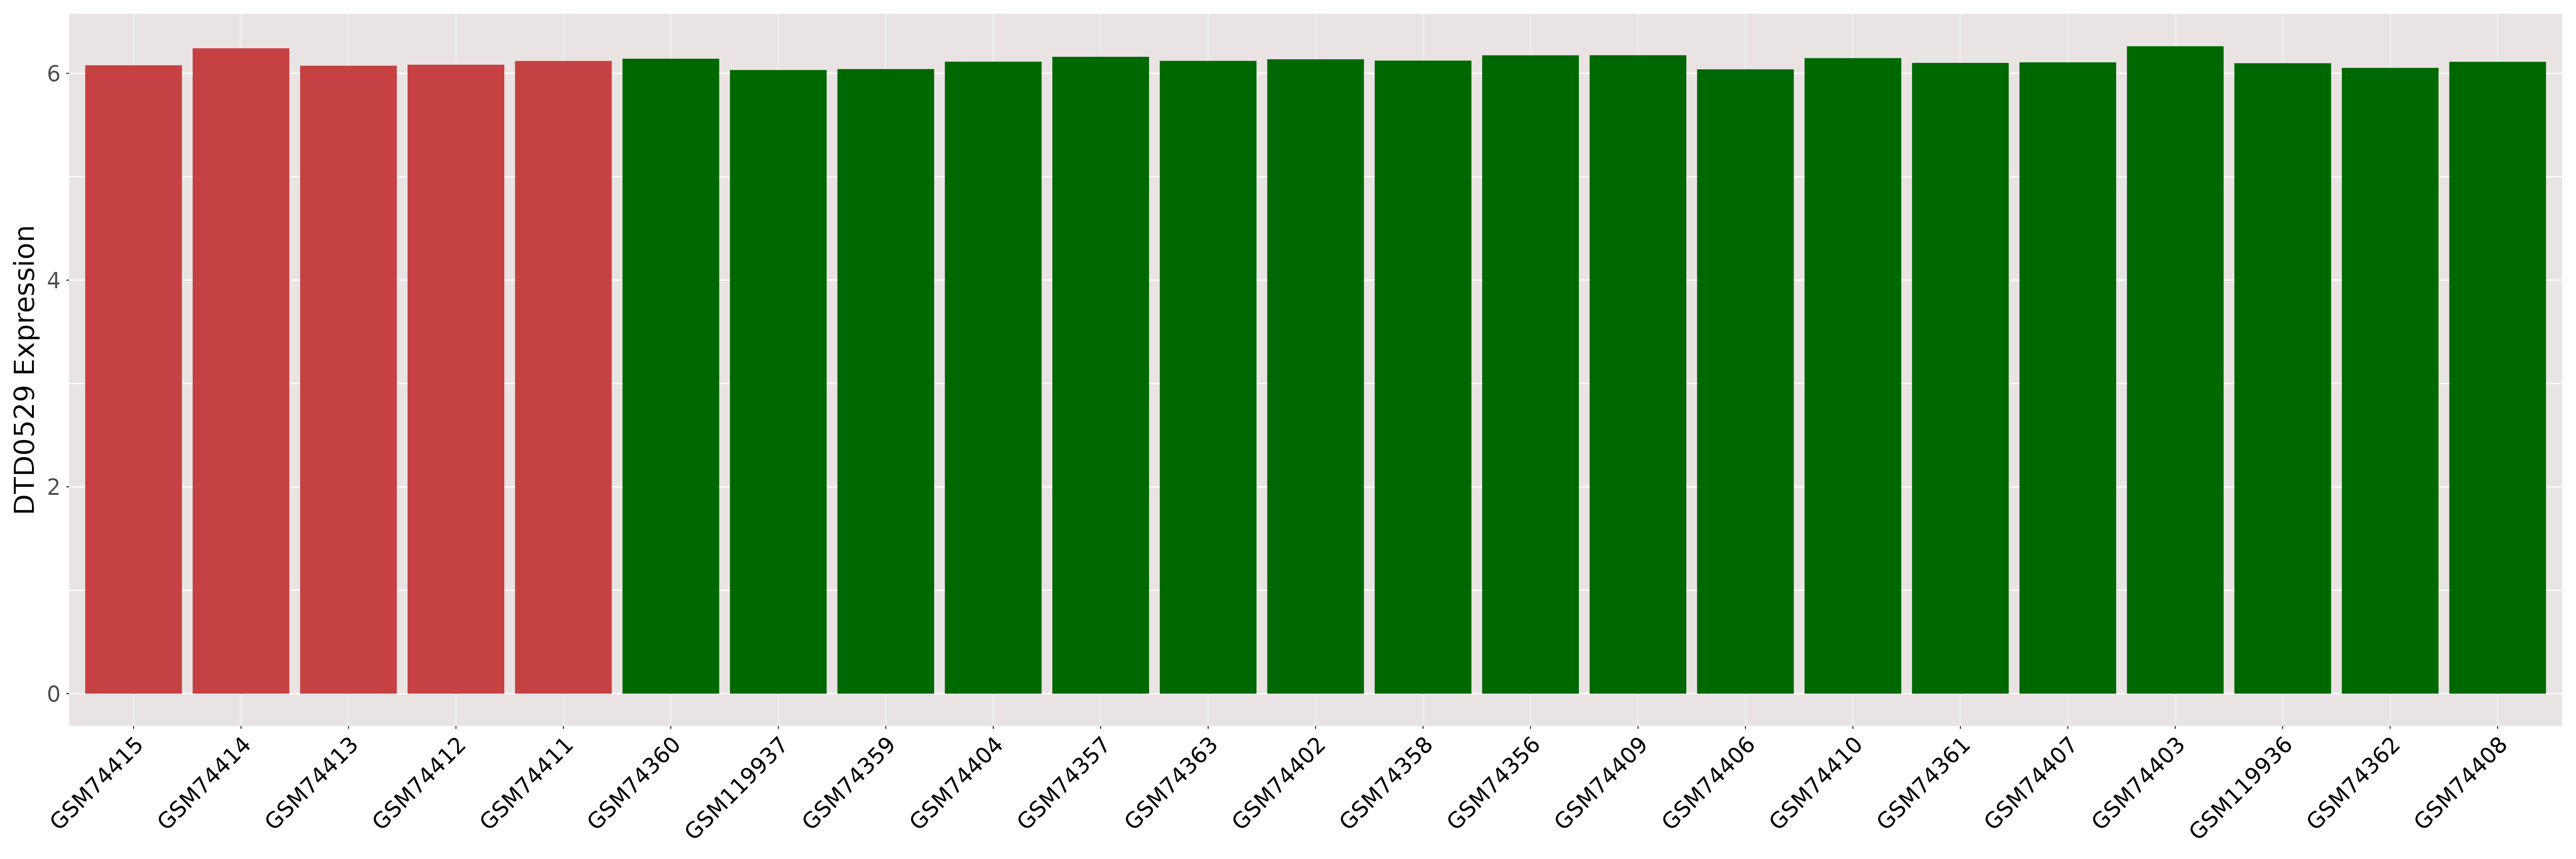
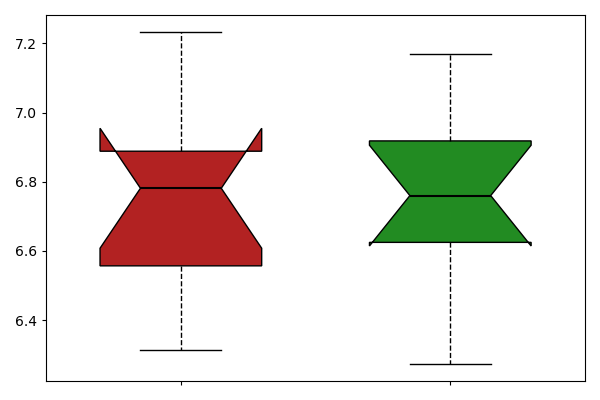
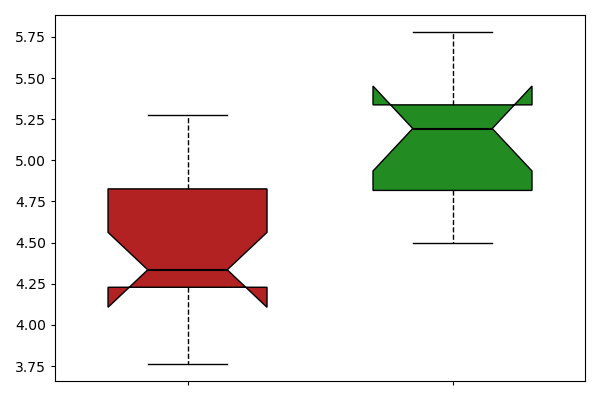
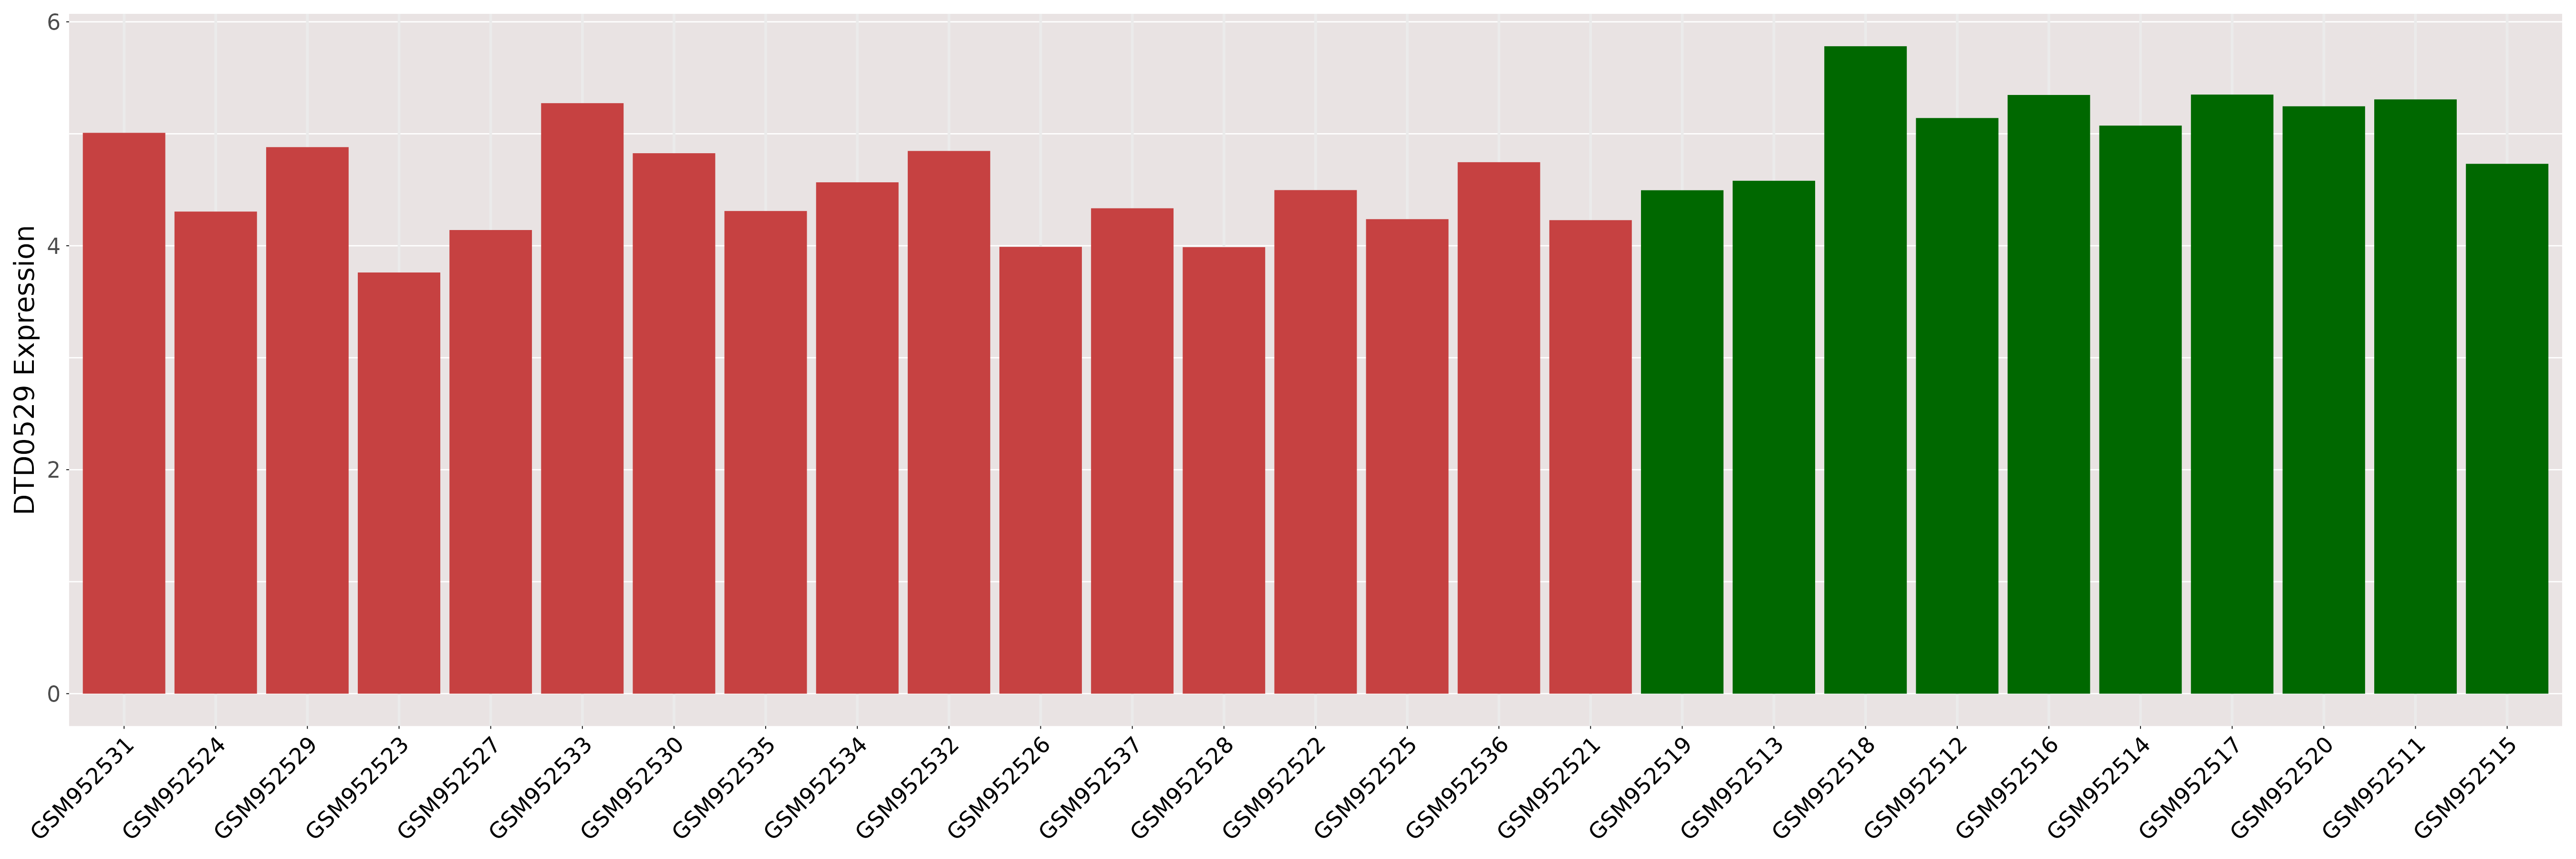
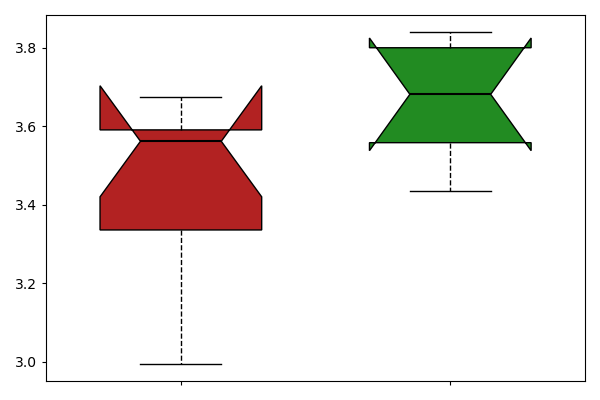
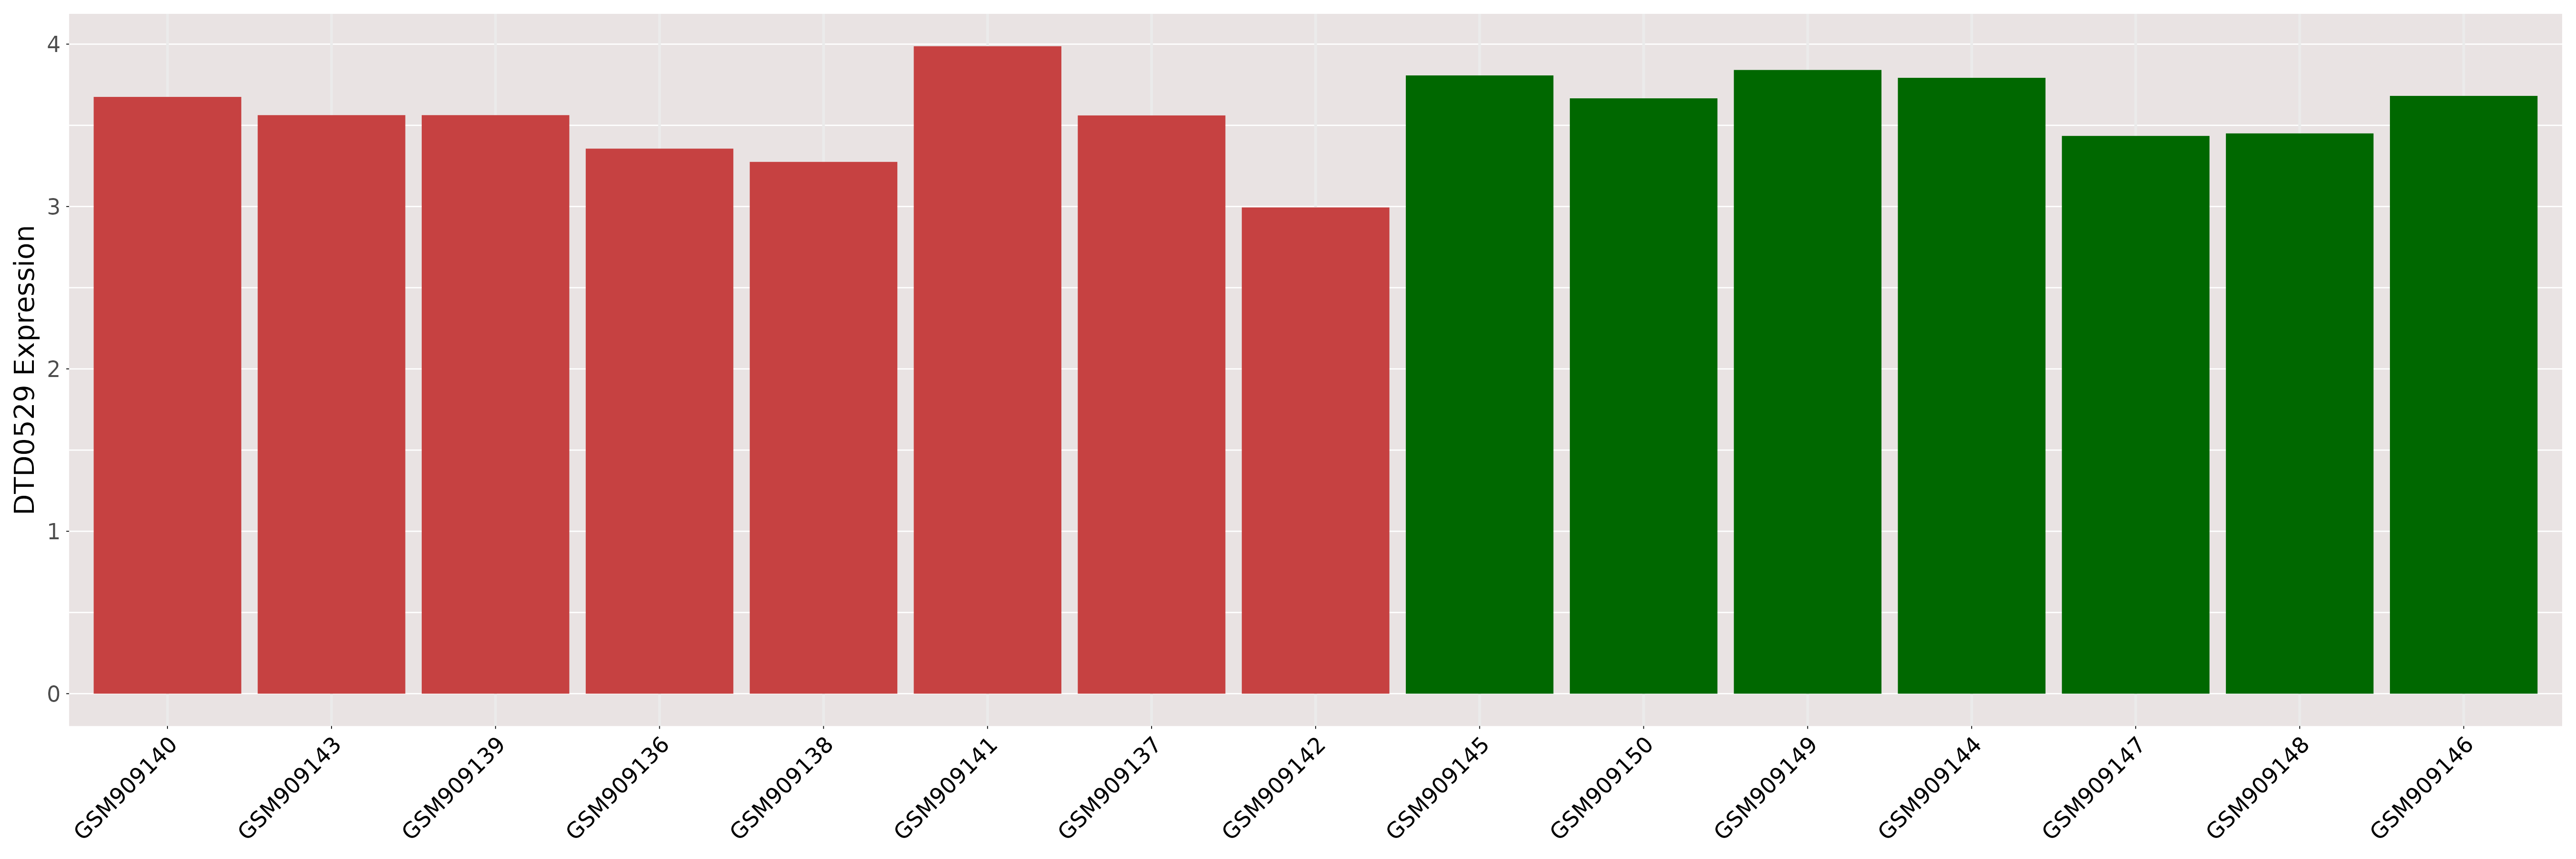
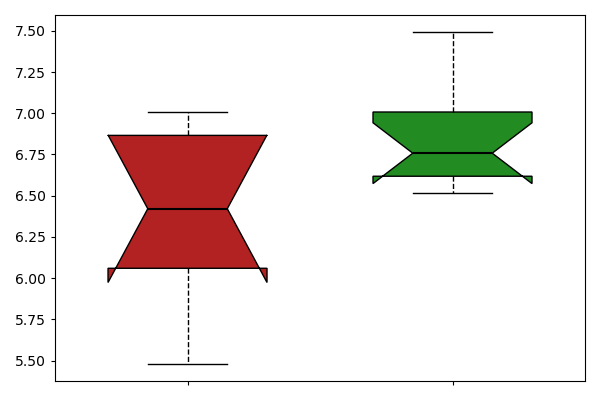
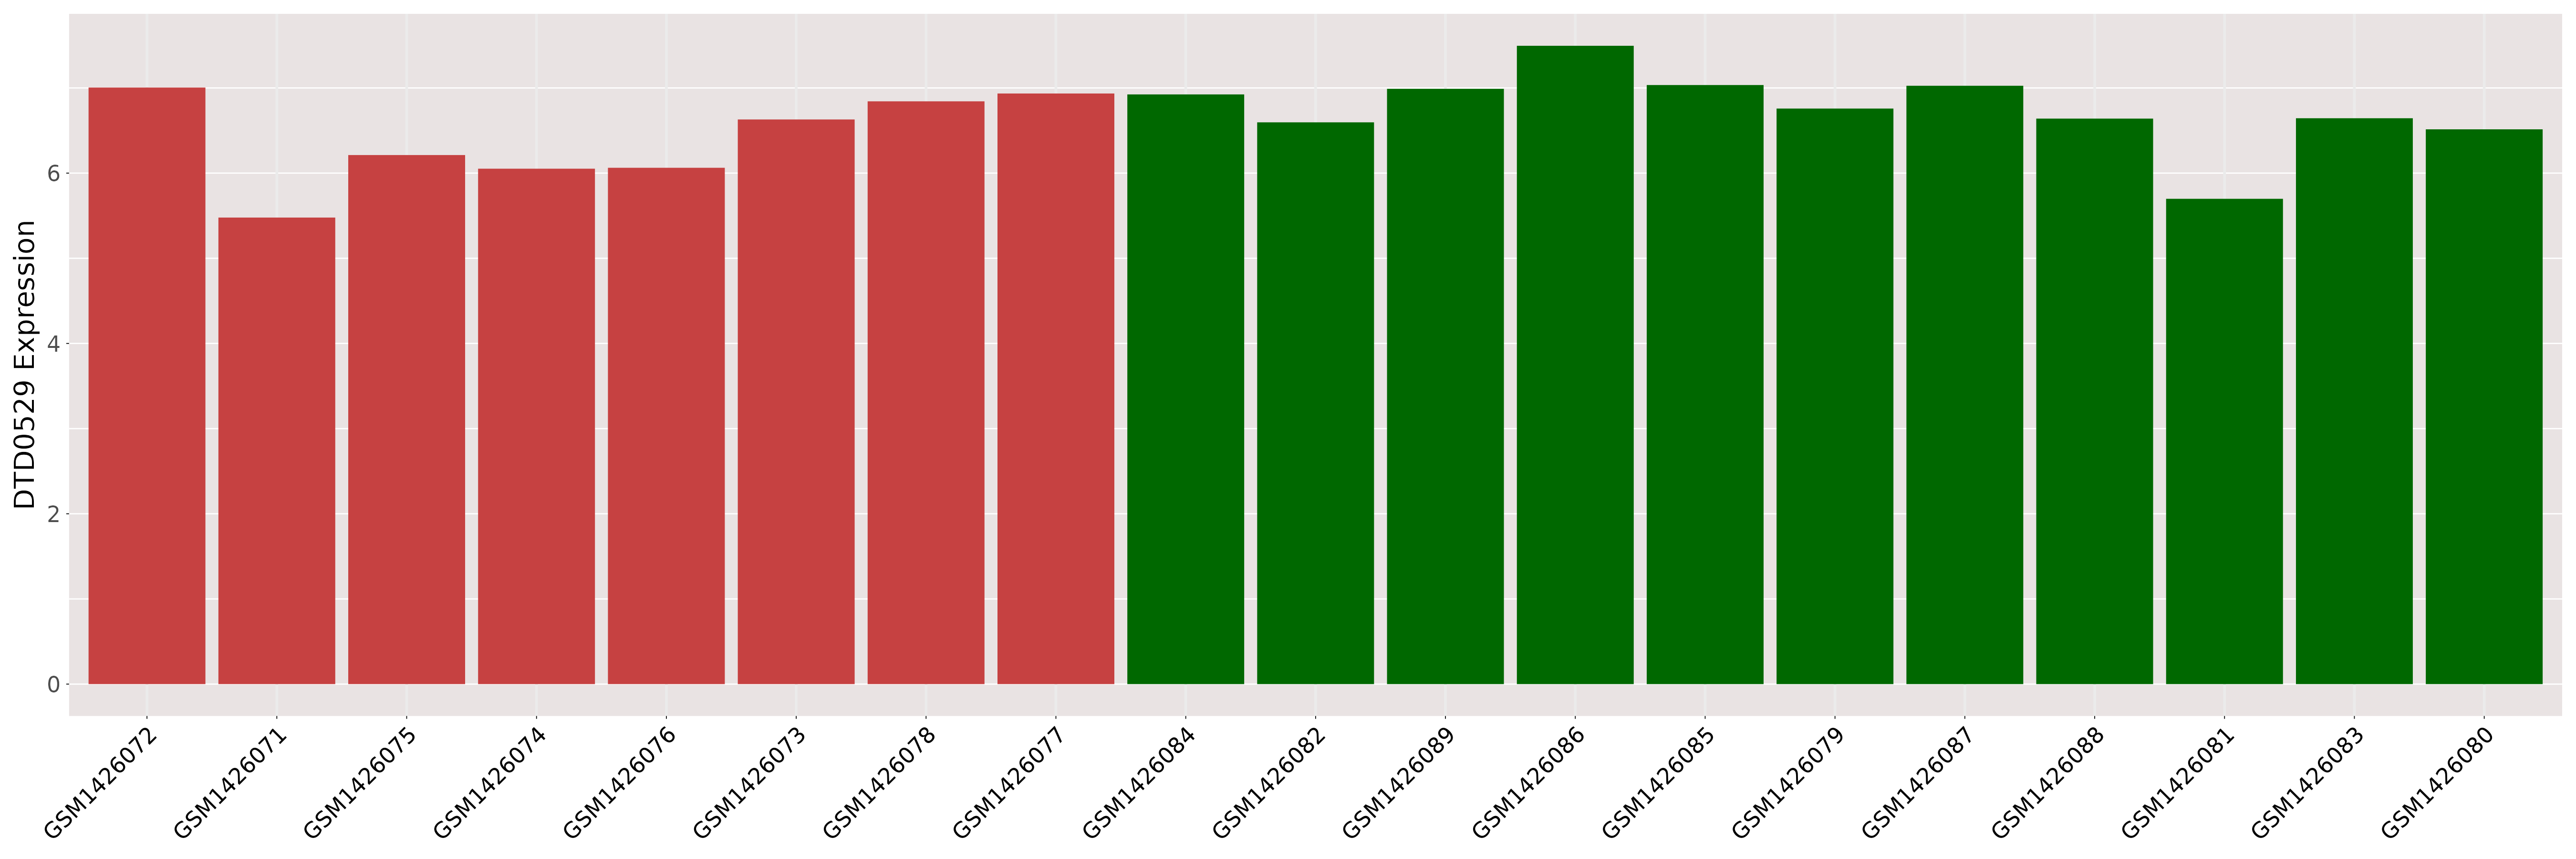
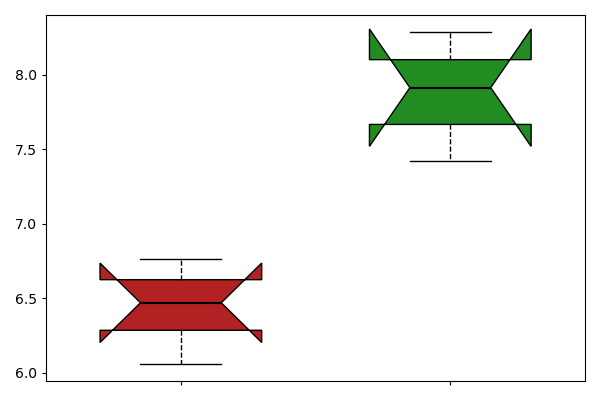
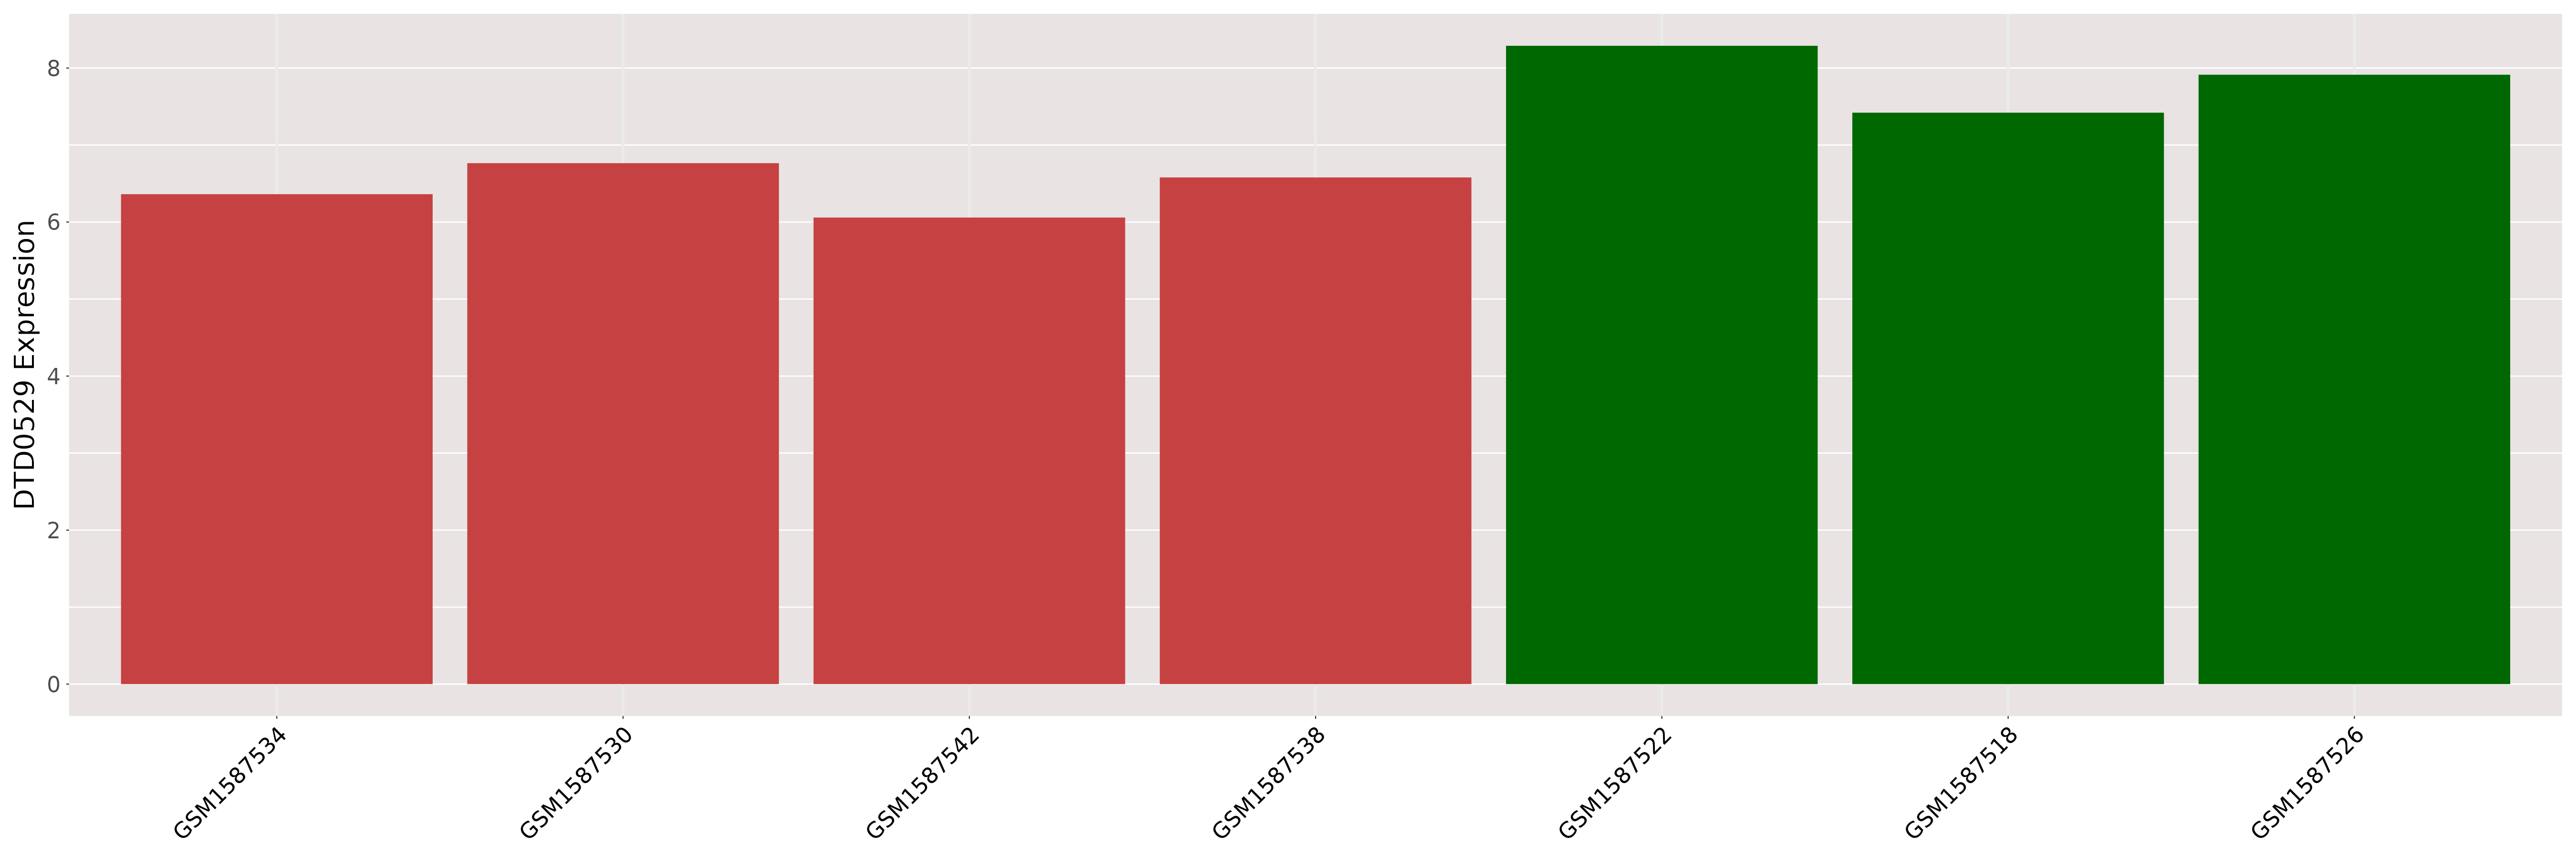
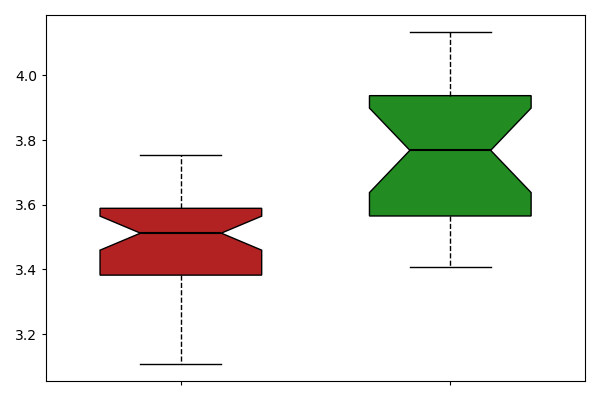
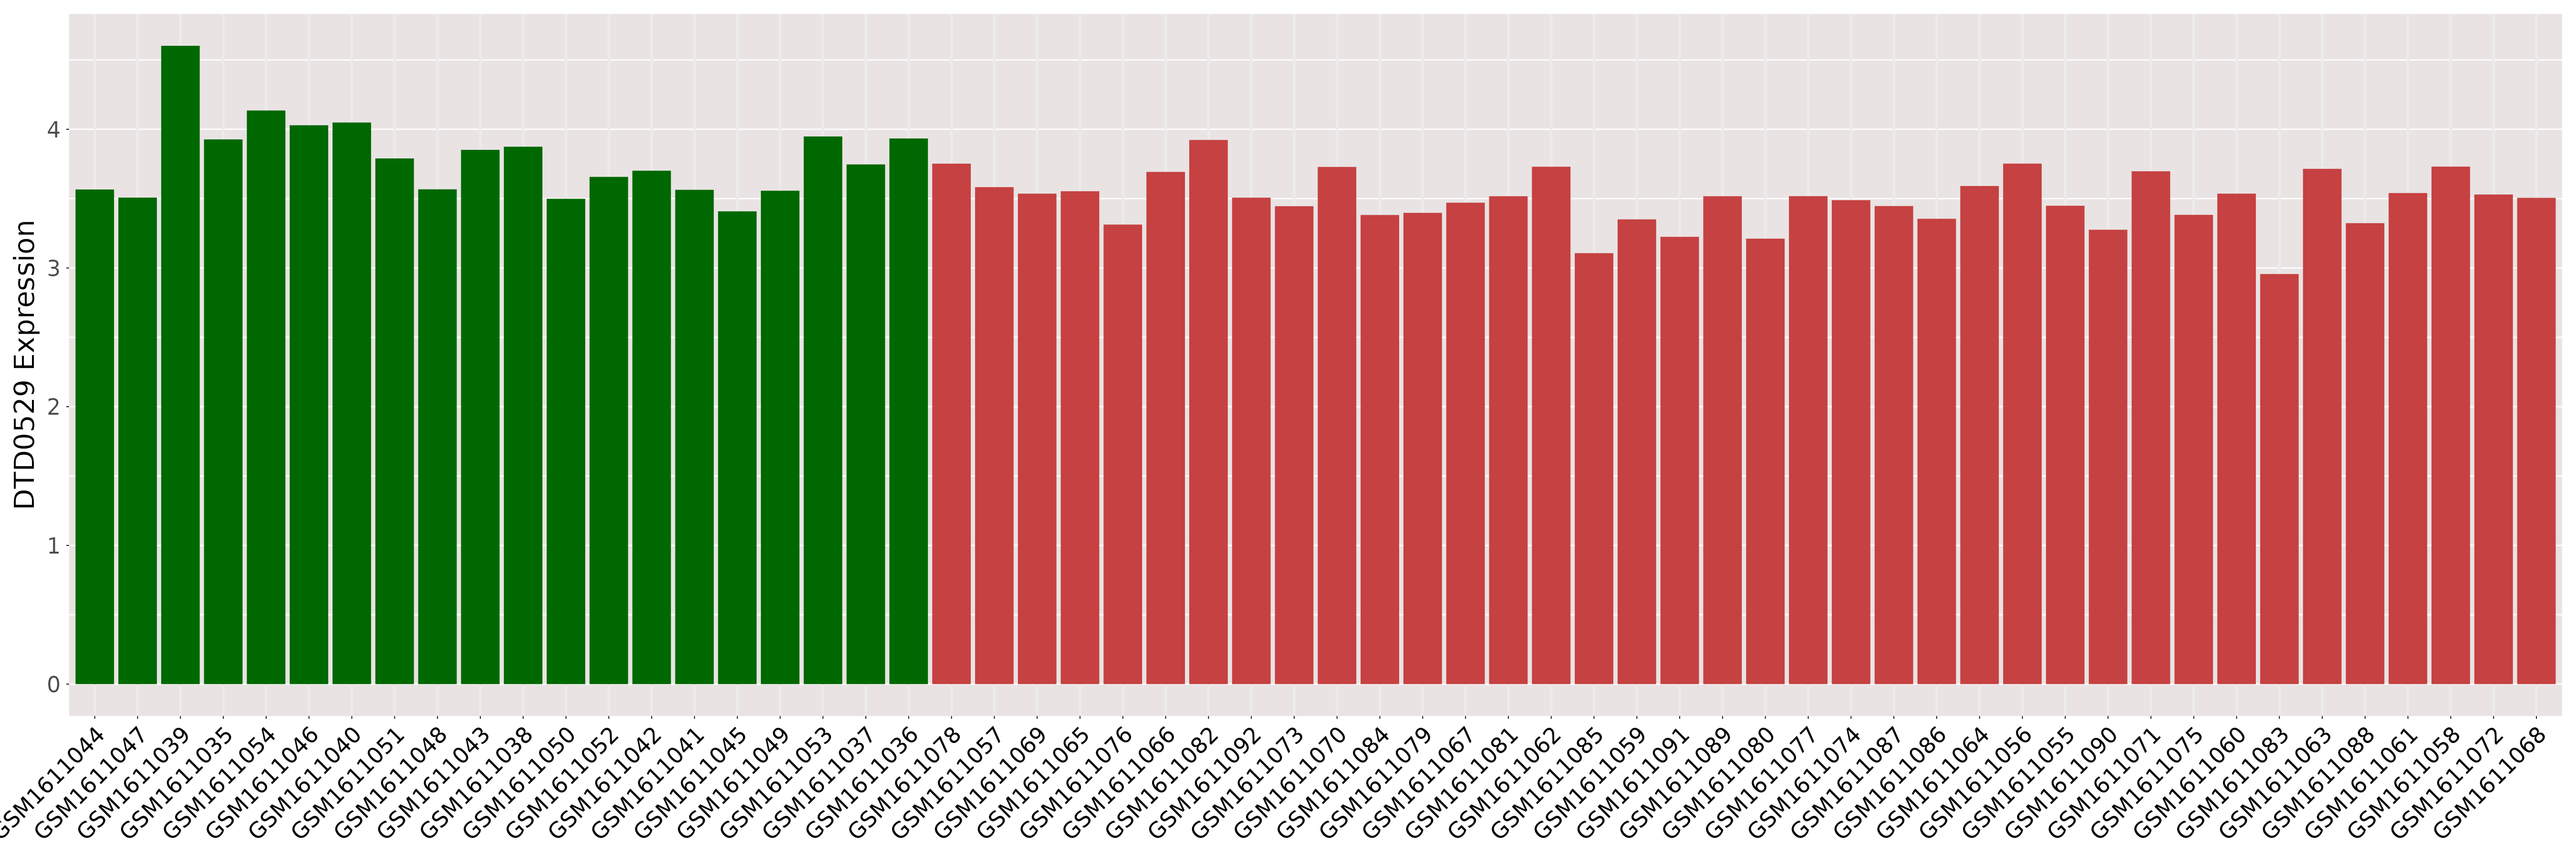
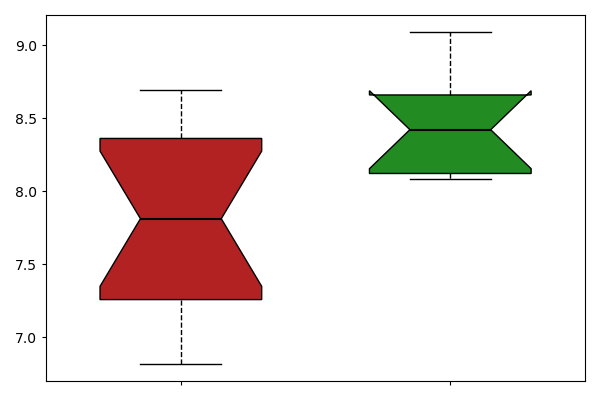
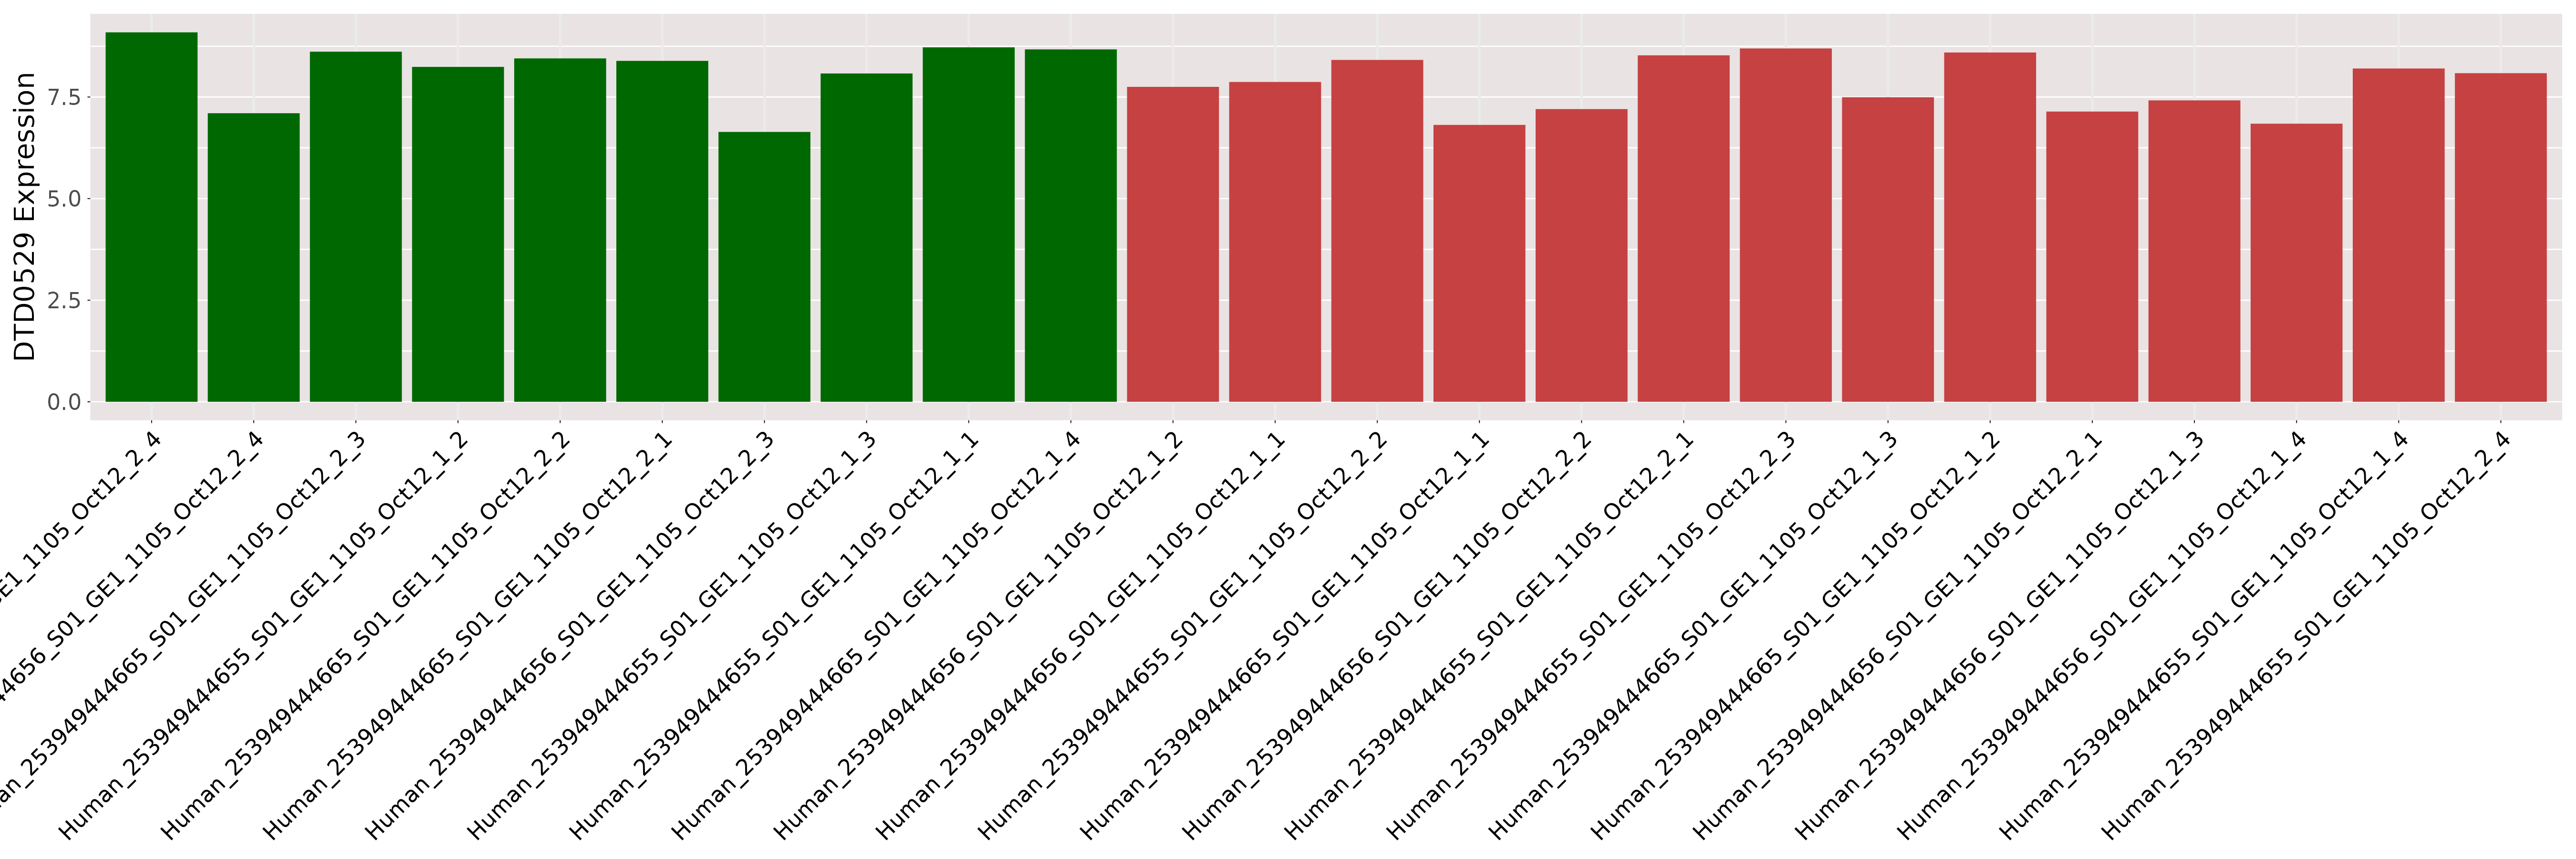
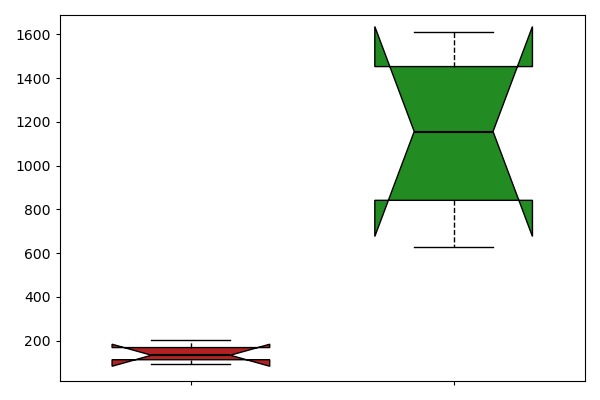
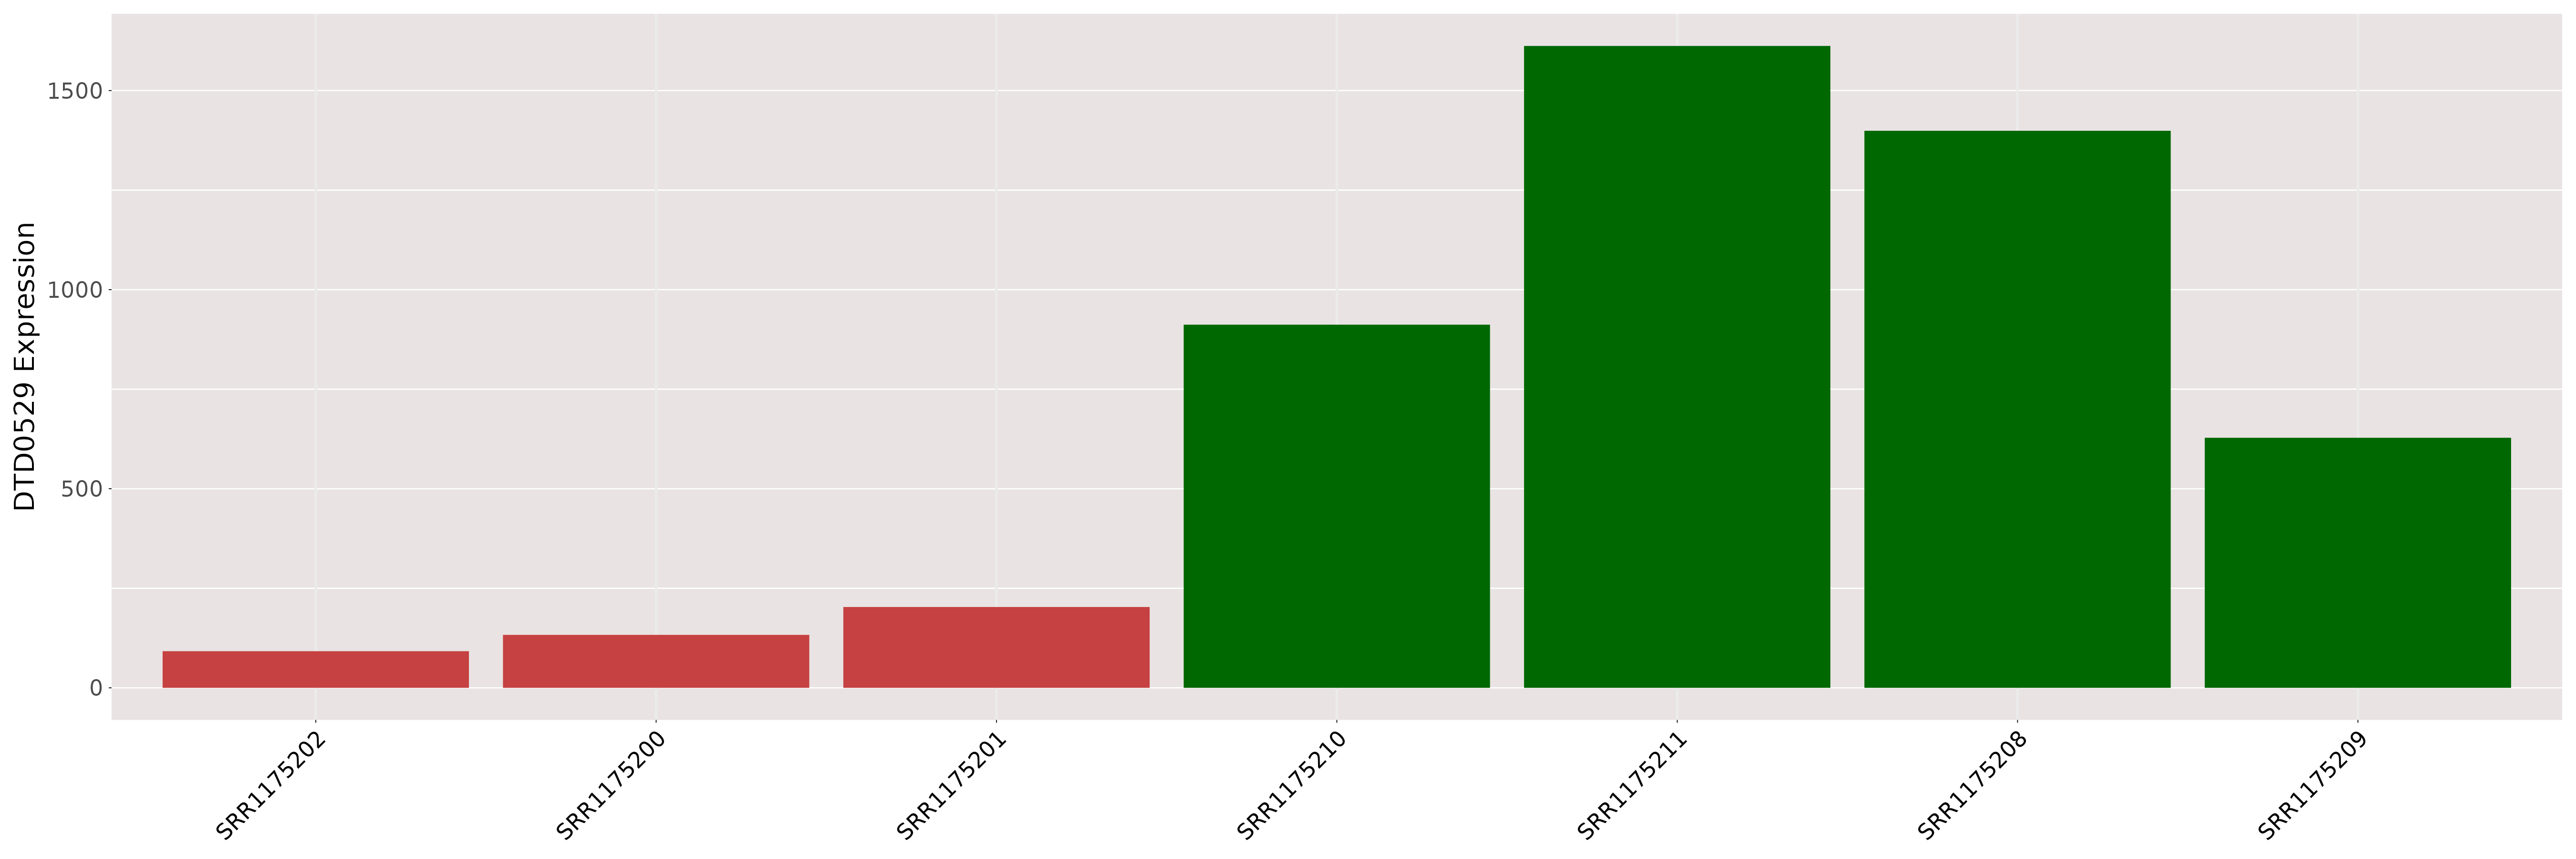
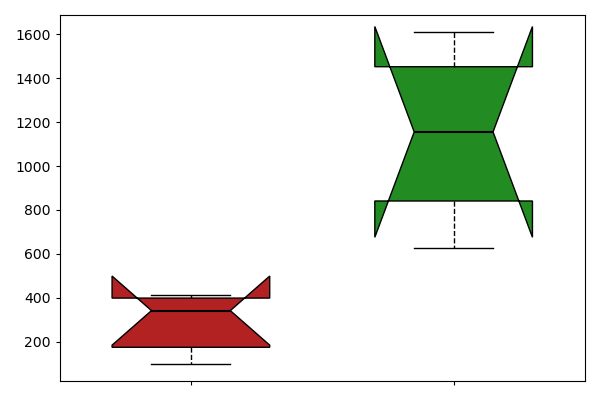
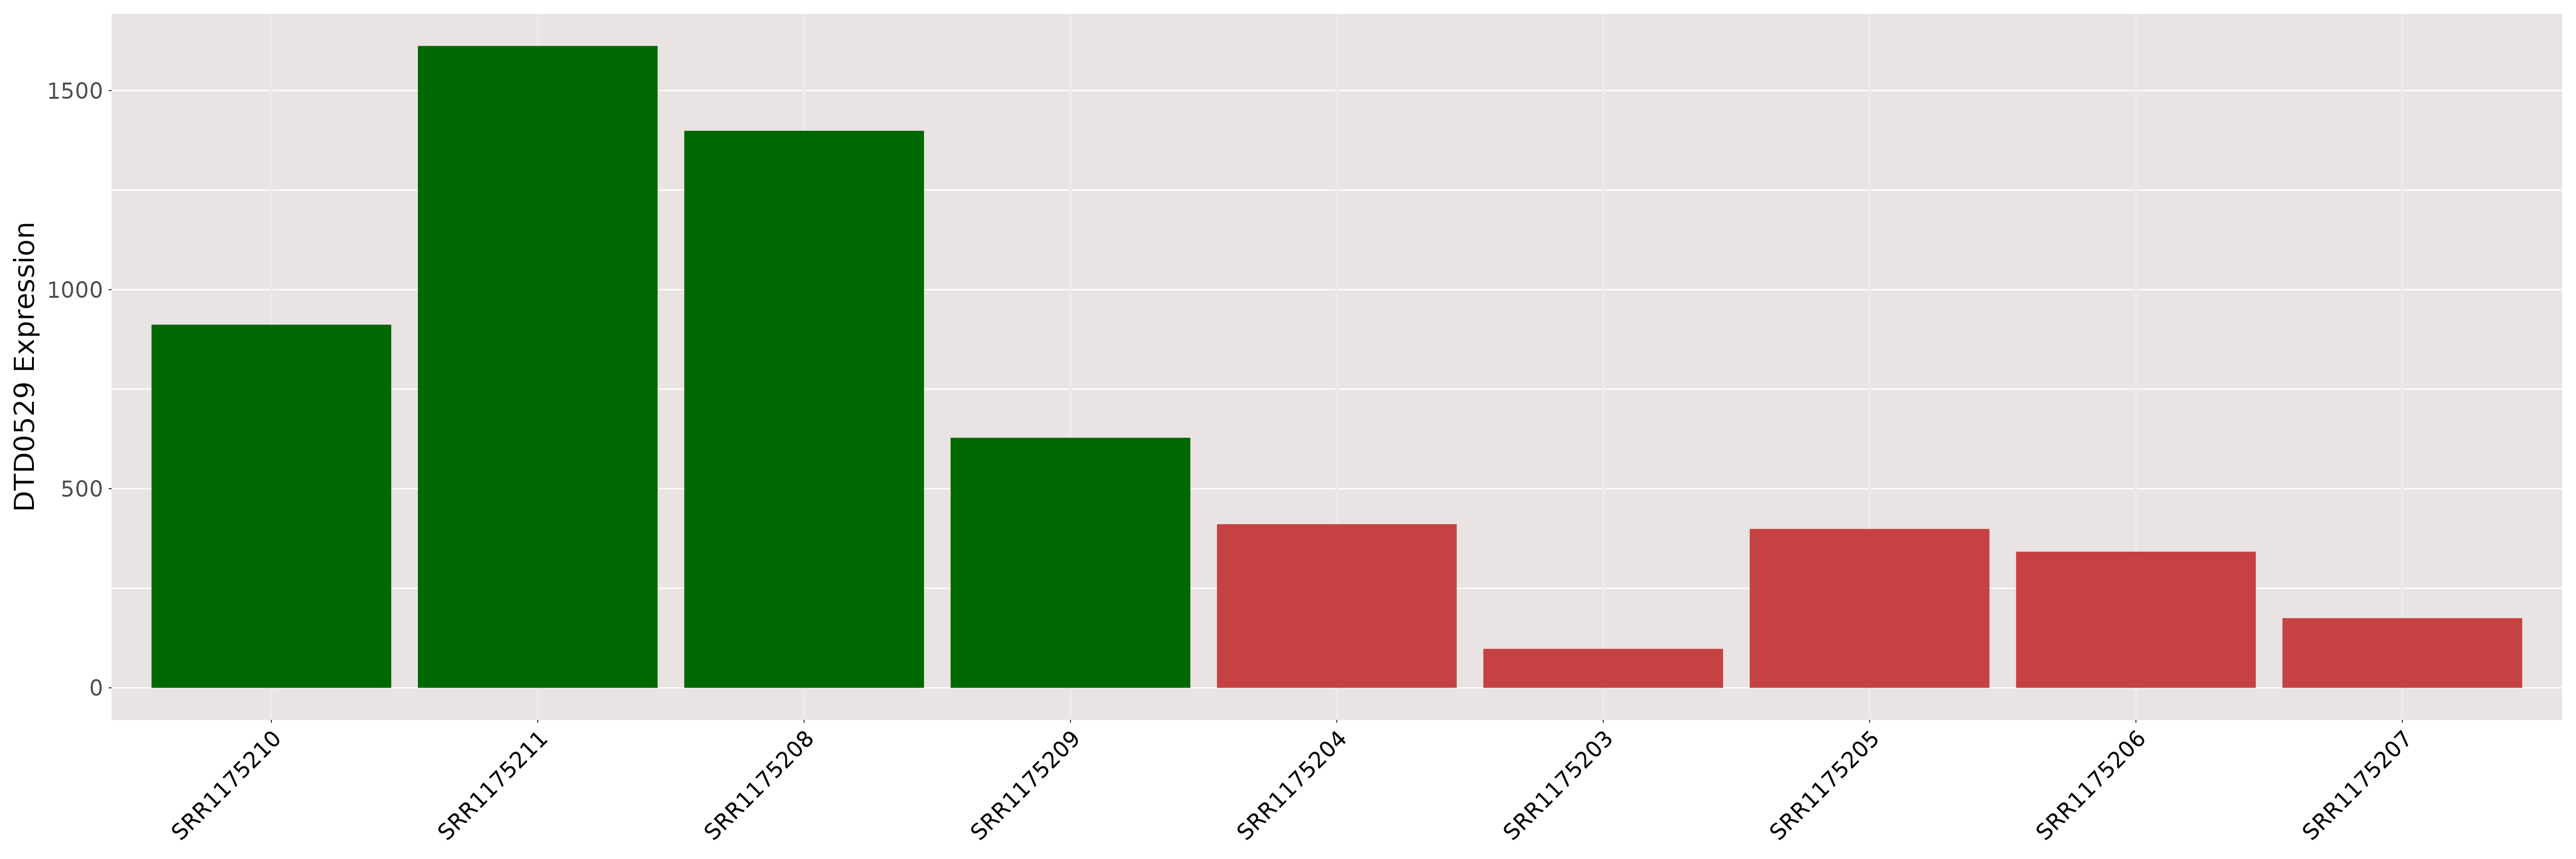
| [+] ICD-11: 2A00.0Y Ependymoma (other specified primary brain neoplasm) | Click to Show/Hide the Full List | ||||
| The Studied Tissue | Brain | ||||
| The Specified Disease | Ependymoma [ICD-11:2A00.0Y] | ||||
| The Expression Level of Disease Section Compare with the Healthy Individual Tissue | p-value:0.218258937805576; Fold-change:1.0262807708587327; Z-score:0.7732406912902149 | ||||
| DT expression in the diseased tissue of patients
DT expression in the normal tissue of healthy individuals
|
|||||
|
 Please Click the above Thumbnail to View/Download
the Expression Barchart for All Samples Please Click the above Thumbnail to View/Download
the Expression Barchart for All Samples
|
||||
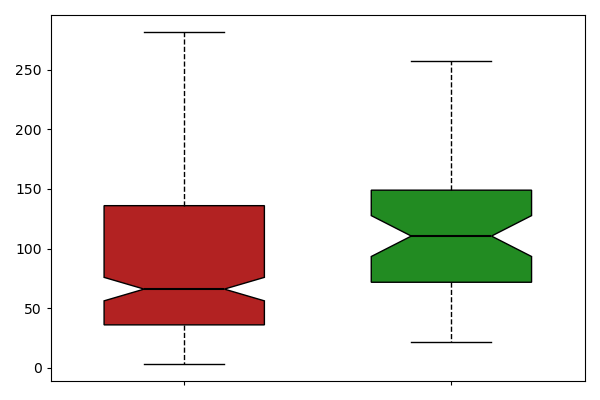
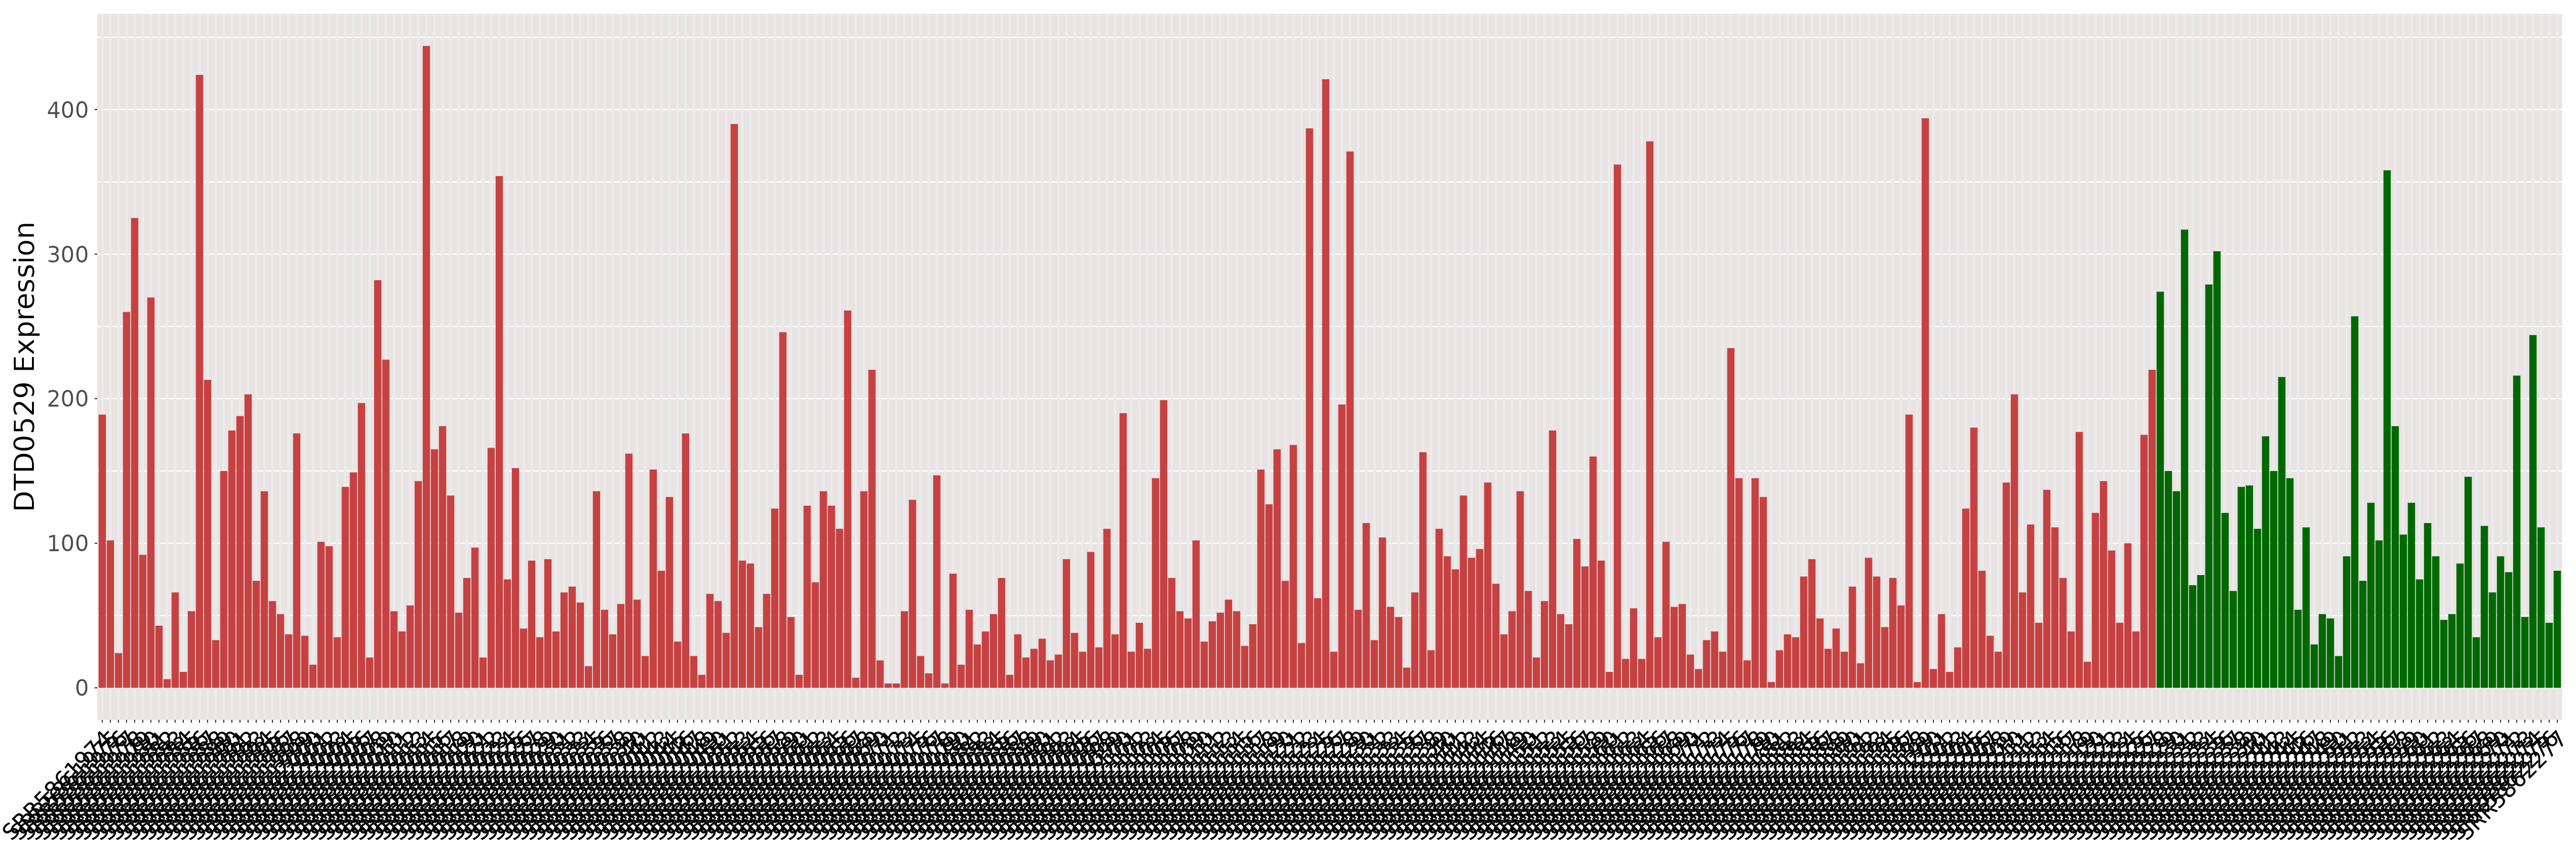
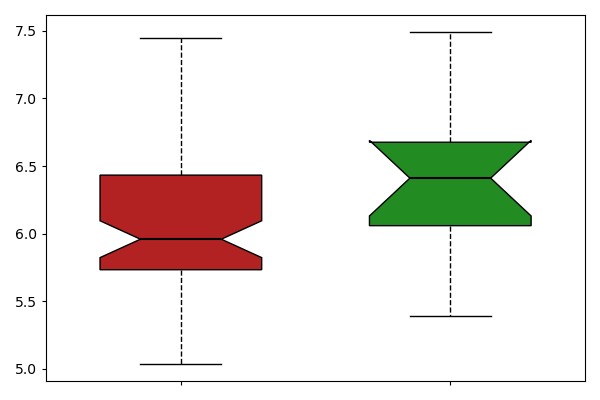
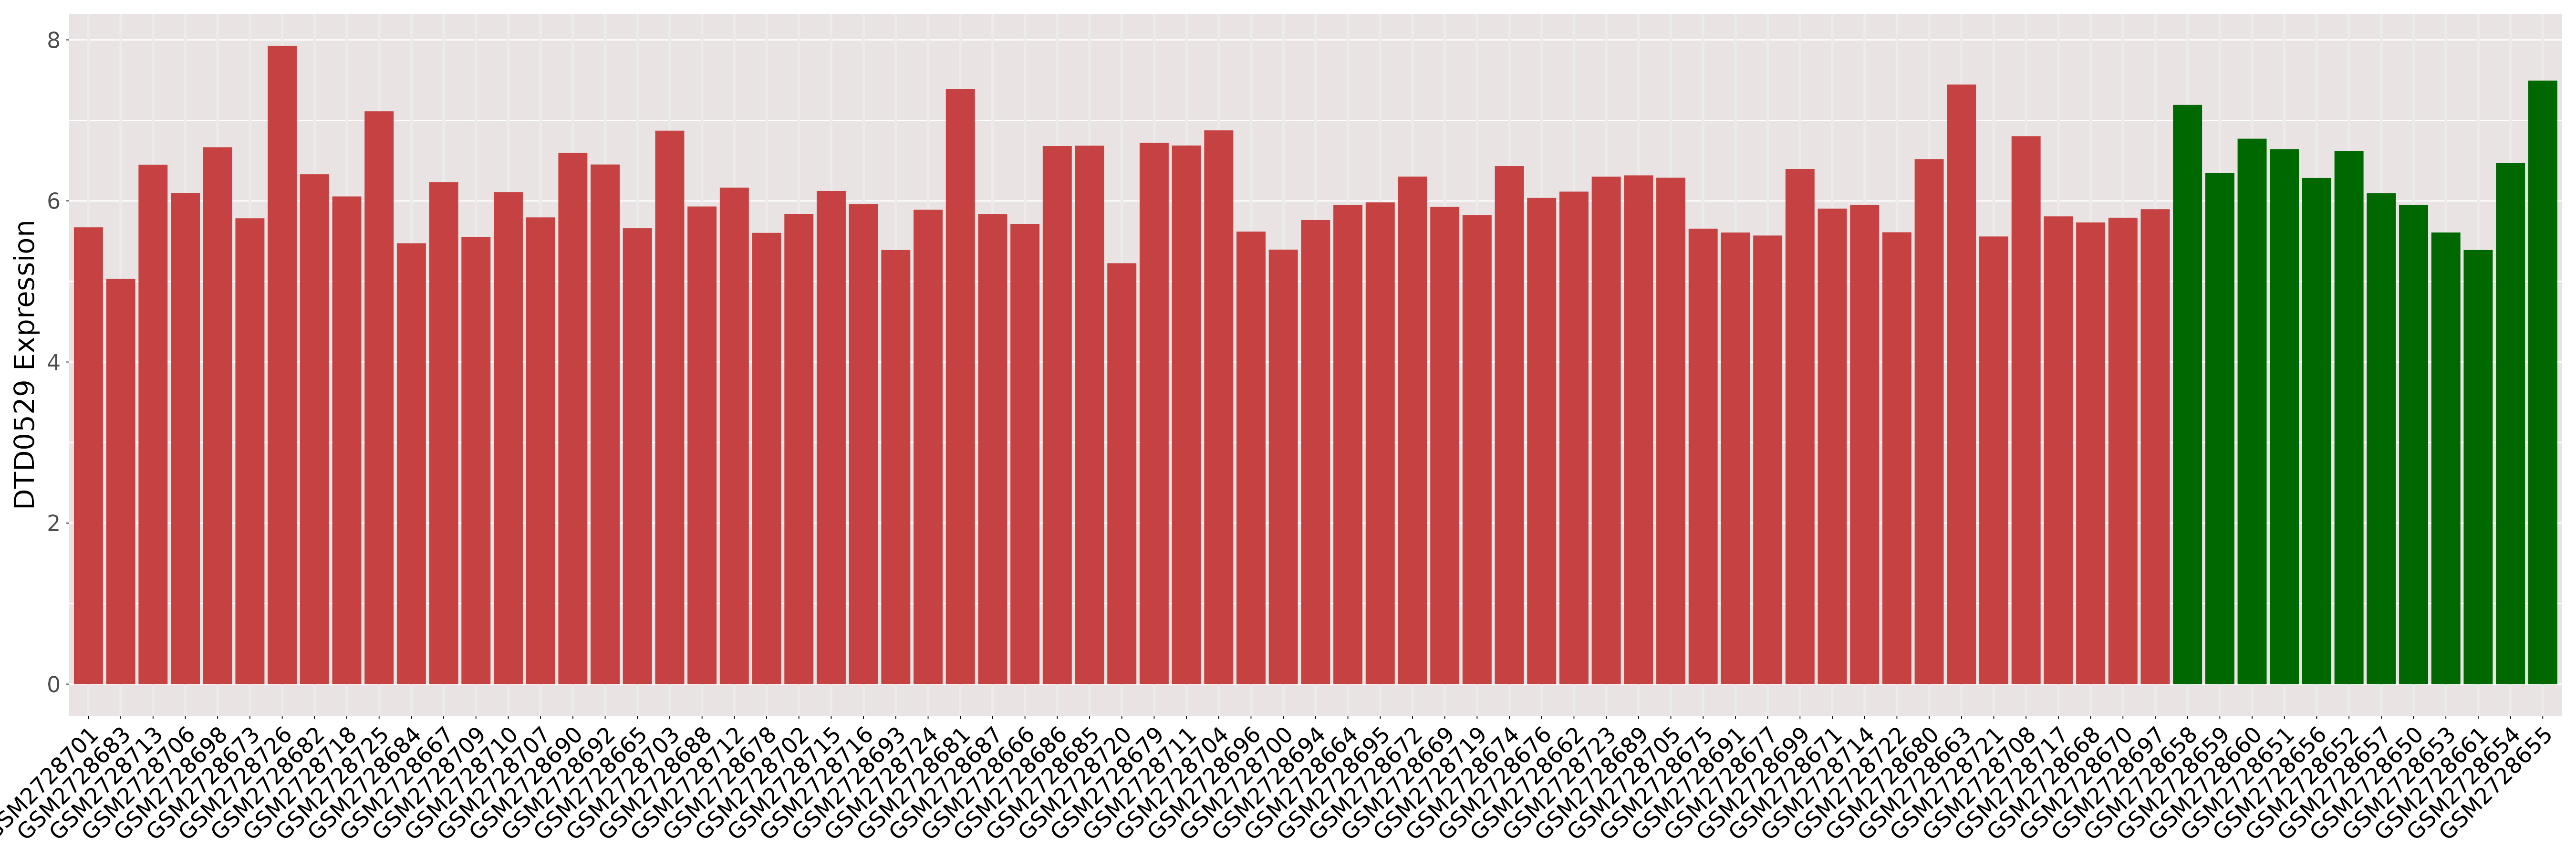
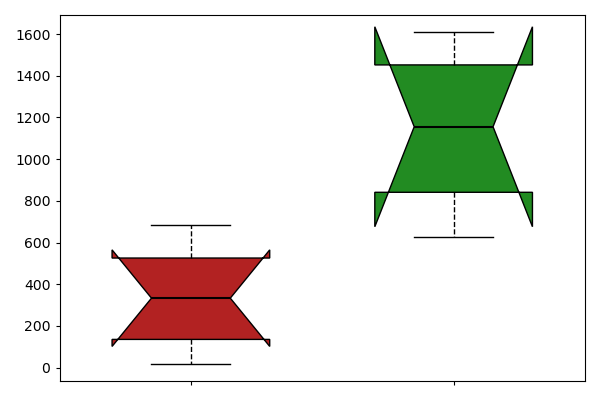
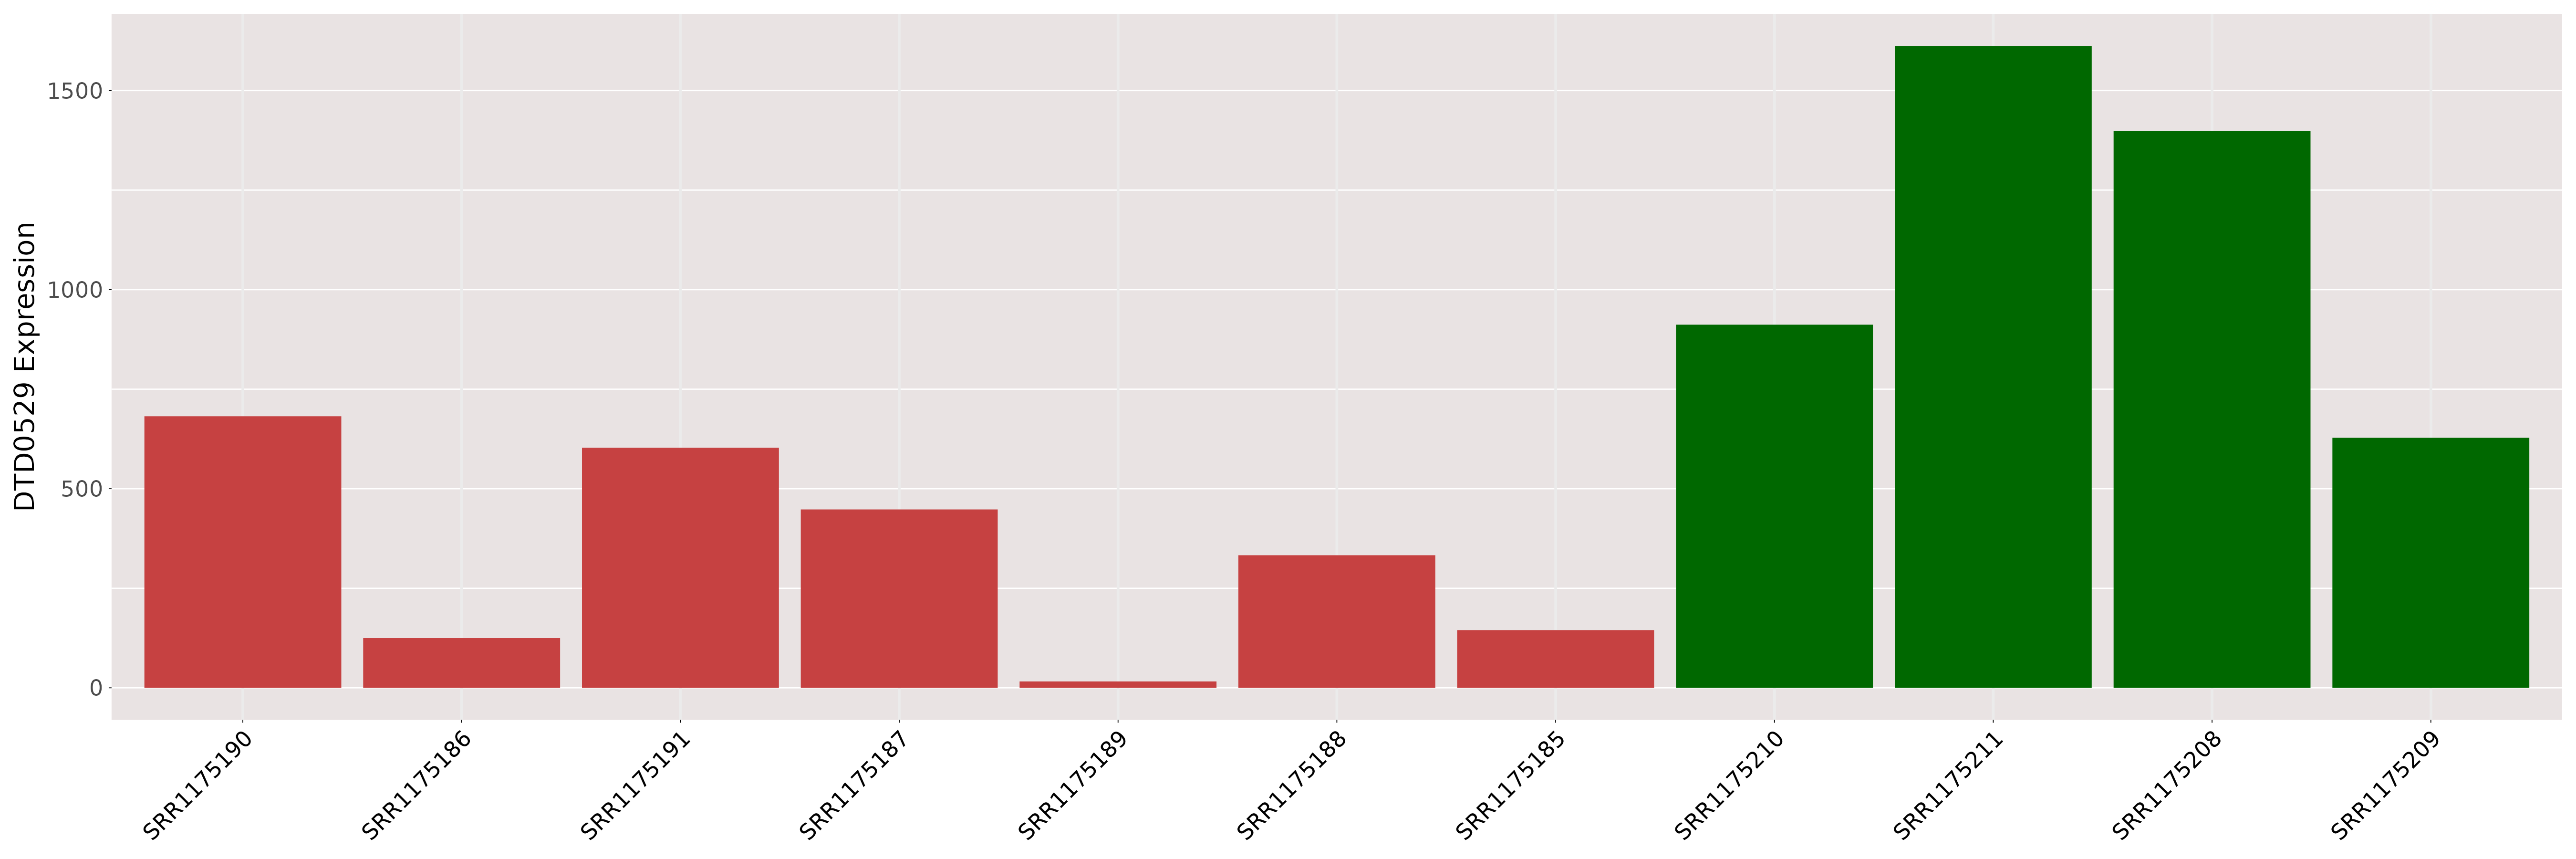
| [+] ICD-11: 2A00.10 Medulloblastoma | Click to Show/Hide the Full List | ||||
| The Studied Tissue | Brain | ||||
| The Specified Disease | Medulloblastoma [ICD-11:2A00.10] | ||||
| The Expression Level of Disease Section Compare with the Healthy Individual Tissue | p-value:0.0519233087428234; Fold-change:0.8925856126525491; Z-score:-0.972258574 | ||||
| DT expression in the diseased tissue of patients
DT expression in the normal tissue of healthy individuals
|
|||||
|
 Please Click the above Thumbnail to View/Download
the Expression Barchart for All Samples Please Click the above Thumbnail to View/Download
the Expression Barchart for All Samples
|
||||
| [+] ICD-11: 2A00.1Y Glioblastoma (other specified malignant neoplasm of brain) | Click to Show/Hide the Full List | ||||
| The Studied Tissue | Brain | ||||
| The Specified Disease | Glioblastoma [ICD-11:2A00.1Y] | ||||
| The Expression Level of Disease Section Compare with the Healthy Individual Tissue | p-value:0.2483775212185643; Fold-change:1.153765549255772; Z-score:1.1605972069428665 | ||||
| DT expression in the diseased tissue of patients
DT expression in the normal tissue of healthy individuals
|
|||||
|
 Please Click the above Thumbnail to View/Download
the Expression Barchart for All Samples Please Click the above Thumbnail to View/Download
the Expression Barchart for All Samples
|
||||
| [+] ICD-11: 2A00.1Y Large-cell medulloblastoma | Click to Show/Hide the Full List | ||||
| The Studied Tissue | Brain | ||||
| The Specified Disease | Medulloblastoma, large cell [ICD-11:2A00.10] | ||||
| The Expression Level of Disease Section Compare with the Healthy Individual Tissue | p-value:0.2496823677385015; Fold-change:0.8974513154755203; Z-score:-0.78569127 | ||||
| DT expression in the diseased tissue of patients
DT expression in the normal tissue of healthy individuals
|
|||||
|
 Please Click the above Thumbnail to View/Download
the Expression Barchart for All Samples Please Click the above Thumbnail to View/Download
the Expression Barchart for All Samples
|
||||
| [+] ICD-11: 2A00.1Y Primitive neuroectodermal tumor (PNET) | Click to Show/Hide the Full List | ||||
| The Studied Tissue | Brain | ||||
| The Specified Disease | Primitive neuroectodermal tumor [ICD-11:2A00.Y] | ||||
| The Expression Level of Disease Section Compare with the Healthy Individual Tissue | p-value:0.1056239463253144; Fold-change:1.181801023612158; Z-score:1.7878506028707348 | ||||
| DT expression in the diseased tissue of patients
DT expression in the normal tissue of healthy individuals
|
|||||
|
 Please Click the above Thumbnail to View/Download
the Expression Barchart for All Samples Please Click the above Thumbnail to View/Download
the Expression Barchart for All Samples
|
||||
| [+] ICD-11: 2A82.0 Chronic lymphocytic leukaemia of B-cell type | Click to Show/Hide the Full List | ||||
| The Studied Tissue | Blood | ||||
| The Specified Disease | Cll [ICD-11:2A82.00] | ||||
| The Expression Level of Disease Section Compare with the Healthy Individual Tissue | p-value:0.58515104687258; Fold-change:0.9970959513768174; Z-score:-0.157570932 | ||||
| DT expression in the diseased tissue of patients
DT expression in the normal tissue of healthy individuals
|
|||||
|
 Please Click the above Thumbnail to View/Download
the Expression Barchart for All Samples Please Click the above Thumbnail to View/Download
the Expression Barchart for All Samples
|
||||
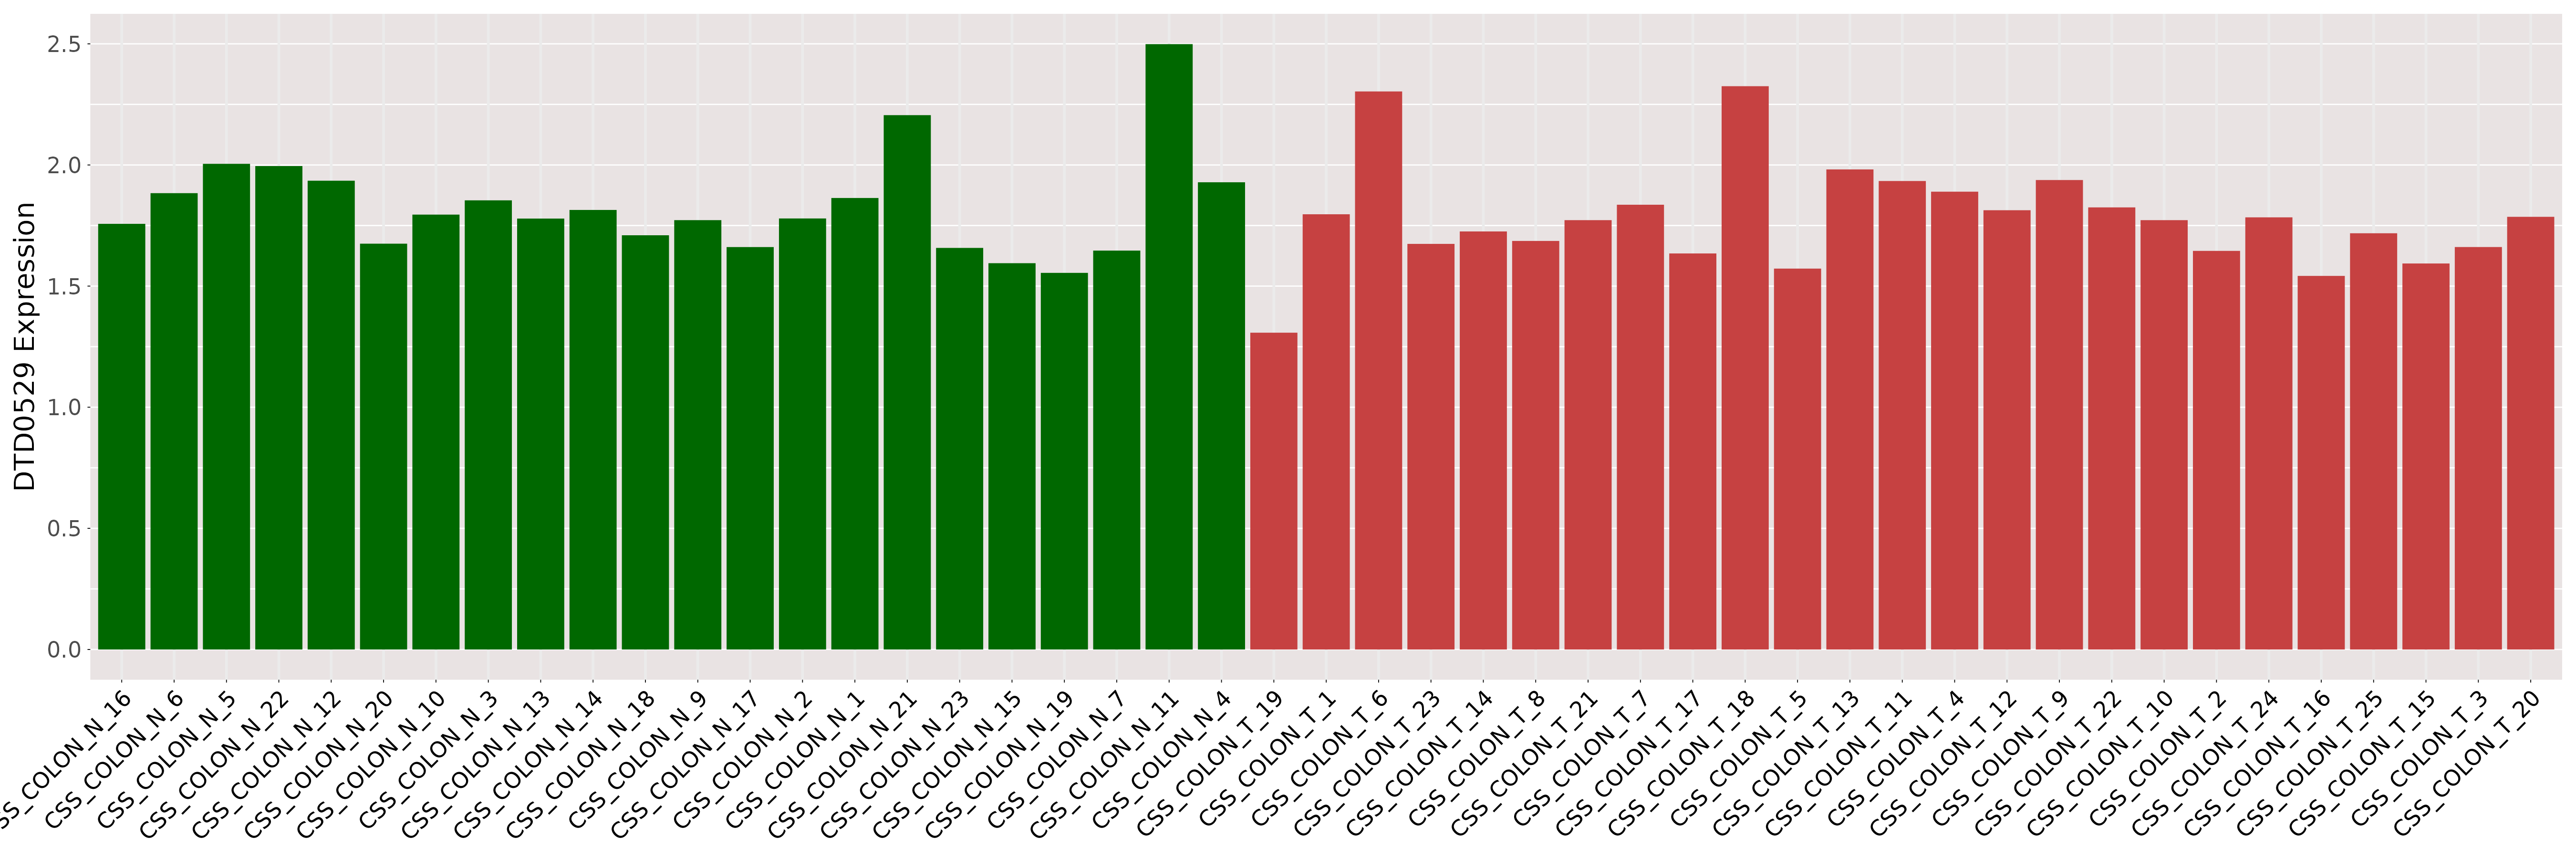
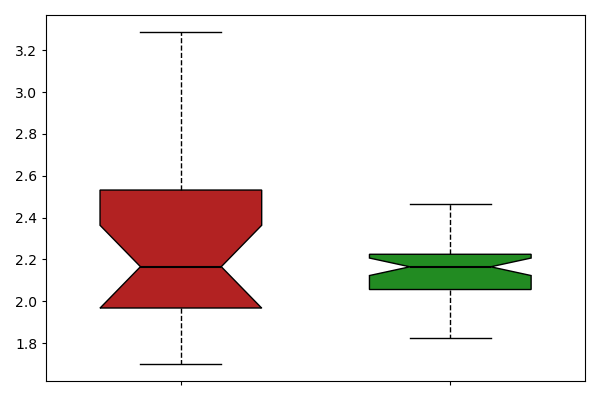
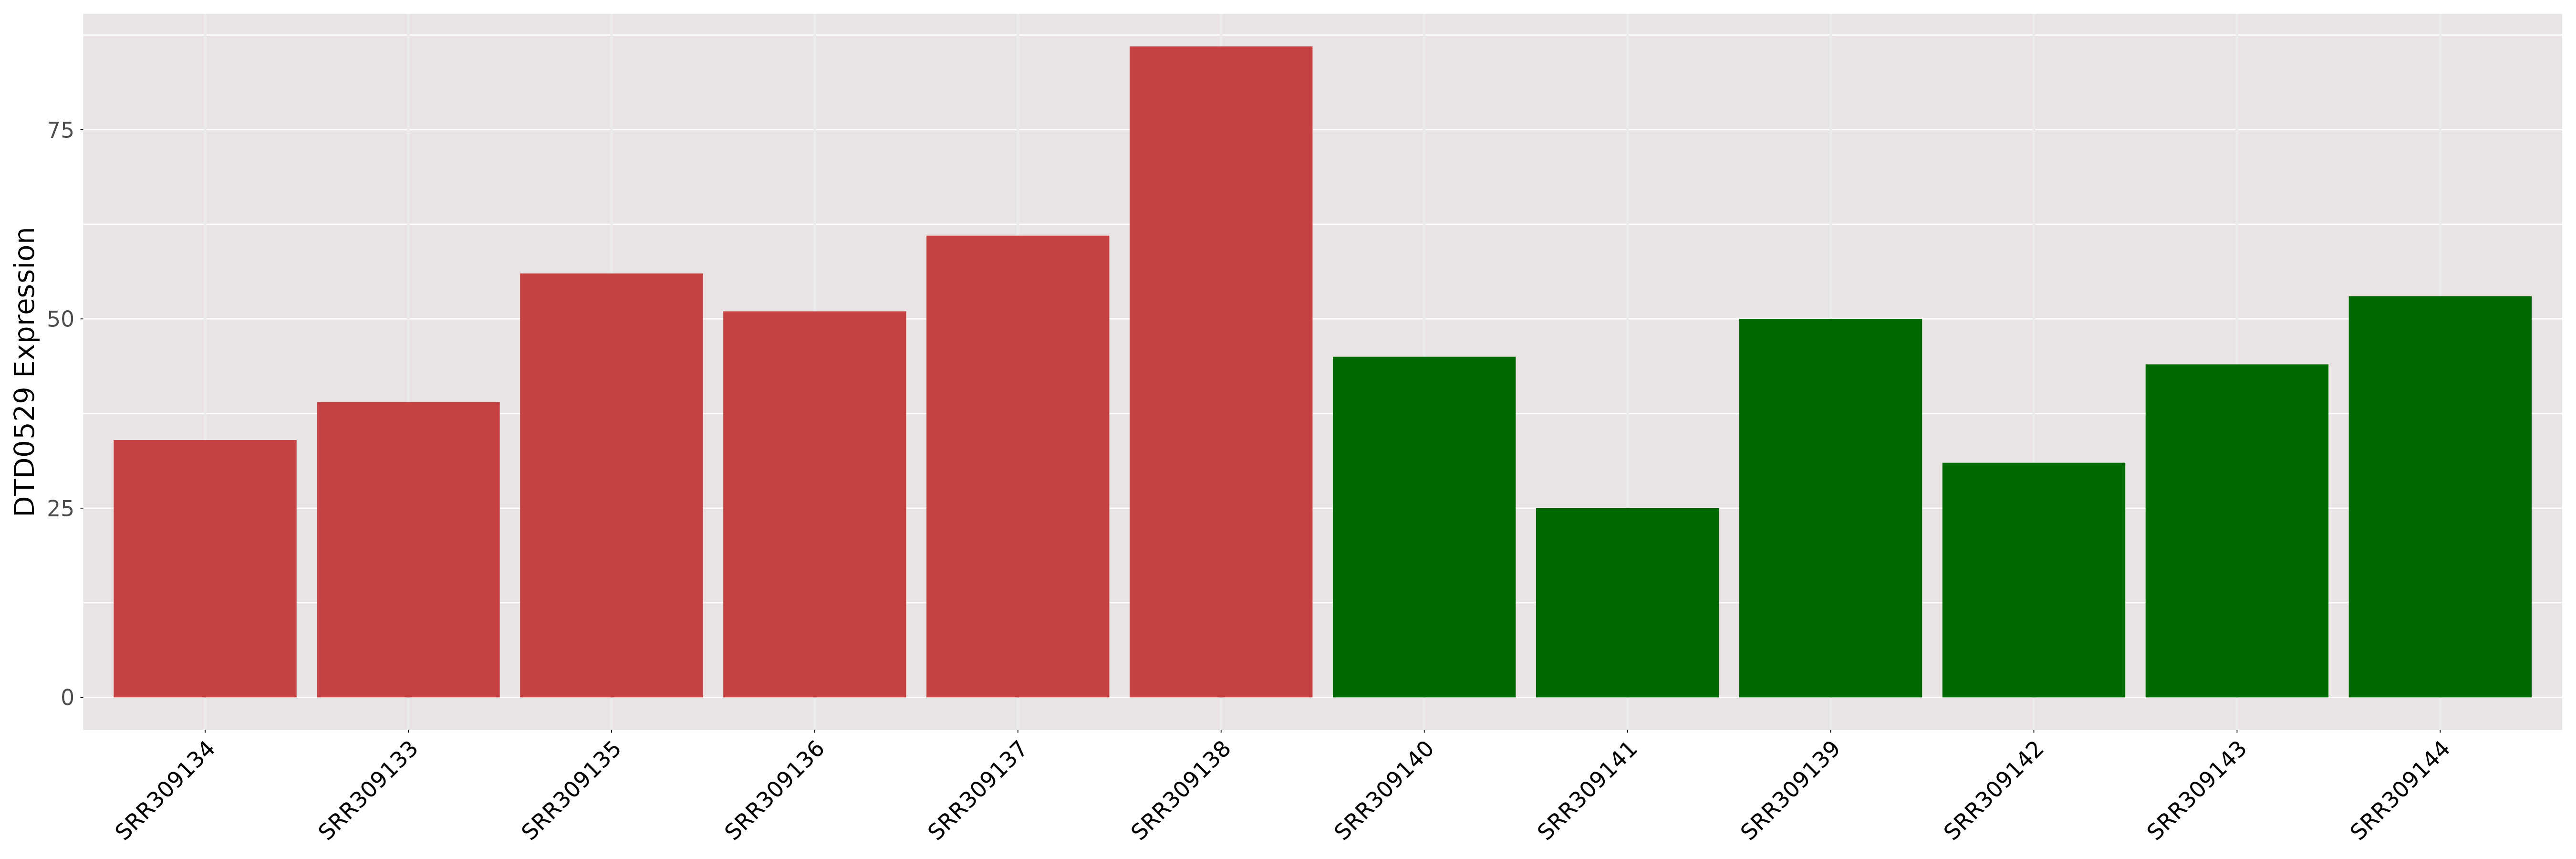
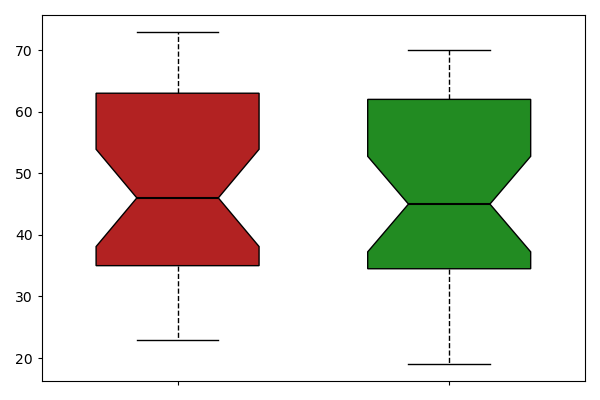
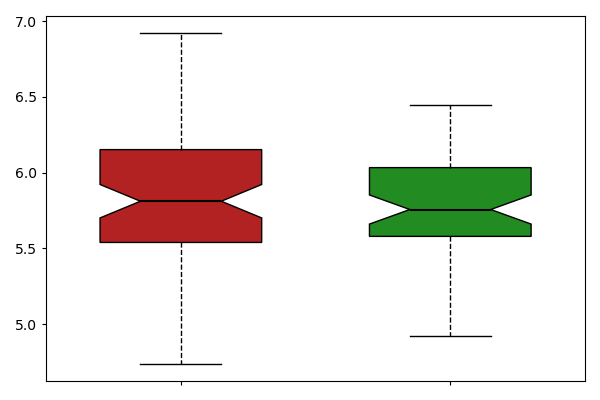
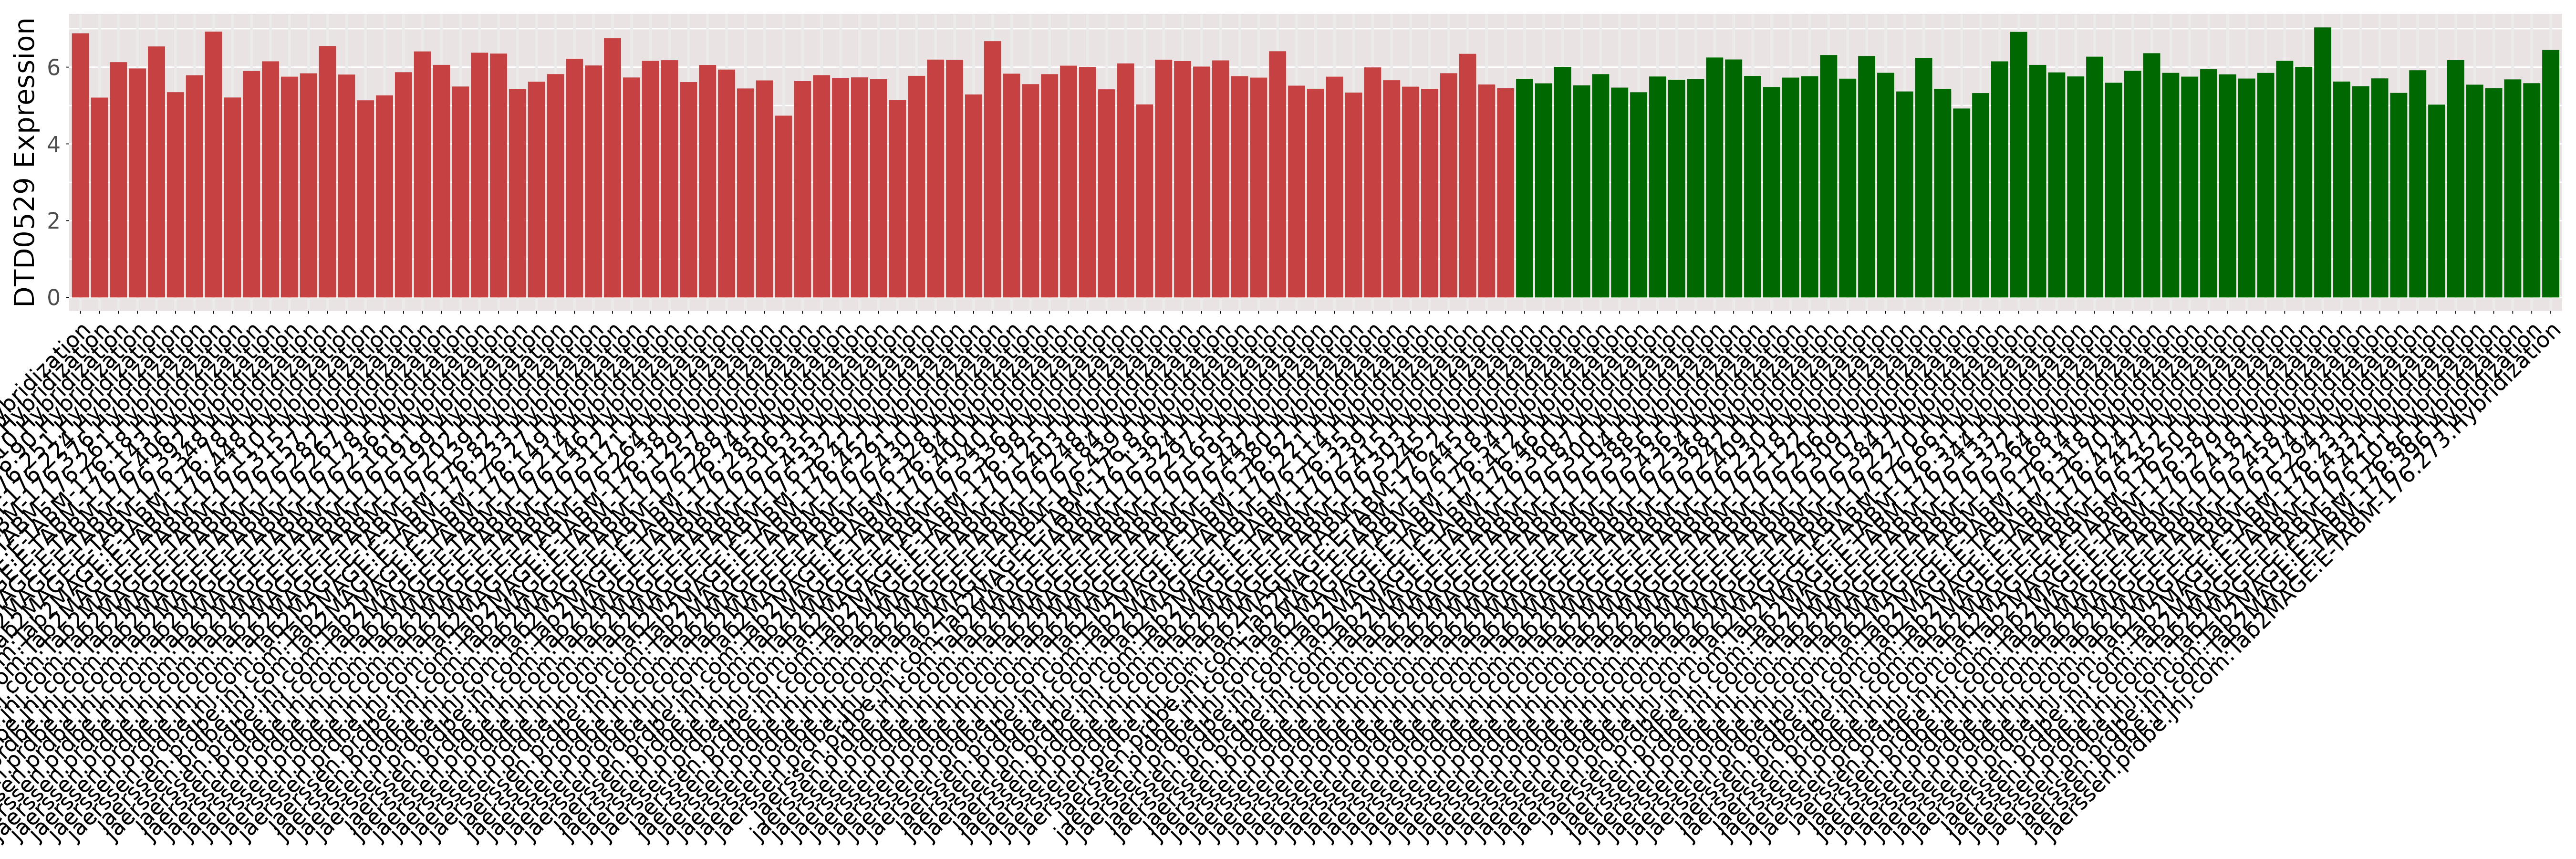
| [+] ICD-11: 2B91 Colorectal adenocarcinoma | Click to Show/Hide the Full List | ||||
| The Studied Tissue | Colon | ||||
| The Specified Disease | Colorectal adenocarcinoma [ICD-11:2B91] | ||||
| The Expression Level of Disease Section Compare with the Healthy Individual Tissue | p-value:0.3920910995276985; Fold-change:0.9916573829424497; Z-score:-0.254680462 | ||||
| DT expression in the diseased tissue of patients
DT expression in the normal tissue of healthy individuals
|
|||||
|
 Please Click the above Thumbnail to View/Download
the Expression Barchart for All Samples Please Click the above Thumbnail to View/Download
the Expression Barchart for All Samples
|
||||
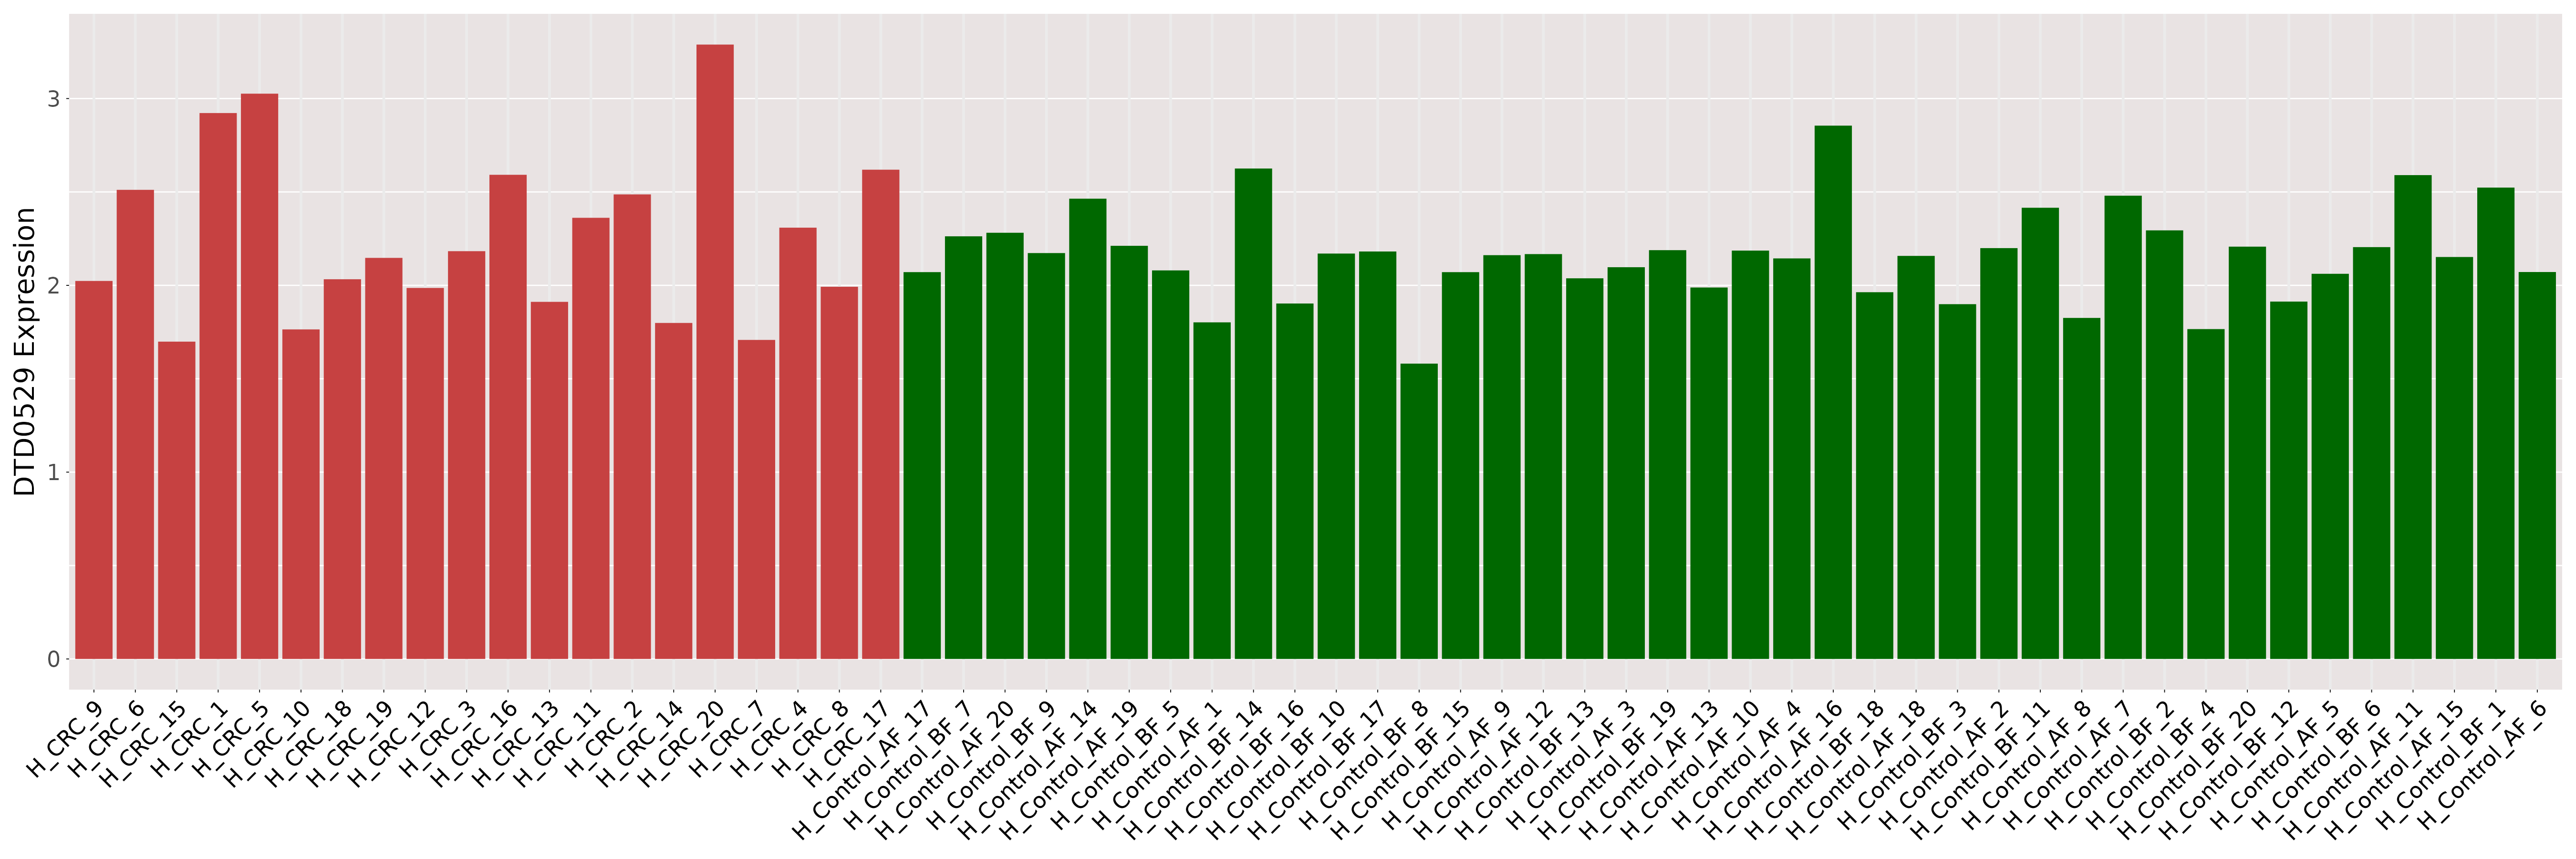
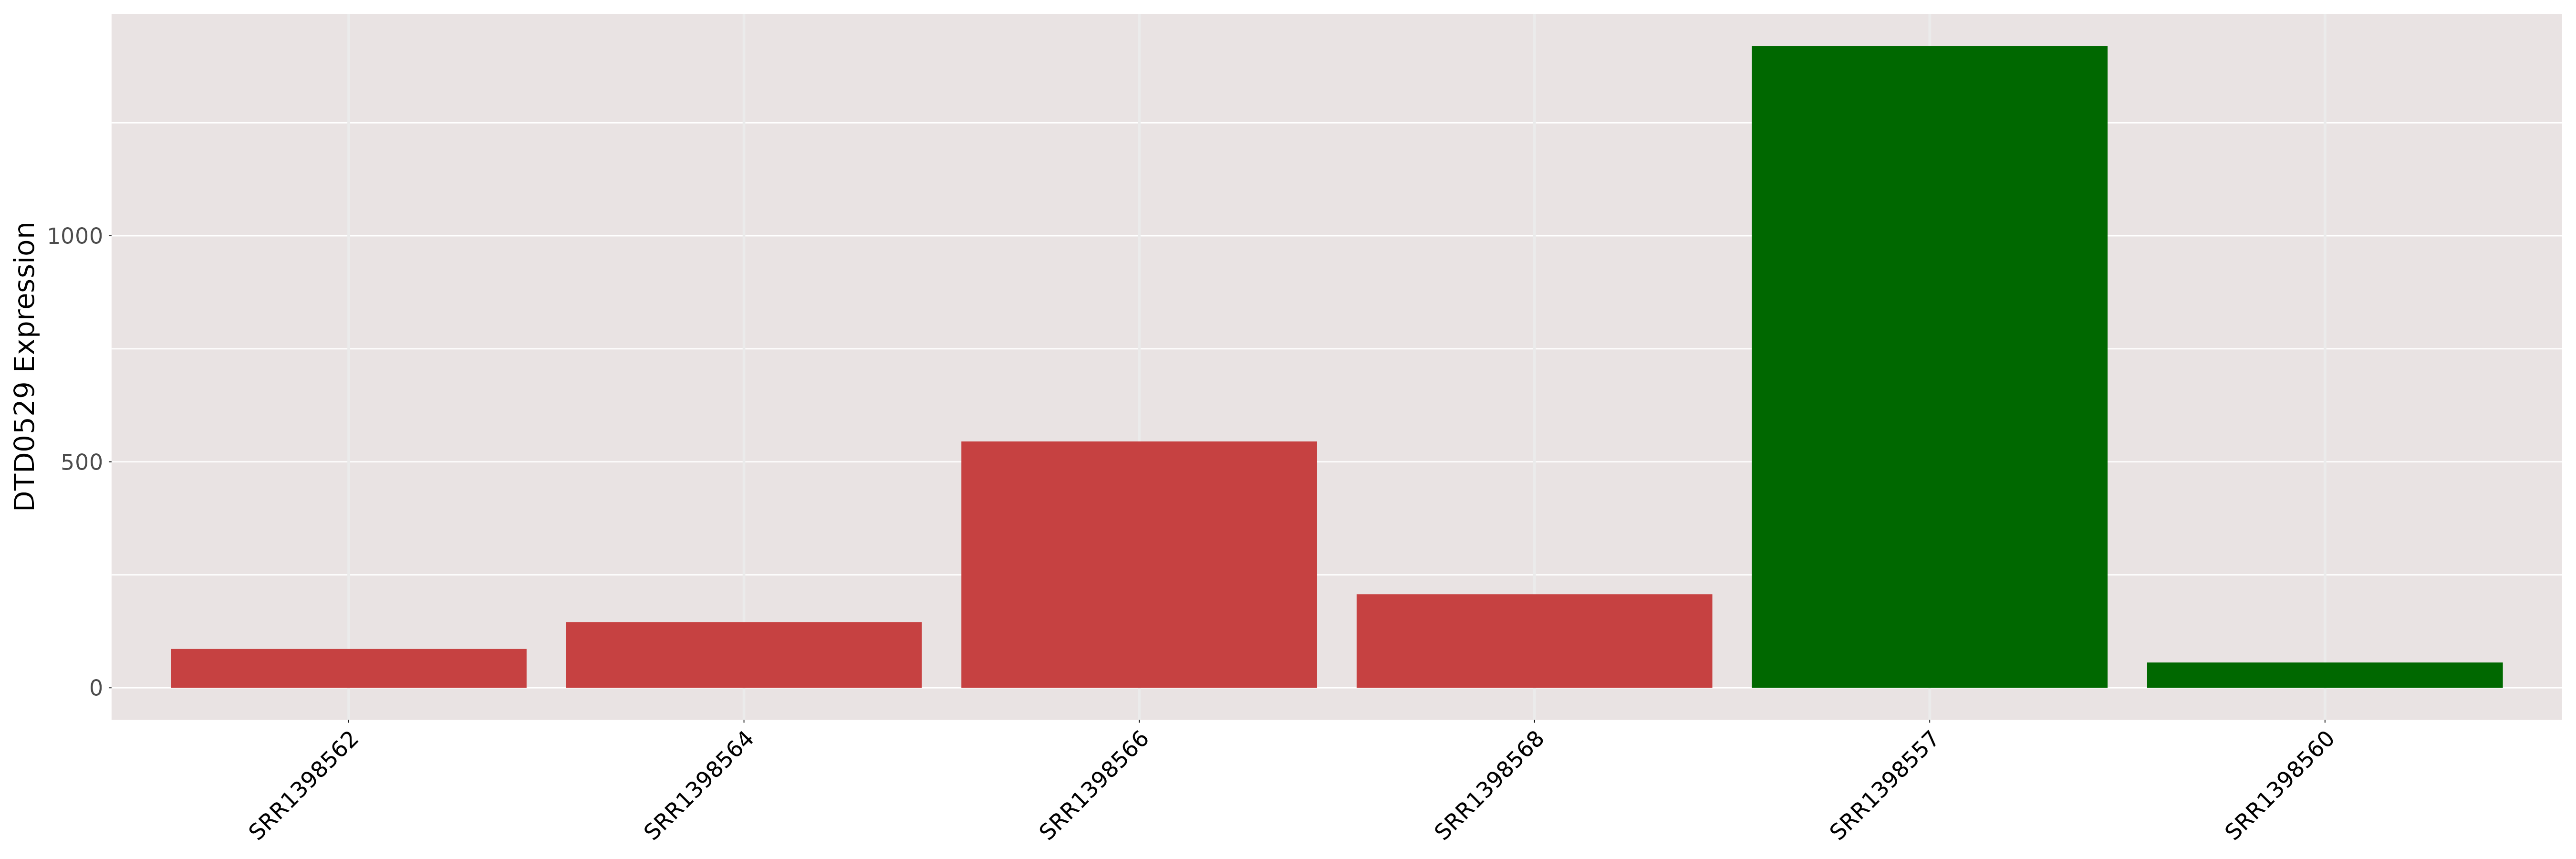
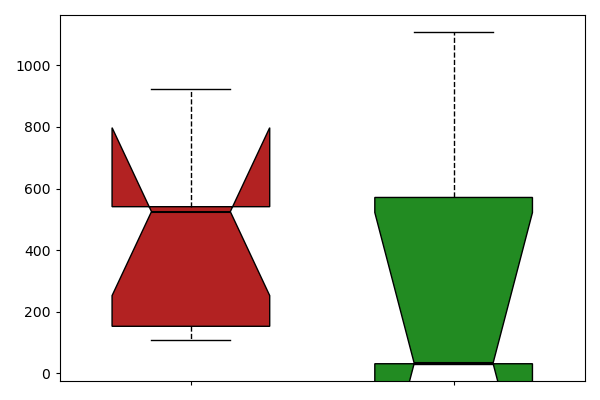
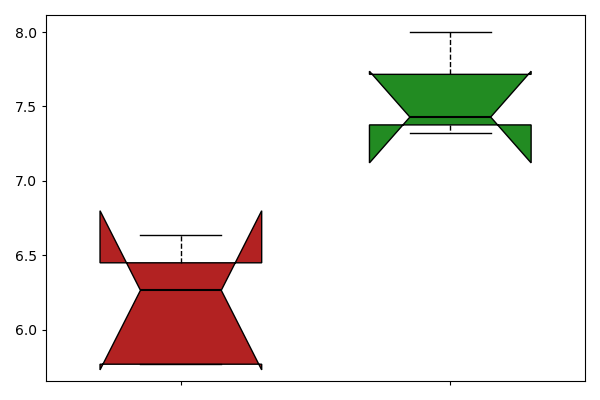
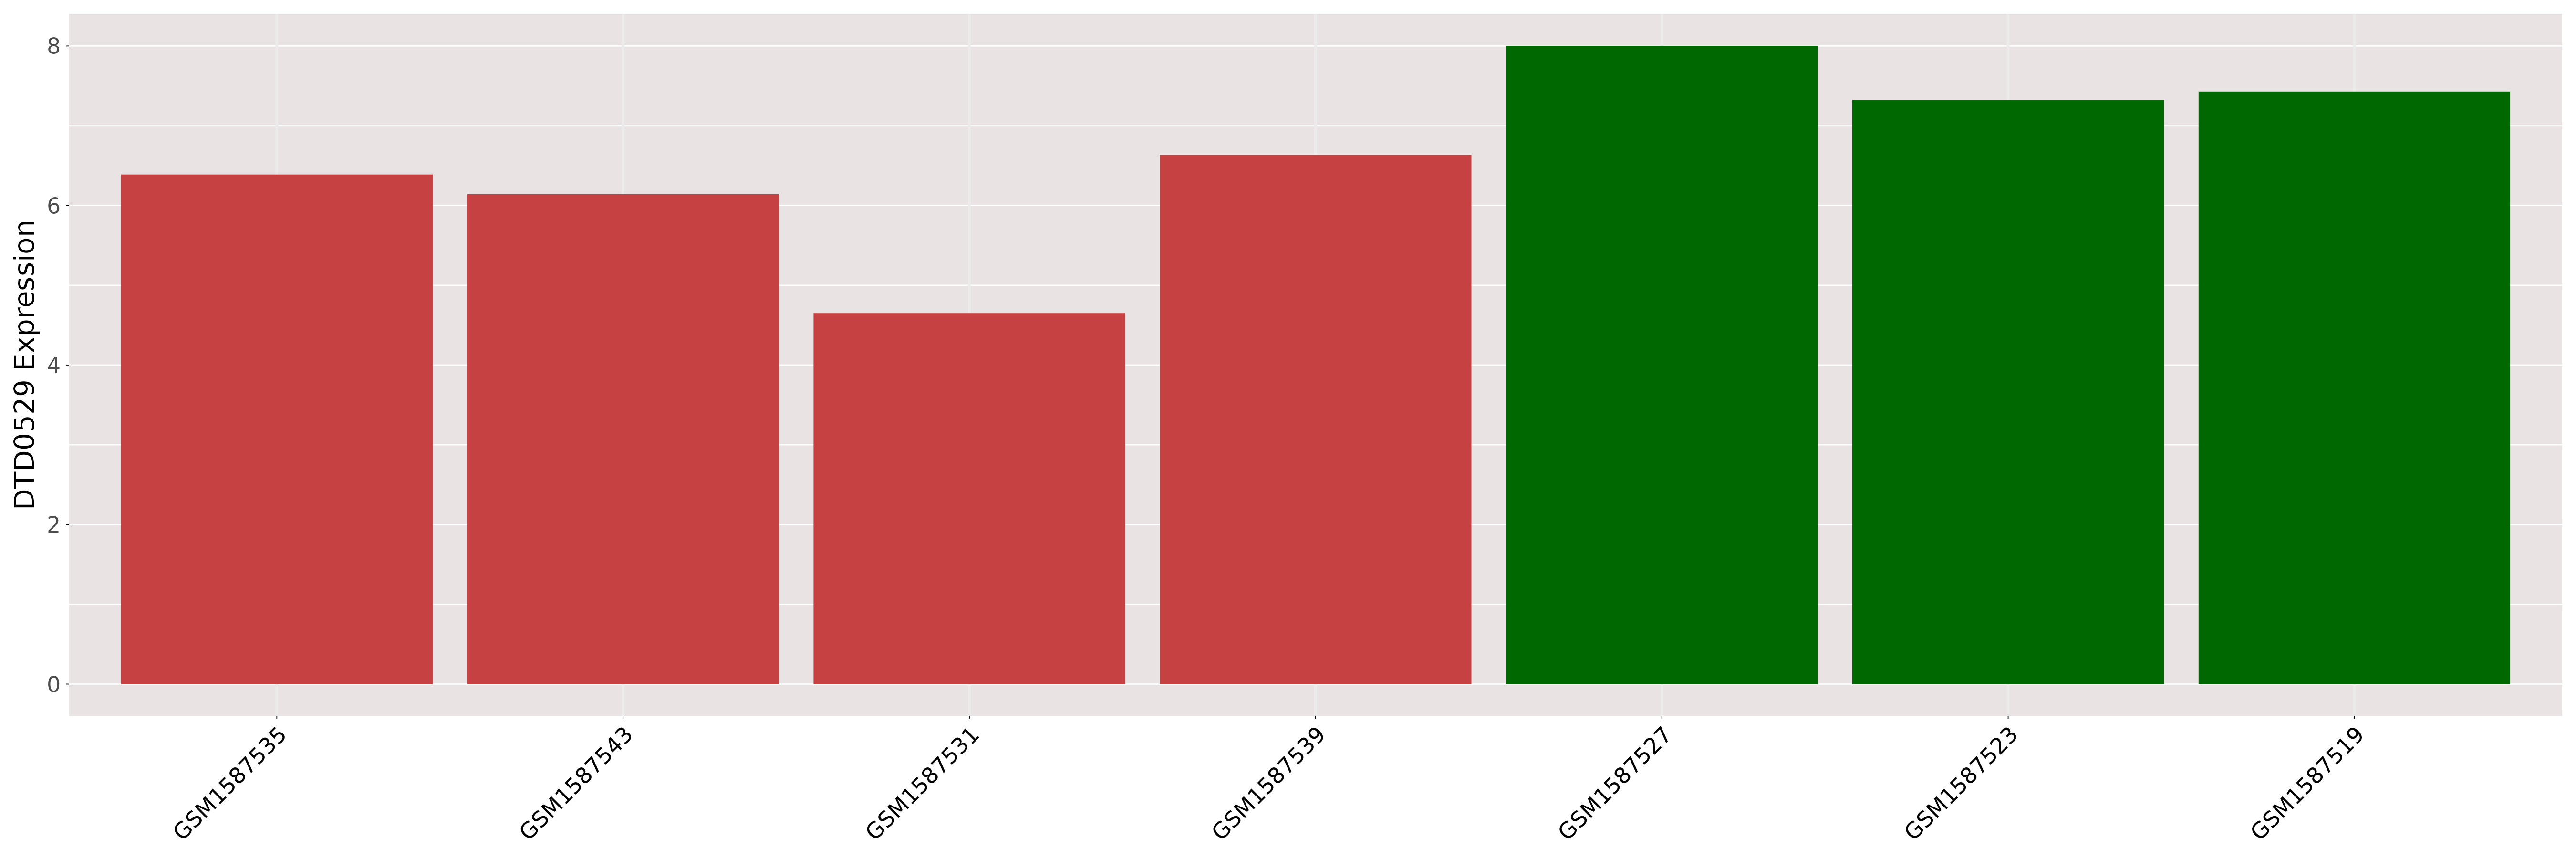
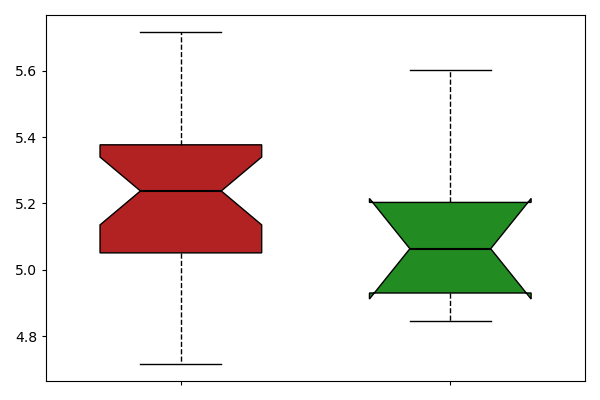
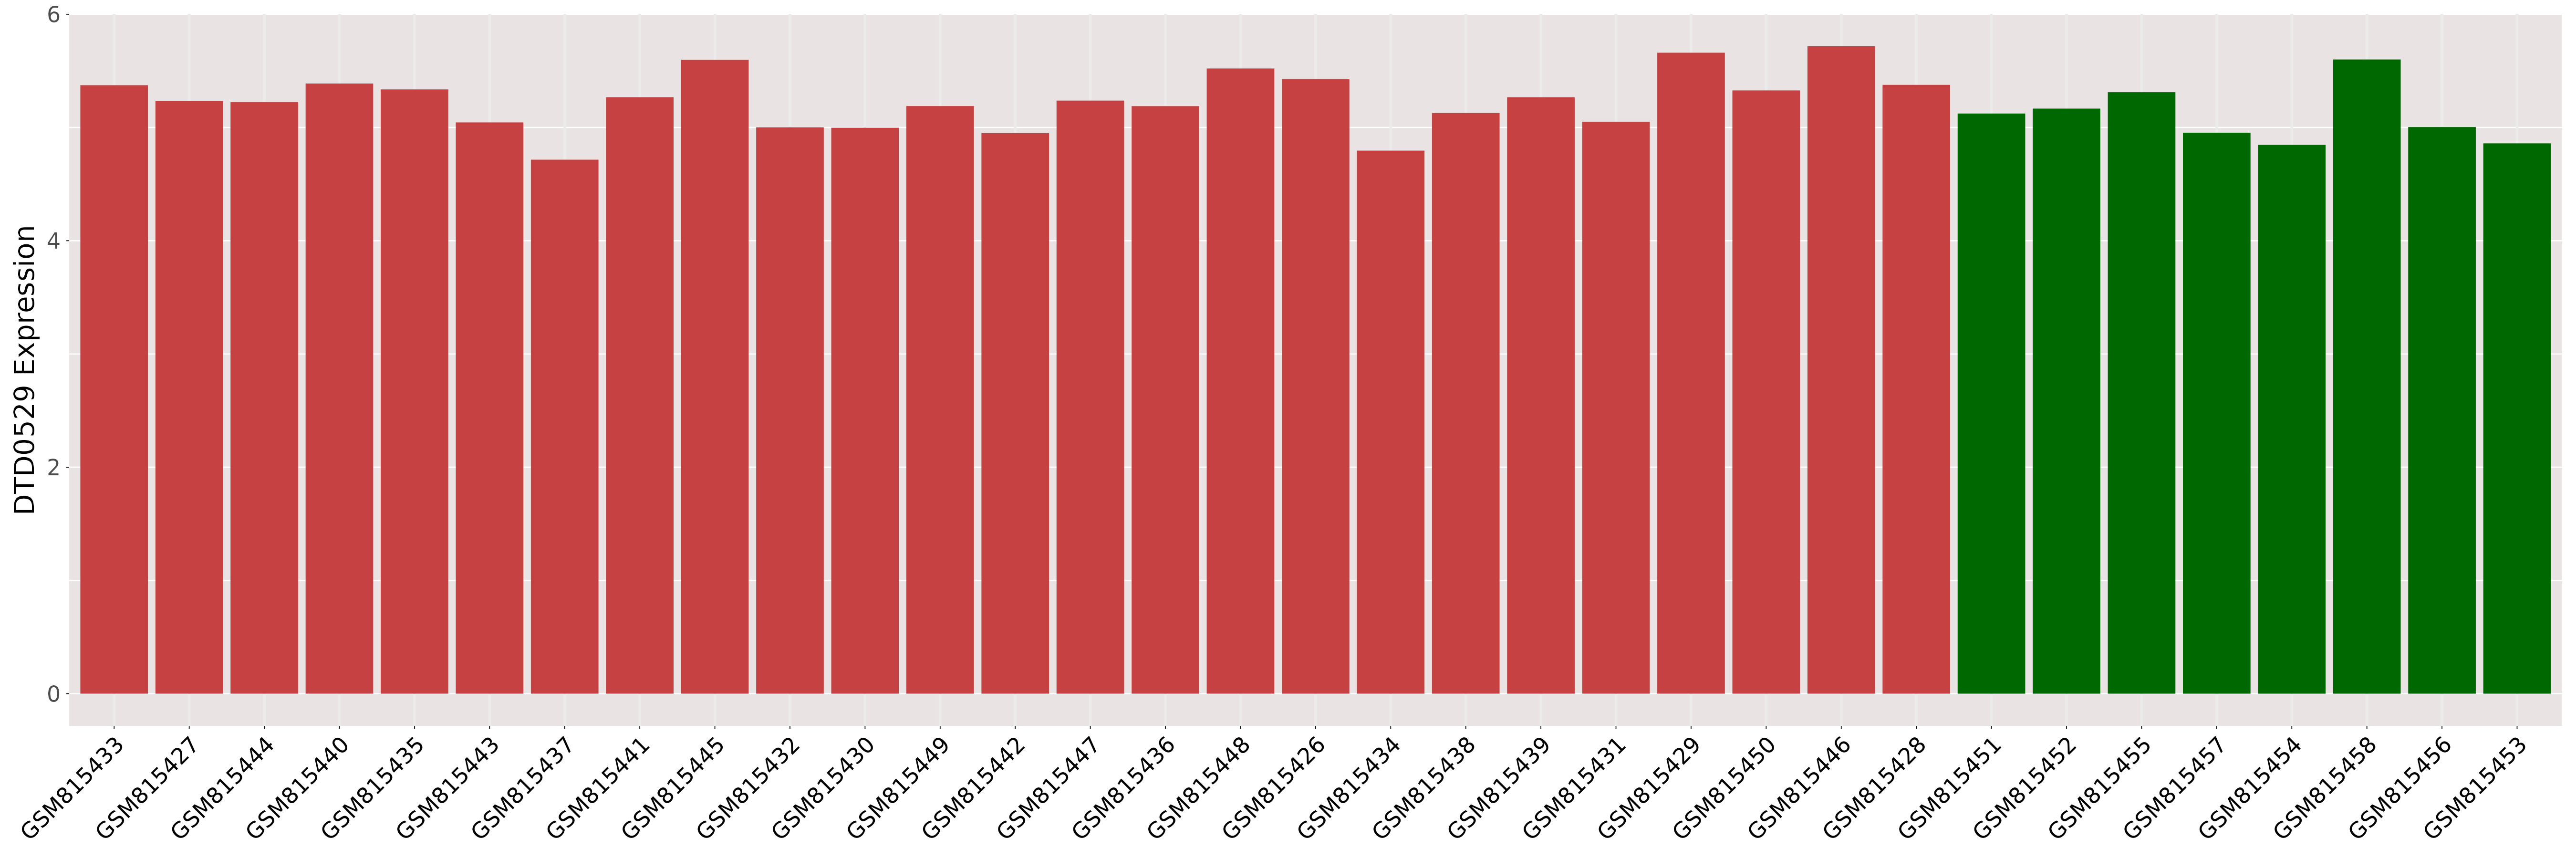
| [+] ICD-11: 2B91 Colorectal carcinoma (colorectal cancer) | Click to Show/Hide the Full List | ||||
| The Studied Tissue | Blood | ||||
| The Specified Disease | Colorectal cancer [ICD-11:2B91] | ||||
| The Expression Level of Disease Section Compare with the Healthy Individual Tissue | p-value:0.2388096577906764; Fold-change:1.0002453732986063; Z-score:0.4347465104093542 | ||||
| DT expression in the diseased tissue of patients
DT expression in the normal tissue of healthy individuals
|
|||||
|
 Please Click the above Thumbnail to View/Download
the Expression Barchart for All Samples Please Click the above Thumbnail to View/Download
the Expression Barchart for All Samples
|
||||
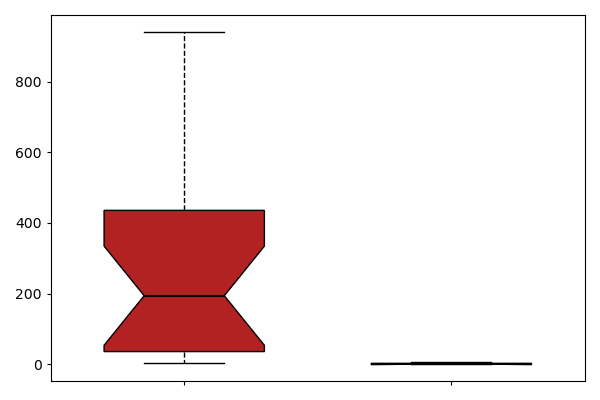
| The Studied Tissue | Colon | ||||
| The Specified Disease | Colorectal cancer [ICD-11:2B91] | ||||
| The Expression Level of Disease Section Compare with the Healthy Individual Tissue | p-value:0.0122322740463028; Fold-change:inf; Z-score:90.32663013966376 | ||||
| DT expression in the diseased tissue of patients
DT expression in the normal tissue of healthy individuals
|
|||||
|
 Please Click the above Thumbnail to View/Download
the Expression Barchart for All Samples Please Click the above Thumbnail to View/Download
the Expression Barchart for All Samples
|
||||
| [+] ICD-11: 2C10 Malignant neoplasm of pancreas (ductal adenocarcinoma) | Click to Show/Hide the Full List | ||||
| The Studied Tissue | Liver | ||||
| The Specified Disease | Primary pancreatic ductal adenocarcinoma [ICD-11:2C10] | ||||
| The Expression Level of Disease Section Compare with the Healthy Individual Tissue | p-value:0.6515103871675905; Fold-change:1.004491163427958; Z-score:1.806595024606501 | ||||
| DT expression in the diseased tissue of patients
DT expression in the normal tissue of healthy individuals
|
|||||
|
 Please Click the above Thumbnail to View/Download
the Expression Barchart for All Samples Please Click the above Thumbnail to View/Download
the Expression Barchart for All Samples
|
||||
| The Studied Tissue | Pancreas | ||||
| The Specified Disease | Primary pancreatic ductal adenocarcinoma [ICD-11:2C10] | ||||
| The Expression Level of Disease Section Compare with the Healthy Individual Tissue | p-value:0.8671080850154915; Fold-change:1.0011785500010593; Z-score:0.1598407106353302 | ||||
| DT expression in the diseased tissue of patients
DT expression in the normal tissue of healthy individuals
|
|||||
|
 Please Click the above Thumbnail to View/Download
the Expression Barchart for All Samples Please Click the above Thumbnail to View/Download
the Expression Barchart for All Samples
|
||||
| [+] ICD-11: 2C25 Malignant neoplasms of bronchus or lung | Click to Show/Hide the Full List | ||||
| The Studied Tissue | Saliva | ||||
| The Specified Disease | Lung cancer [ICD-11:2C25] | ||||
| The Expression Level of Disease Section Compare with the Healthy Individual Tissue | p-value:0.561043075087112; Fold-change:1.038541662615822; Z-score:0.27609412440555 | ||||
| DT expression in the diseased tissue of patients
DT expression in the normal tissue of healthy individuals
|
|||||
|
 Please Click the above Thumbnail to View/Download
the Expression Barchart for All Samples Please Click the above Thumbnail to View/Download
the Expression Barchart for All Samples
|
||||
| [+] ICD-11: 2C25.0 Adenocarcinoma of bronchus or lung | Click to Show/Hide the Full List | ||||
| The Studied Tissue | Blood | ||||
| The Specified Disease | Lung adenocarcinoma [ICD-11:2C25] | ||||
| The Expression Level of Disease Section Compare with the Healthy Individual Tissue | p-value:0.4830621321543186; Fold-change:1.0089498608274214; Z-score:0.1119604855711483 | ||||
| DT expression in the diseased tissue of patients
DT expression in the normal tissue of healthy individuals
|
|||||
|
 Please Click the above Thumbnail to View/Download
the Expression Barchart for All Samples Please Click the above Thumbnail to View/Download
the Expression Barchart for All Samples
|
||||
| The Studied Tissue | Lung | ||||
| The Specified Disease | Lung adenocarcinoma [ICD-11:2C25] | ||||
| The Expression Level of Disease Section Compare with the Healthy Individual Tissue | p-value:0.0460686748961423; Fold-change:0.9634985084915106; Z-score:-0.834872739 | ||||
| DT expression in the diseased tissue of patients
DT expression in the normal tissue of healthy individuals
|
|||||
|
 Please Click the above Thumbnail to View/Download
the Expression Barchart for All Samples Please Click the above Thumbnail to View/Download
the Expression Barchart for All Samples
|
||||
| The Studied Tissue | Lung | ||||
| The Specified Disease | Lung adenocarcinomas [ICD-11:2C25] | ||||
| The Expression Level of Disease Section Compare with the Healthy Individual Tissue | p-value:0.8903185006353171; Fold-change:0.9875742374918712; Z-score:-0.098199545 | ||||
| DT expression in the diseased tissue of patients
DT expression in the normal tissue of healthy individuals
|
|||||
|
 Please Click the above Thumbnail to View/Download
the Expression Barchart for All Samples Please Click the above Thumbnail to View/Download
the Expression Barchart for All Samples
|
||||
| [+] ICD-11: 2C25.0Z Non-small cell carcinoma of lung, unspecified | Click to Show/Hide the Full List | ||||
| The Studied Tissue | Lung | ||||
| The Specified Disease | Non small cell lung cancer [ICD-11:2C25] | ||||
| The Expression Level of Disease Section Compare with the Healthy Individual Tissue | p-value:0.0075762011290065; Fold-change:0.994561000408953; Z-score:1.9251053571040544 | ||||
| DT expression in the diseased tissue of patients
DT expression in the normal tissue of healthy individuals
|
|||||
|
 Please Click the above Thumbnail to View/Download
the Expression Barchart for All Samples Please Click the above Thumbnail to View/Download
the Expression Barchart for All Samples
|
||||
| [+] ICD-11: 2C25.1 Small cell carcinoma of bronchus or lung | Click to Show/Hide the Full List | ||||
| The Studied Tissue | Lung | ||||
| The Specified Disease | Small cell lung carcinoma [ICD-11:2C25] | ||||
| The Expression Level of Disease Section Compare with the Healthy Individual Tissue | p-value:0.9823995374543084; Fold-change:0.4276729559748428; Z-score:0.0213135521177338 | ||||
| DT expression in the diseased tissue of patients
DT expression in the normal tissue of healthy individuals
|
|||||
|
 Please Click the above Thumbnail to View/Download
the Expression Barchart for All Samples Please Click the above Thumbnail to View/Download
the Expression Barchart for All Samples
|
||||
| [+] ICD-11: 2C31 Squamous cell carcinoma of skin | Click to Show/Hide the Full List | ||||
| The Studied Tissue | Skin | ||||
| The Specified Disease | Squamous cell carcinoma [ICD-11:2C31.Z] | ||||
| The Expression Level of Disease Section Compare with the Healthy Individual Tissue | p-value:5.4653771917296544e-08; Fold-change:0.0641447368421052; Z-score:-6.438382399 | ||||
| DT expression in the diseased tissue of patients
DT expression in the normal tissue of healthy individuals
|
|||||

|
 Please Click the above Thumbnail to View/Download
the Expression Barchart for All Samples Please Click the above Thumbnail to View/Download
the Expression Barchart for All Samples
|
||||
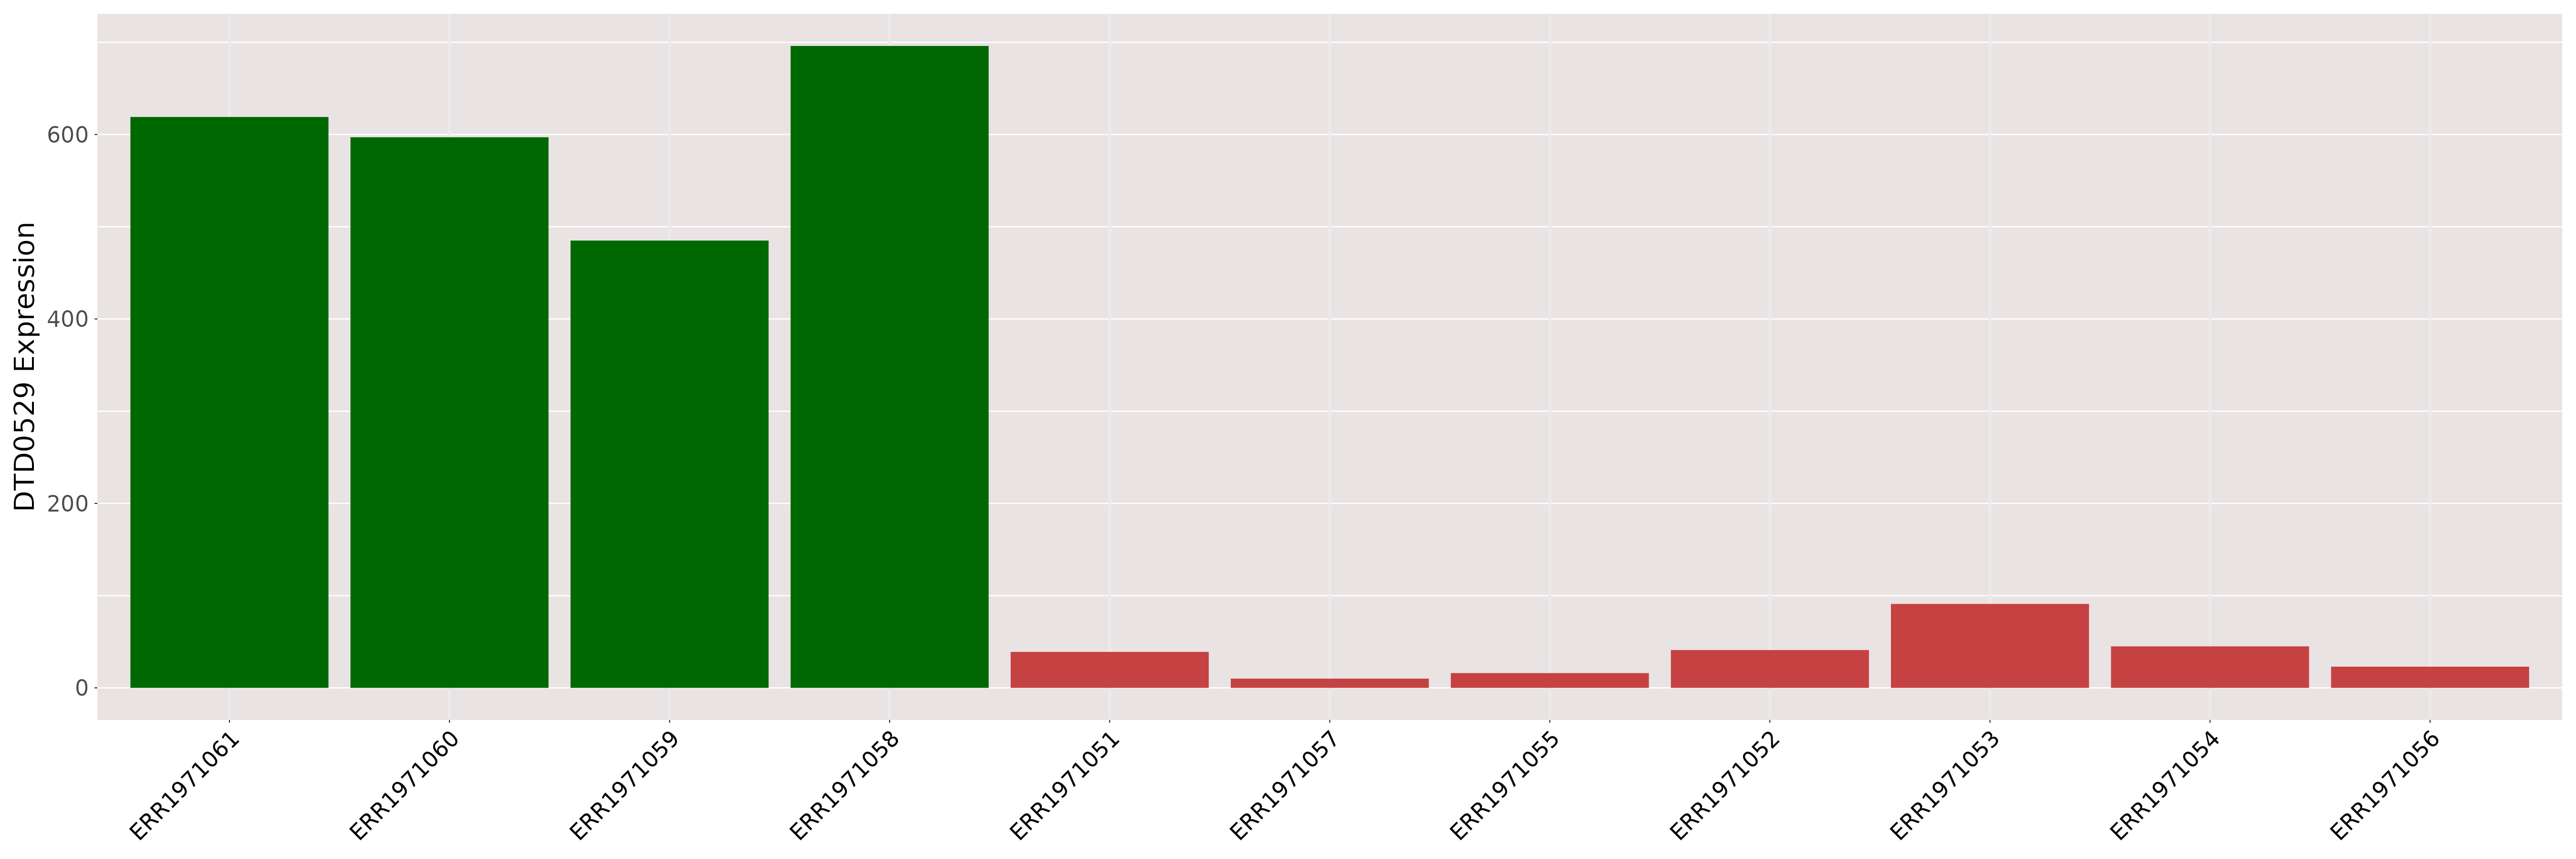
| [+] ICD-11: 2C90 Malignant neoplasm of kidney, except renal pelvis (clear cell type) | Click to Show/Hide the Full List | ||||
| The Studied Tissue | Kidney | ||||
| The Specified Disease | Clear cell renal carcinomas [ICD-11:2C90] | ||||
| The Expression Level of Disease Section Compare with the Healthy Individual Tissue | p-value:0.5668039026124649; Fold-change:0.930727825421504; Z-score:-0.39068204 | ||||
| DT expression in the diseased tissue of patients
DT expression in the normal tissue of healthy individuals
|
|||||
|
|
|
||||
| [+] ICD-11: 2C90.0 Renal cell carcinoma of kidney, except renal pelvis (chromophobe type) | Click to Show/Hide the Full List | ||||
| The Studied Tissue | Kidney | ||||
| The Specified Disease | Chromophobe renal cell carcinoma [ICD-11:2C90.Y] | ||||
| The Expression Level of Disease Section Compare with the Healthy Individual Tissue | p-value:0.4855609867826215; Fold-change:0.9899182958555874; Z-score:-0.6634086 | ||||
| DT expression in the diseased tissue of patients
DT expression in the normal tissue of healthy individuals
|
|||||
|
 Please Click the above Thumbnail to View/Download
the Expression Barchart for All Samples Please Click the above Thumbnail to View/Download
the Expression Barchart for All Samples
|
||||
| [+] ICD-11: 2C90.0 Renal cell carcinoma of kidney, except renal pelvis (papillary type) | Click to Show/Hide the Full List | ||||
| The Studied Tissue | Kidney | ||||
| The Specified Disease | Papillary renal cell carcinoma [ICD-11:2C90.Y] | ||||
| The Expression Level of Disease Section Compare with the Healthy Individual Tissue | p-value:0.9165376364633576; Fold-change:0.9917049677536358; Z-score:-0.077045807 | ||||
| DT expression in the diseased tissue of patients
DT expression in the normal tissue of healthy individuals
|
|||||
|
 Please Click the above Thumbnail to View/Download
the Expression Barchart for All Samples Please Click the above Thumbnail to View/Download
the Expression Barchart for All Samples
|
||||
| [+] ICD-11: 2C90.Y Nephroblastoma (Wilms tumor) | Click to Show/Hide the Full List | ||||
| The Studied Tissue | Kidney | ||||
| The Specified Disease | Nephroblastoma [ICD-11:2C90.Y] | ||||
| The Expression Level of Disease Section Compare with the Healthy Individual Tissue | p-value:0.20362731583226; Fold-change:1.0775828767691438; Z-score:2.1975245161417822 | ||||
| DT expression in the diseased tissue of patients
DT expression in the normal tissue of healthy individuals
|
|||||
|
 Please Click the above Thumbnail to View/Download
the Expression Barchart for All Samples Please Click the above Thumbnail to View/Download
the Expression Barchart for All Samples
|
||||
| [+] ICD-11: 2C94.2 Urothelial carcinoma of bladder | Click to Show/Hide the Full List | ||||
| The Studied Tissue | Bladder | ||||
| The Specified Disease | Urothelial carcinoma [ICD-11:2C94.2] | ||||
| The Expression Level of Disease Section Compare with the Healthy Individual Tissue | p-value:0.6437809218846521; Fold-change:1.0104091425945358; Z-score:1.462197426809441 | ||||
| DT expression in the diseased tissue of patients
DT expression in the normal tissue of healthy individuals
|
|||||
|
 Please Click the above Thumbnail to View/Download
the Expression Barchart for All Samples Please Click the above Thumbnail to View/Download
the Expression Barchart for All Samples
|
||||
| [+] ICD-11: 2E86.0 Leiomyoma of uterus (uterine fibroid) | Click to Show/Hide the Full List | ||||
| The Studied Tissue | Uterus | ||||
| The Specified Disease | Uterine fibroid [ICD-11:2E86.0] | ||||
| The Expression Level of Disease Section Compare with the Healthy Individual Tissue | p-value:0.0407066671373871; Fold-change:1.1465558969282144; Z-score:4.801141024830274 | ||||
| DT expression in the diseased tissue of patients
DT expression in the normal tissue of healthy individuals
|
|||||
|
 Please Click the above Thumbnail to View/Download
the Expression Barchart for All Samples Please Click the above Thumbnail to View/Download
the Expression Barchart for All Samples
|
||||
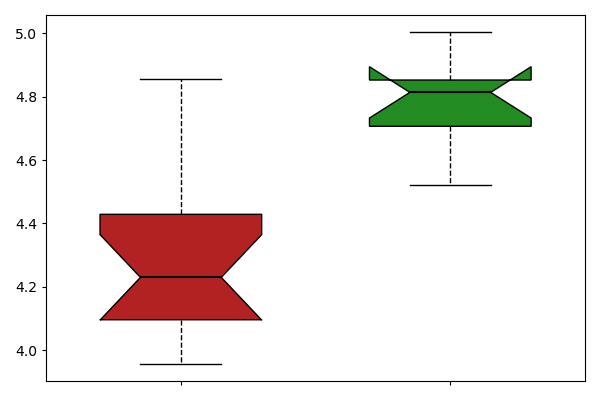
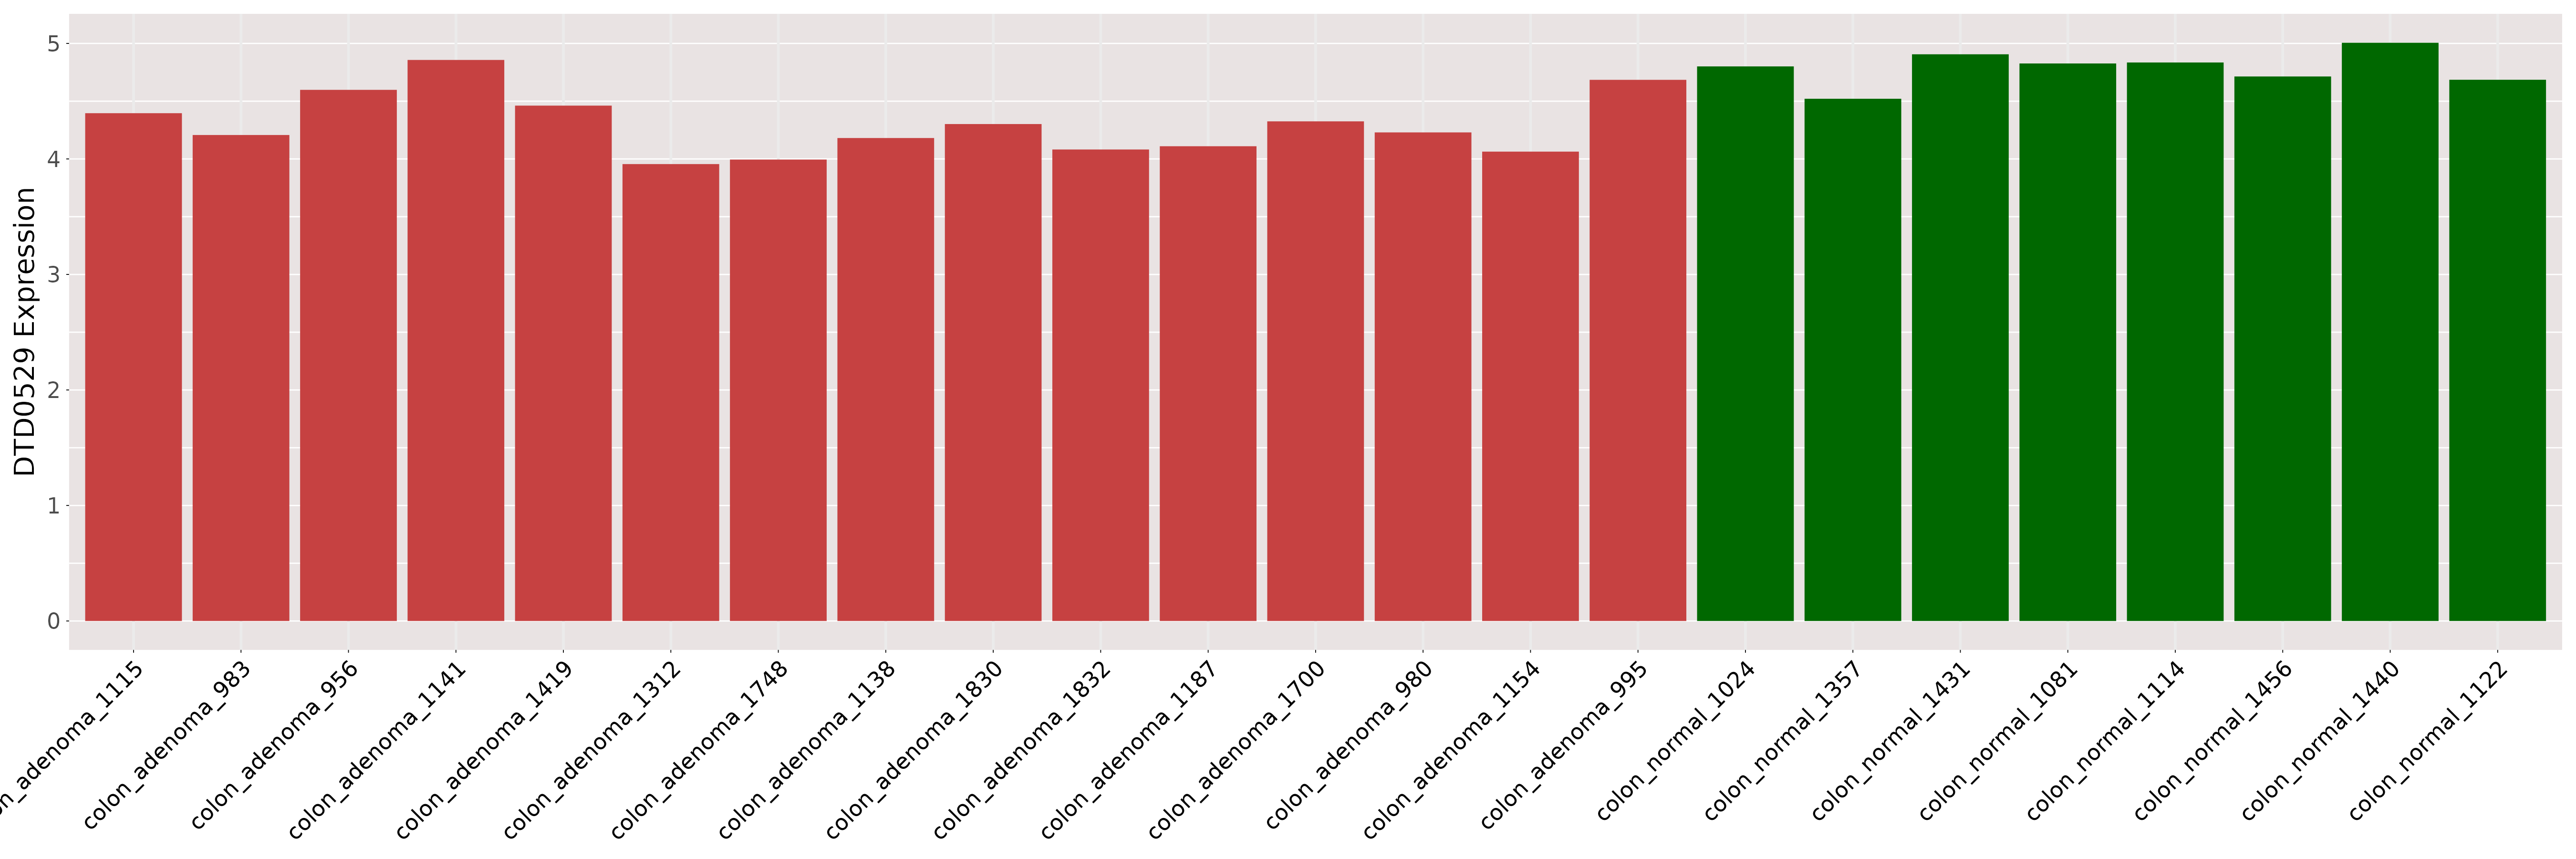
| [+] ICD-11: 2F32.0 Adenoma of colon (benign colon polyp) | Click to Show/Hide the Full List | ||||
| The Studied Tissue | Colon | ||||
| The Specified Disease | Colon adenoma [ICD-11:2F32.0] | ||||
| The Expression Level of Disease Section Compare with the Healthy Individual Tissue | p-value:8.32845279257535e-05; Fold-change:0.878659945548583; Z-score:-3.322656086 | ||||
| DT expression in the diseased tissue of patients
DT expression in the normal tissue of healthy individuals
|
|||||
|
 Please Click the above Thumbnail to View/Download
the Expression Barchart for All Samples Please Click the above Thumbnail to View/Download
the Expression Barchart for All Samples
|
||||
| [+] ICD-11: 2F92 Benign neoplasm of kidney (renal oncocytoma) | Click to Show/Hide the Full List | ||||
| The Studied Tissue | Kidney | ||||
| The Specified Disease | Kidney oncocytoma [ICD-11:2F92] | ||||
| The Expression Level of Disease Section Compare with the Healthy Individual Tissue | p-value:0.0803035328789556; Fold-change:1.0823818901349864; Z-score:1.424397881335149 | ||||
| DT expression in the diseased tissue of patients
DT expression in the normal tissue of healthy individuals
|
|||||
|
 Please Click the above Thumbnail to View/Download
the Expression Barchart for All Samples Please Click the above Thumbnail to View/Download
the Expression Barchart for All Samples
|
||||
| ICD-11: 04 Disease of the immune system | |||||
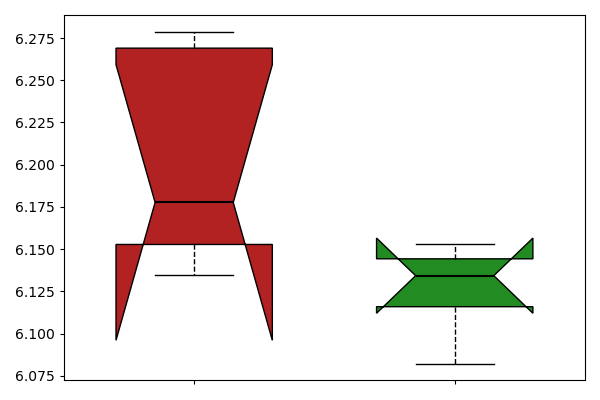
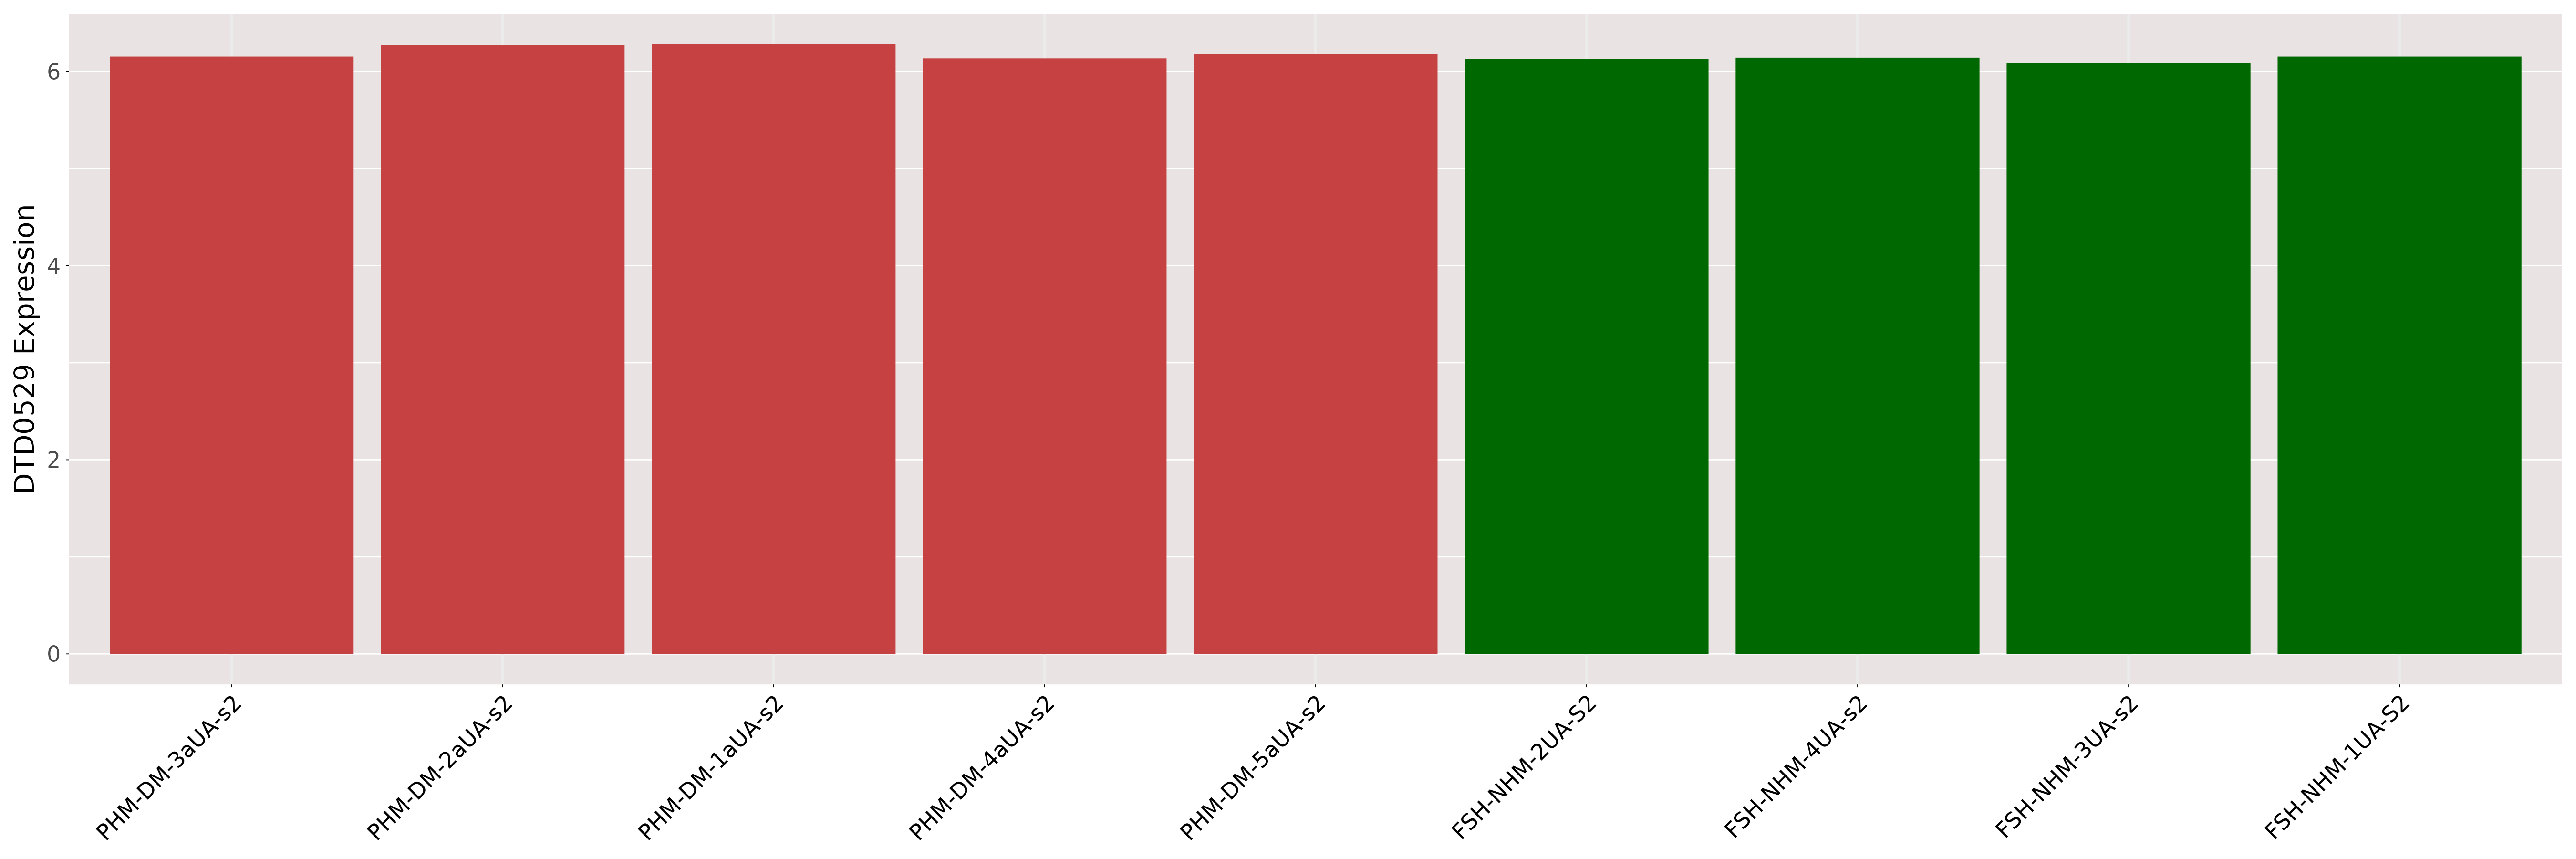
| [+] ICD-11: 4A41.0 Dermatomyositis | Click to Show/Hide the Full List | ||||
| The Studied Tissue | Skeletal muscle | ||||
| The Specified Disease | Dermatomyositis [ICD-11:4A41.00] | ||||
| The Expression Level of Disease Section Compare with the Healthy Individual Tissue | p-value:0.0745913762035919; Fold-change:1.0070633593595857; Z-score:2.4768310722232 | ||||
| DT expression in the diseased tissue of patients
DT expression in the normal tissue of healthy individuals
|
|||||
|
 Please Click the above Thumbnail to View/Download
the Expression Barchart for All Samples Please Click the above Thumbnail to View/Download
the Expression Barchart for All Samples
|
||||
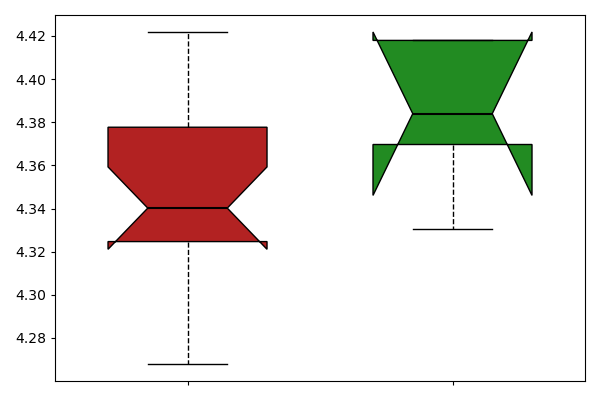
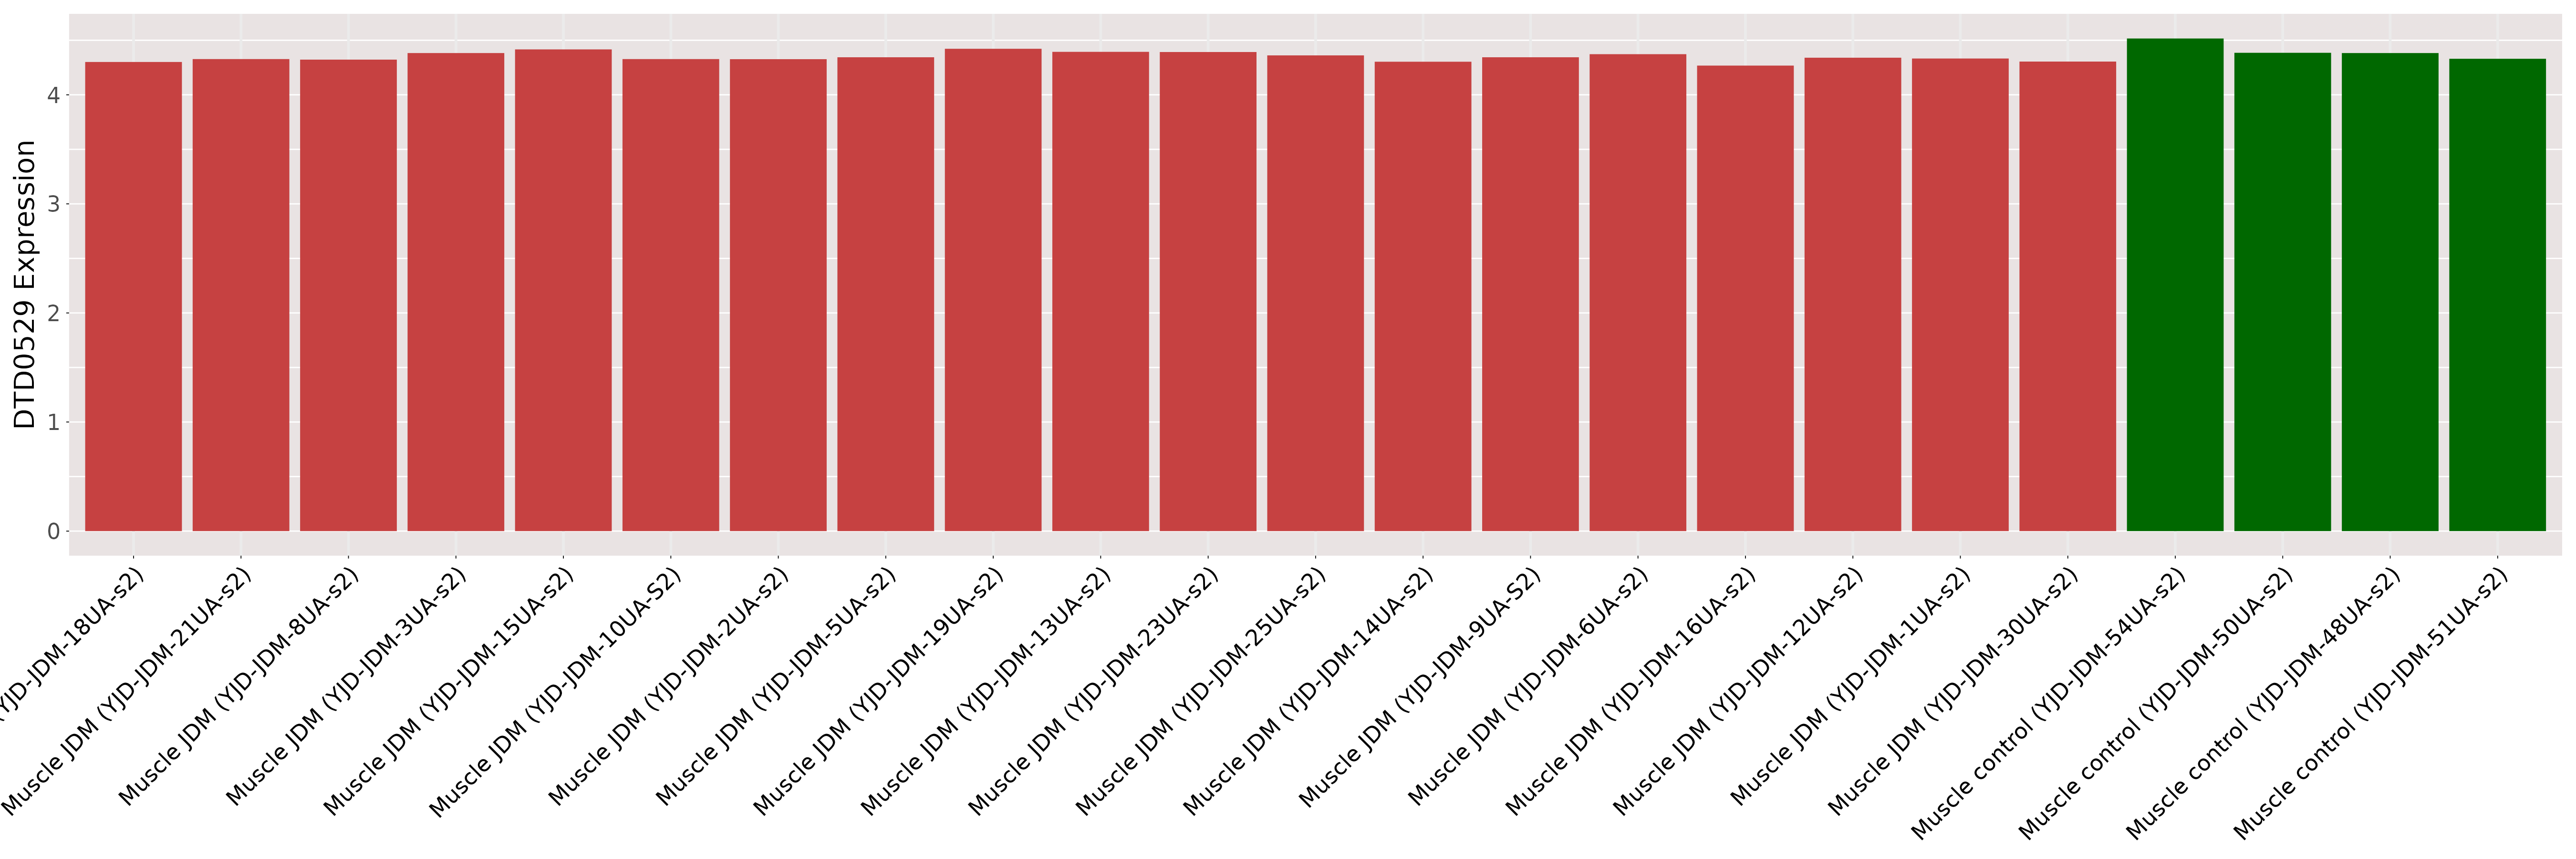
| [+] ICD-11: 4A41.0 Dermatomyositis (juvenile form) | Click to Show/Hide the Full List | ||||
| The Studied Tissue | Skeletal muscle organ | ||||
| The Specified Disease | Juvenile dermatomyositis [ICD-11:4A41.01] | ||||
| The Expression Level of Disease Section Compare with the Healthy Individual Tissue | p-value:0.0448936229335753; Fold-change:0.9900157845476816; Z-score:-0.720599448 | ||||
| DT expression in the diseased tissue of patients
DT expression in the normal tissue of healthy individuals
|
|||||
|
 Please Click the above Thumbnail to View/Download
the Expression Barchart for All Samples Please Click the above Thumbnail to View/Download
the Expression Barchart for All Samples
|
||||
| [+] ICD-11: 4B20 Sarcoidosis | Click to Show/Hide the Full List | ||||
| The Studied Tissue | Lung | ||||
| The Specified Disease | Sarcoidosis [ICD-11:4B20] | ||||
| The Expression Level of Disease Section Compare with the Healthy Individual Tissue | p-value:0.94678348296424; Fold-change:0.9927180434604522; Z-score:-0.037235639 | ||||
| DT expression in the diseased tissue of patients
DT expression in the normal tissue of healthy individuals
|
|||||
|
 Please Click the above Thumbnail to View/Download
the Expression Barchart for All Samples Please Click the above Thumbnail to View/Download
the Expression Barchart for All Samples
|
||||
| ICD-11: 05 Endocrine, nutritional or metabolic disease | |||||
| [+] ICD-11: 5A11 Type 2 diabetes mellitus | Click to Show/Hide the Full List | ||||
| The Studied Tissue | Skeletal muscle | ||||
| The Specified Disease | Type 2 diabetes [ICD-11:5A11] | ||||
| The Expression Level of Disease Section Compare with the Healthy Individual Tissue | p-value:0.1293912251651046; Fold-change:0.974125164; Z-score:-0.739779821 | ||||
| DT expression in the diseased tissue of patients
DT expression in the normal tissue of healthy individuals
|
|||||
|
 Please Click the above Thumbnail to View/Download
the Expression Barchart for All Samples Please Click the above Thumbnail to View/Download
the Expression Barchart for All Samples
|
||||
| The Studied Tissue | Islet of langerhans | ||||
| The Specified Disease | Type ii diabetes mellitus [ICD-11:5A11] | ||||
| The Expression Level of Disease Section Compare with the Healthy Individual Tissue | p-value:0.3136587407645787; Fold-change:1.6497695852534562; Z-score:0.8341888170553989 | ||||
| DT expression in the diseased tissue of patients
DT expression in the normal tissue of healthy individuals
|
|||||
|
 Please Click the above Thumbnail to View/Download
the Expression Barchart for All Samples Please Click the above Thumbnail to View/Download
the Expression Barchart for All Samples
|
||||
| [+] ICD-11: 5A11.2 Type 2 diabetes mellitus with diabetic nephropathy | Click to Show/Hide the Full List | ||||
| The Studied Tissue | Kidney | ||||
| The Specified Disease | Diabetic nephropathy [ICD-11:5A11.1] | ||||
| The Expression Level of Disease Section Compare with the Healthy Individual Tissue | p-value:0.1261823430310918; Fold-change:1.015466632633188; Z-score:1.233289475071914 | ||||
| DT expression in the diseased tissue of patients
DT expression in the normal tissue of healthy individuals
|
|||||
|
 Please Click the above Thumbnail to View/Download
the Expression Barchart for All Samples Please Click the above Thumbnail to View/Download
the Expression Barchart for All Samples
|
||||
| [+] ICD-11: 5A14 Diabetes mellitus, type unspecified | Click to Show/Hide the Full List | ||||
| The Studied Tissue | Skeletal muscle | ||||
| The Specified Disease | Diabetes mellitus [ICD-11:5A14] | ||||
| The Expression Level of Disease Section Compare with the Healthy Individual Tissue | p-value:0.5489909740942633; Fold-change:0.9874247222301724; Z-score:-0.527509291 | ||||
| DT expression in the diseased tissue of patients
DT expression in the normal tissue of healthy individuals
|
|||||
|
 Please Click the above Thumbnail to View/Download
the Expression Barchart for All Samples Please Click the above Thumbnail to View/Download
the Expression Barchart for All Samples
|
||||
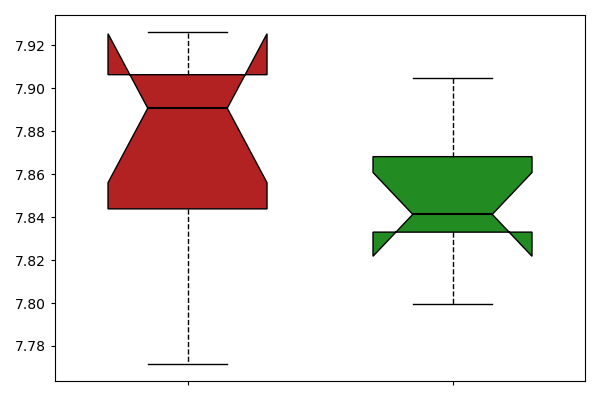
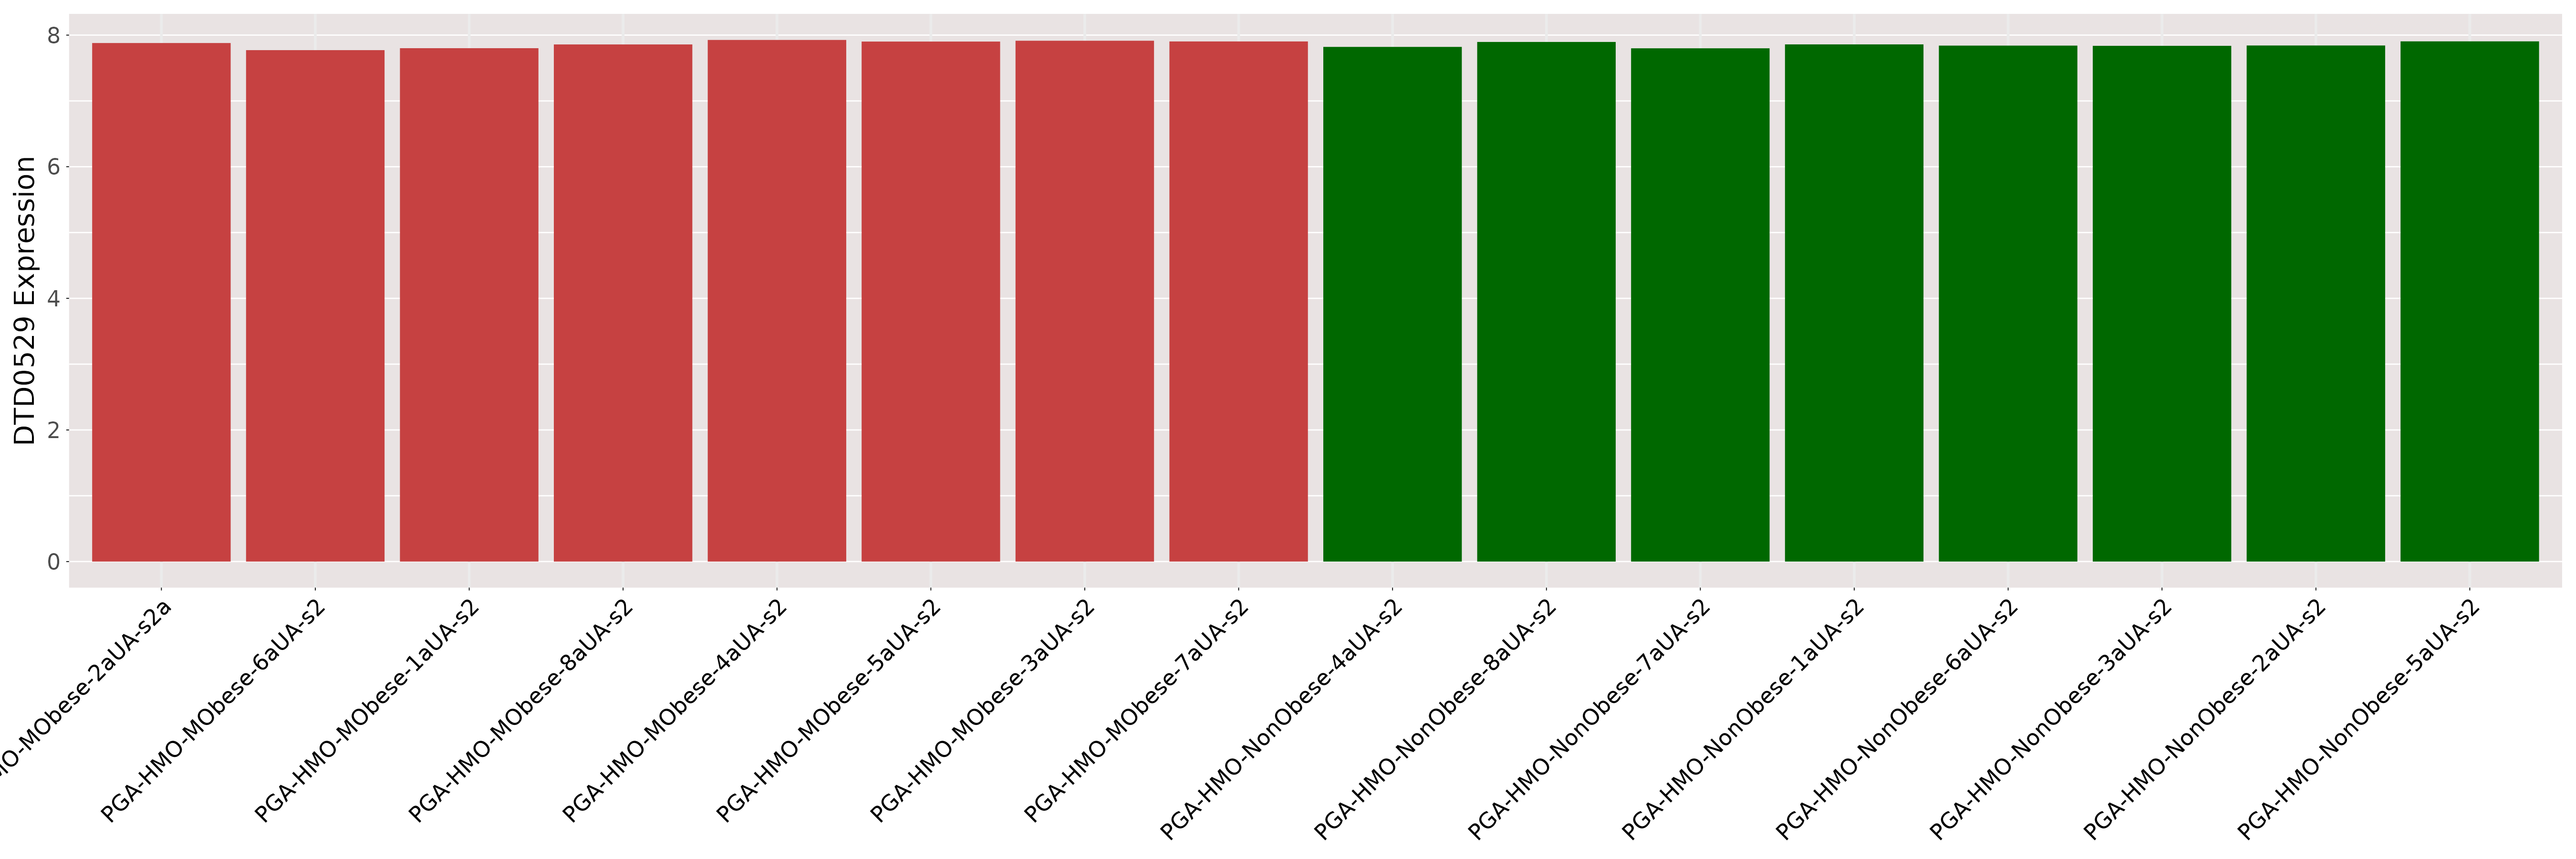
| [+] ICD-11: 5B81 Obesity | Click to Show/Hide the Full List | ||||
| The Studied Tissue | Skeletal muscle | ||||
| The Specified Disease | Obesity [ICD-11:5B81] | ||||
| The Expression Level of Disease Section Compare with the Healthy Individual Tissue | p-value:0.0649215890470787; Fold-change:1.0081139727337258; Z-score:1.887882611719972 | ||||
| DT expression in the diseased tissue of patients
DT expression in the normal tissue of healthy individuals
|
|||||
|
 Please Click the above Thumbnail to View/Download
the Expression Barchart for All Samples Please Click the above Thumbnail to View/Download
the Expression Barchart for All Samples
|
||||
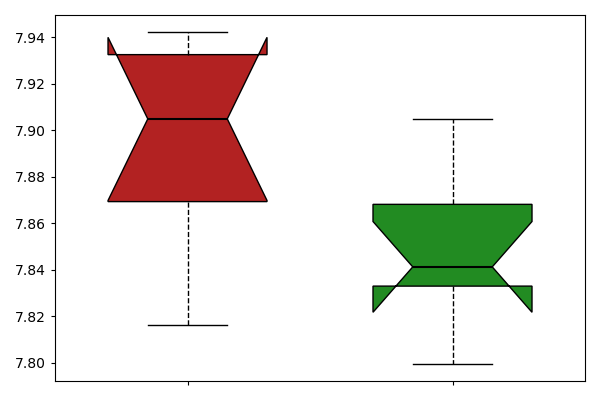
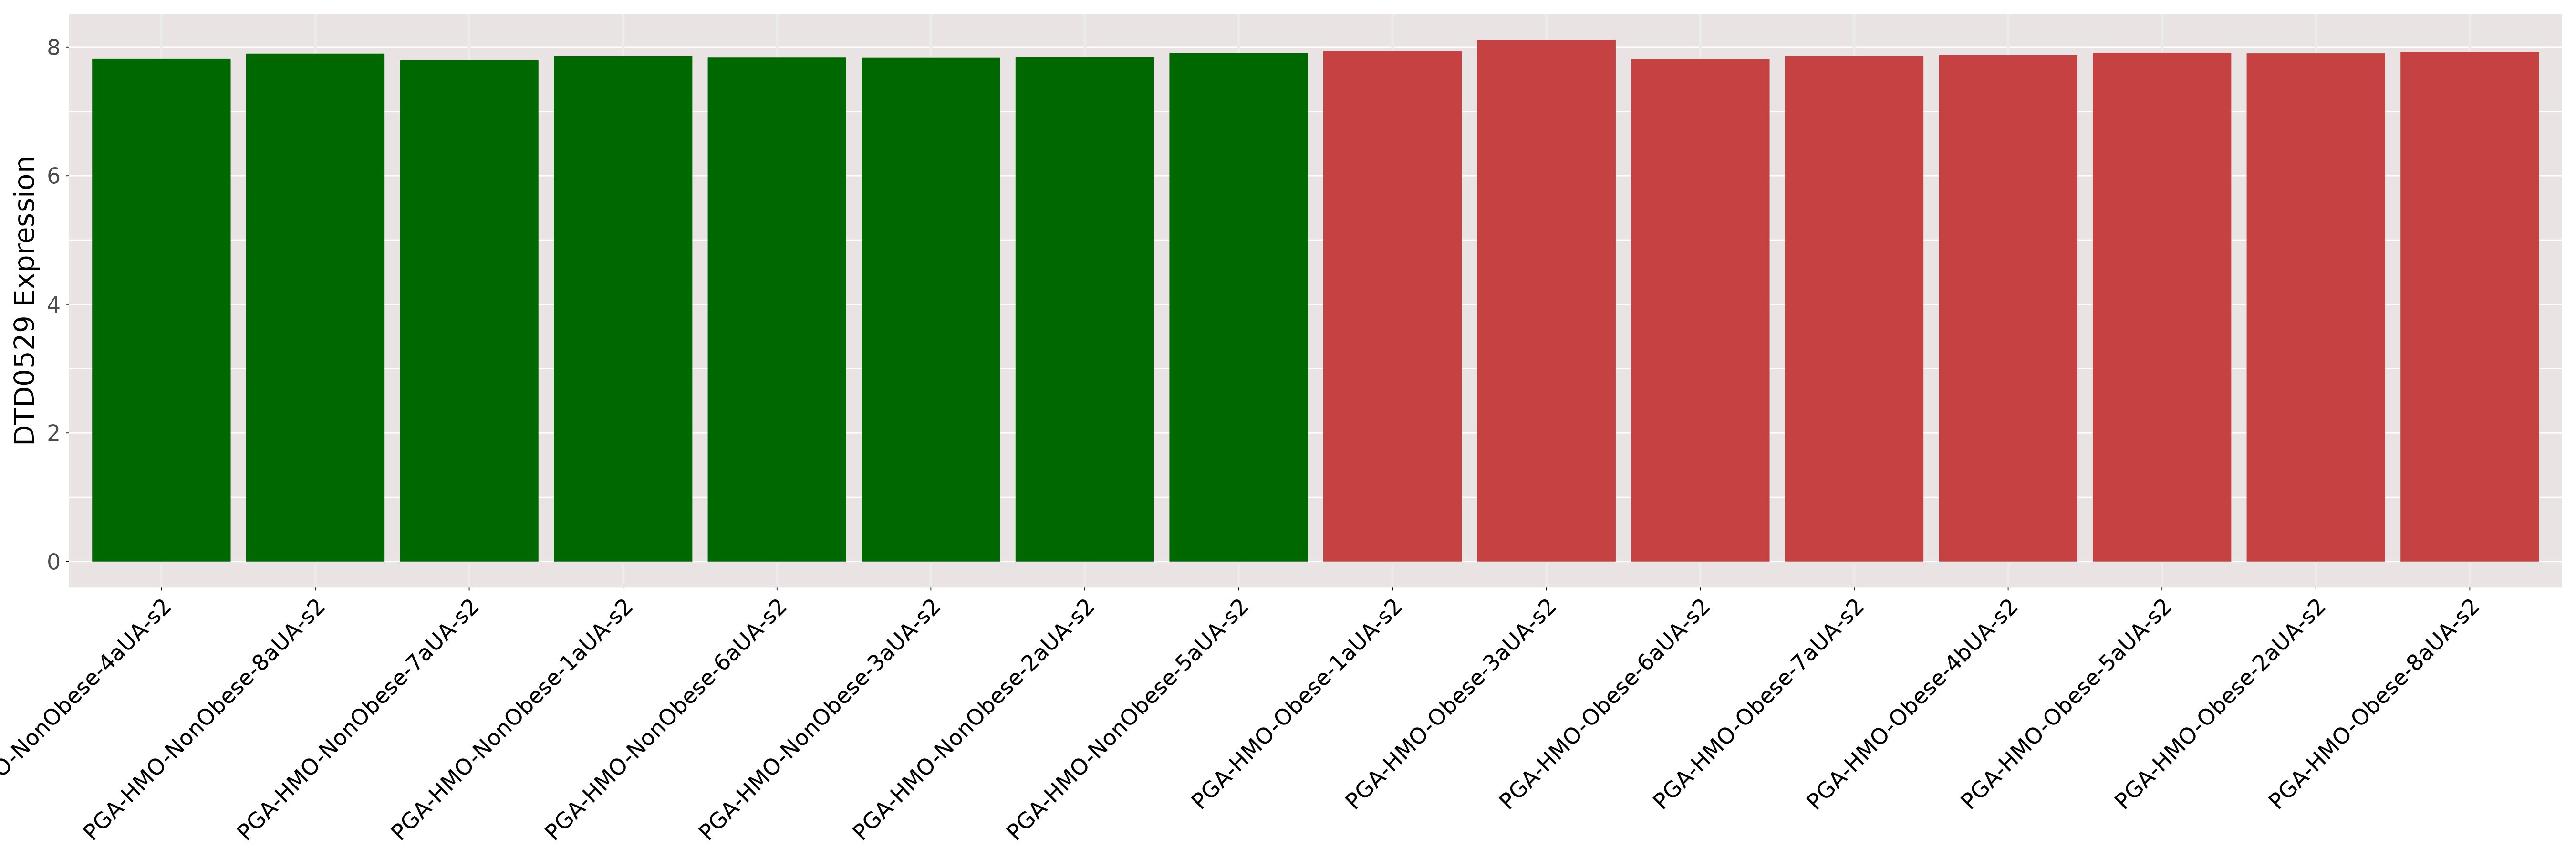
| [+] ICD-11: 5B81 Obesity (morbid obesity) | Click to Show/Hide the Full List | ||||
| The Studied Tissue | Skeletal muscle | ||||
| The Specified Disease | Morbidly obese [ICD-11:5B81] | ||||
| The Expression Level of Disease Section Compare with the Healthy Individual Tissue | p-value:0.4176945602609273; Fold-change:1.0063076809993643; Z-score:0.5488574625375058 | ||||
| DT expression in the diseased tissue of patients
DT expression in the normal tissue of healthy individuals
|
|||||
|
 Please Click the above Thumbnail to View/Download
the Expression Barchart for All Samples Please Click the above Thumbnail to View/Download
the Expression Barchart for All Samples
|
||||
| [+] ICD-11: 5C50.E0 Classical organic aciduria (Methylmalonic acidemia) | Click to Show/Hide the Full List | ||||
| The Studied Tissue | Kidney | ||||
| The Specified Disease | Methylmalonic acidemia [ICD-11:5C50.E0] | ||||
| The Expression Level of Disease Section Compare with the Healthy Individual Tissue | p-value:0.9529633487805224; Fold-change:0.9454338927681504; Z-score:-0.094352502 | ||||
| DT expression in the diseased tissue of patients
DT expression in the normal tissue of healthy individuals
|
|||||
|
 Please Click the above Thumbnail to View/Download
the Expression Barchart for All Samples Please Click the above Thumbnail to View/Download
the Expression Barchart for All Samples
|
||||
| [+] ICD-11: 5C56.0Y Gaucher disease (non-neuronopathic Type 1) | Click to Show/Hide the Full List | ||||
| The Studied Tissue | Skin | ||||
| The Specified Disease | Gaucher disease type 1 [ICD-11:5C56.0Y] | ||||
| The Expression Level of Disease Section Compare with the Healthy Individual Tissue | p-value:0.7108891954044503; Fold-change:1.0095822716770697; Z-score:0.2275414107858634 | ||||
| DT expression in the diseased tissue of patients
DT expression in the normal tissue of healthy individuals
|
|||||
|
 Please Click the above Thumbnail to View/Download
the Expression Barchart for All Samples Please Click the above Thumbnail to View/Download
the Expression Barchart for All Samples
|
||||
| [+] ICD-11: 5C56.0Y Gaucher disease (subacute neuronopathic Type 3) | Click to Show/Hide the Full List | ||||
| The Studied Tissue | Skin | ||||
| The Specified Disease | Gaucher disease type 3 [ICD-11:5C56.0Y] | ||||
| The Expression Level of Disease Section Compare with the Healthy Individual Tissue | p-value:0.4355356397317922; Fold-change:1.0280259630299018; Z-score:0.8237051295390356 | ||||
| DT expression in the diseased tissue of patients
DT expression in the normal tissue of healthy individuals
|
|||||

|
 Please Click the above Thumbnail to View/Download
the Expression Barchart for All Samples Please Click the above Thumbnail to View/Download
the Expression Barchart for All Samples
|
||||
| [+] ICD-11: 5C57.1 X-linked adrenoleukodystrophy | Click to Show/Hide the Full List | ||||
| The Studied Tissue | Dermis | ||||
| The Specified Disease | X linked cerebral adrenoleukodystrophy [ICD-11:5C57.1] | ||||
| The Expression Level of Disease Section Compare with the Healthy Individual Tissue | p-value:0.8482433898537947; Fold-change:0.9620829832500372; Z-score:0.1164841679455614 | ||||
| DT expression in the diseased tissue of patients
DT expression in the normal tissue of healthy individuals
|
|||||
|
 Please Click the above Thumbnail to View/Download
the Expression Barchart for All Samples Please Click the above Thumbnail to View/Download
the Expression Barchart for All Samples
|
||||
| ICD-11: 06 Mental, behavioural or neurodevelopmental disorder | |||||
| [+] ICD-11: 6A02 Autism spectrum disorder | Click to Show/Hide the Full List | ||||
| The Studied Tissue | Brain | ||||
| The Specified Disease | Autism [ICD-11:6A02] | ||||
| The Expression Level of Disease Section Compare with the Healthy Individual Tissue | p-value:0.1647844372672838; Fold-change:1.202247191011236; Z-score:1.1966400894467275 | ||||
| DT expression in the diseased tissue of patients
DT expression in the normal tissue of healthy individuals
|
|||||
|
 Please Click the above Thumbnail to View/Download
the Expression Barchart for All Samples Please Click the above Thumbnail to View/Download
the Expression Barchart for All Samples
|
||||
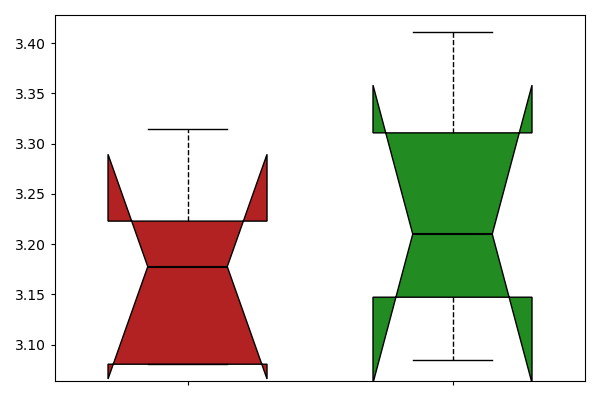
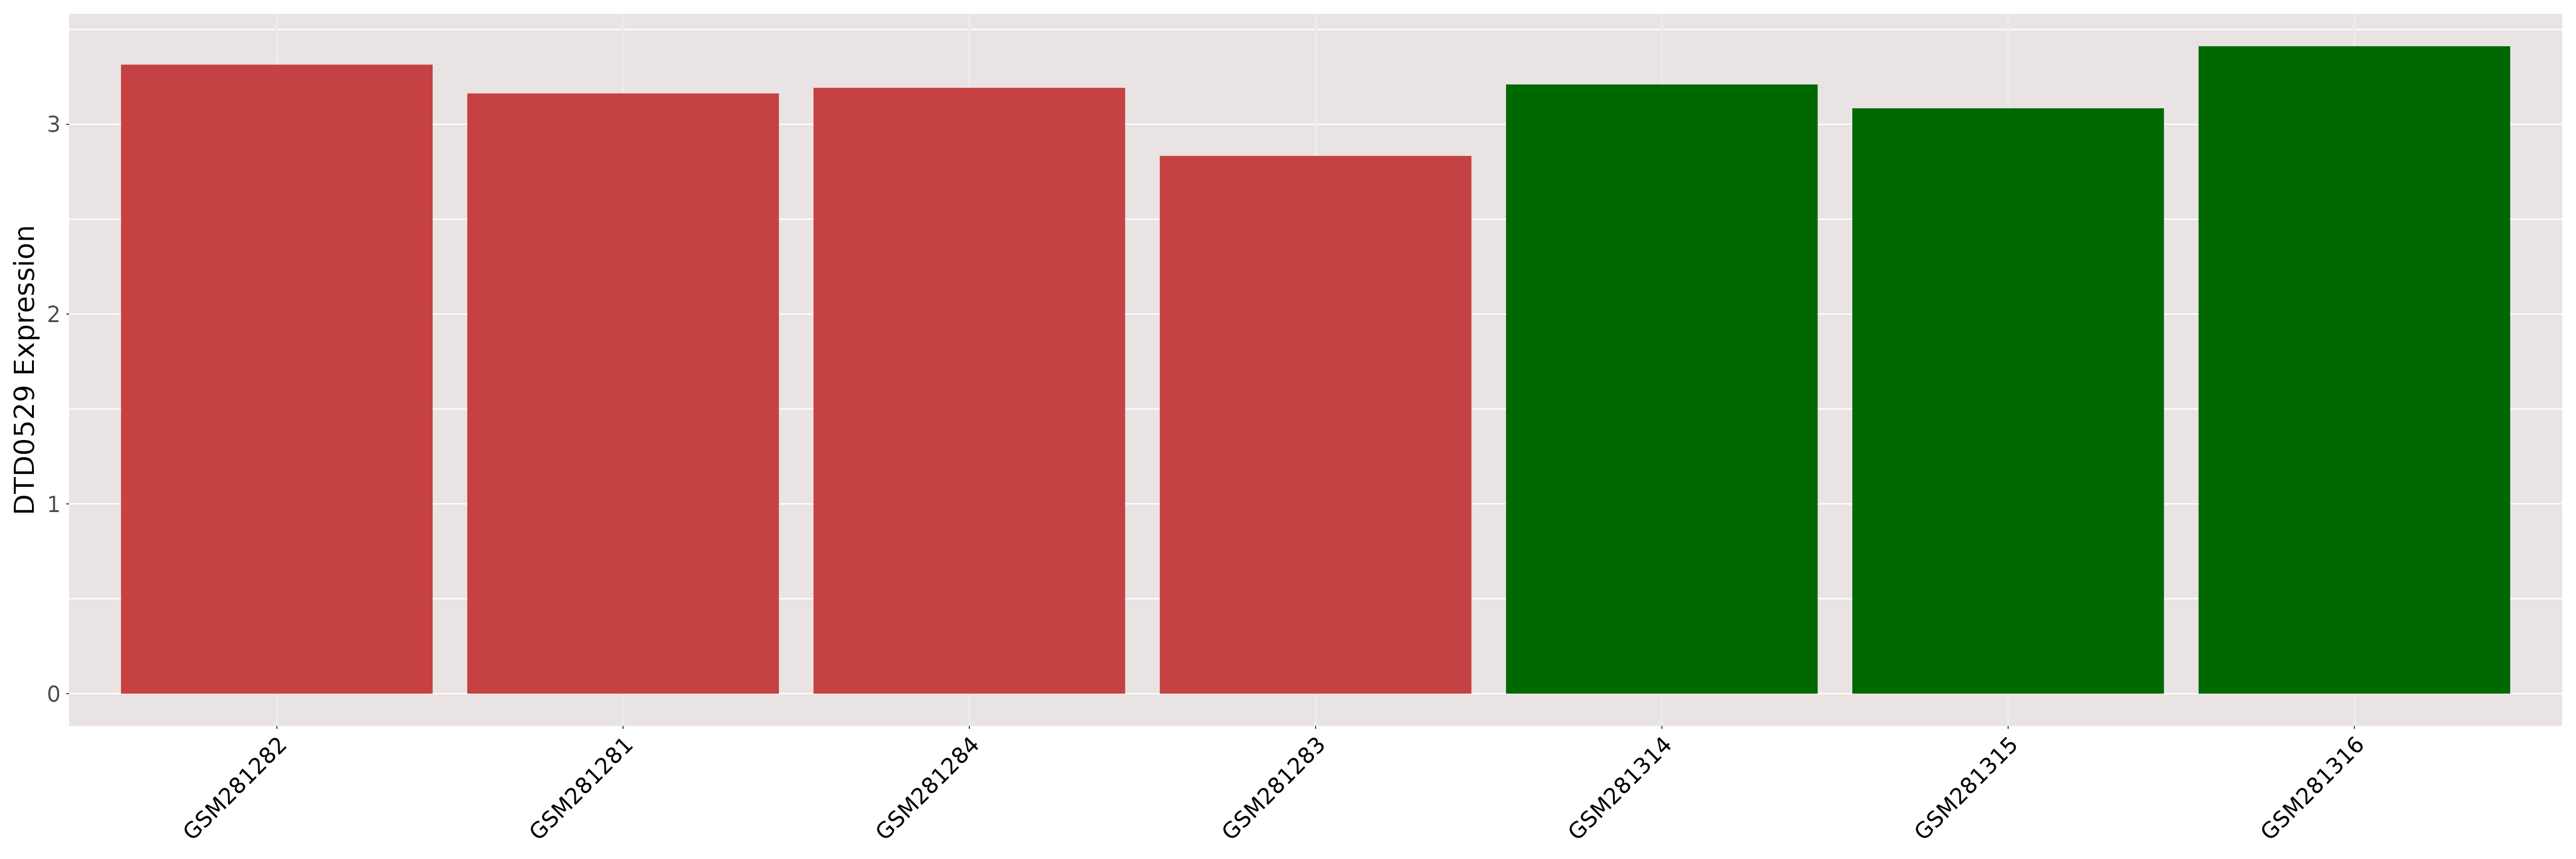
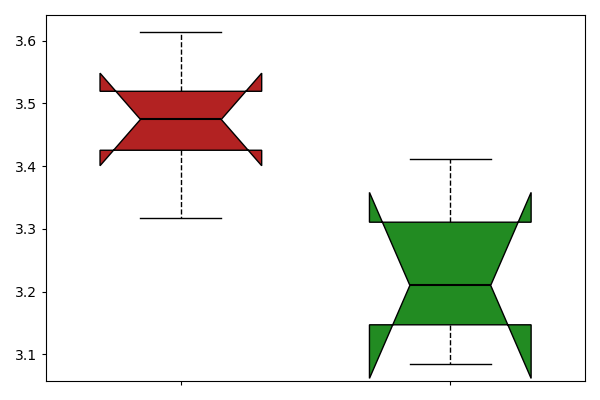
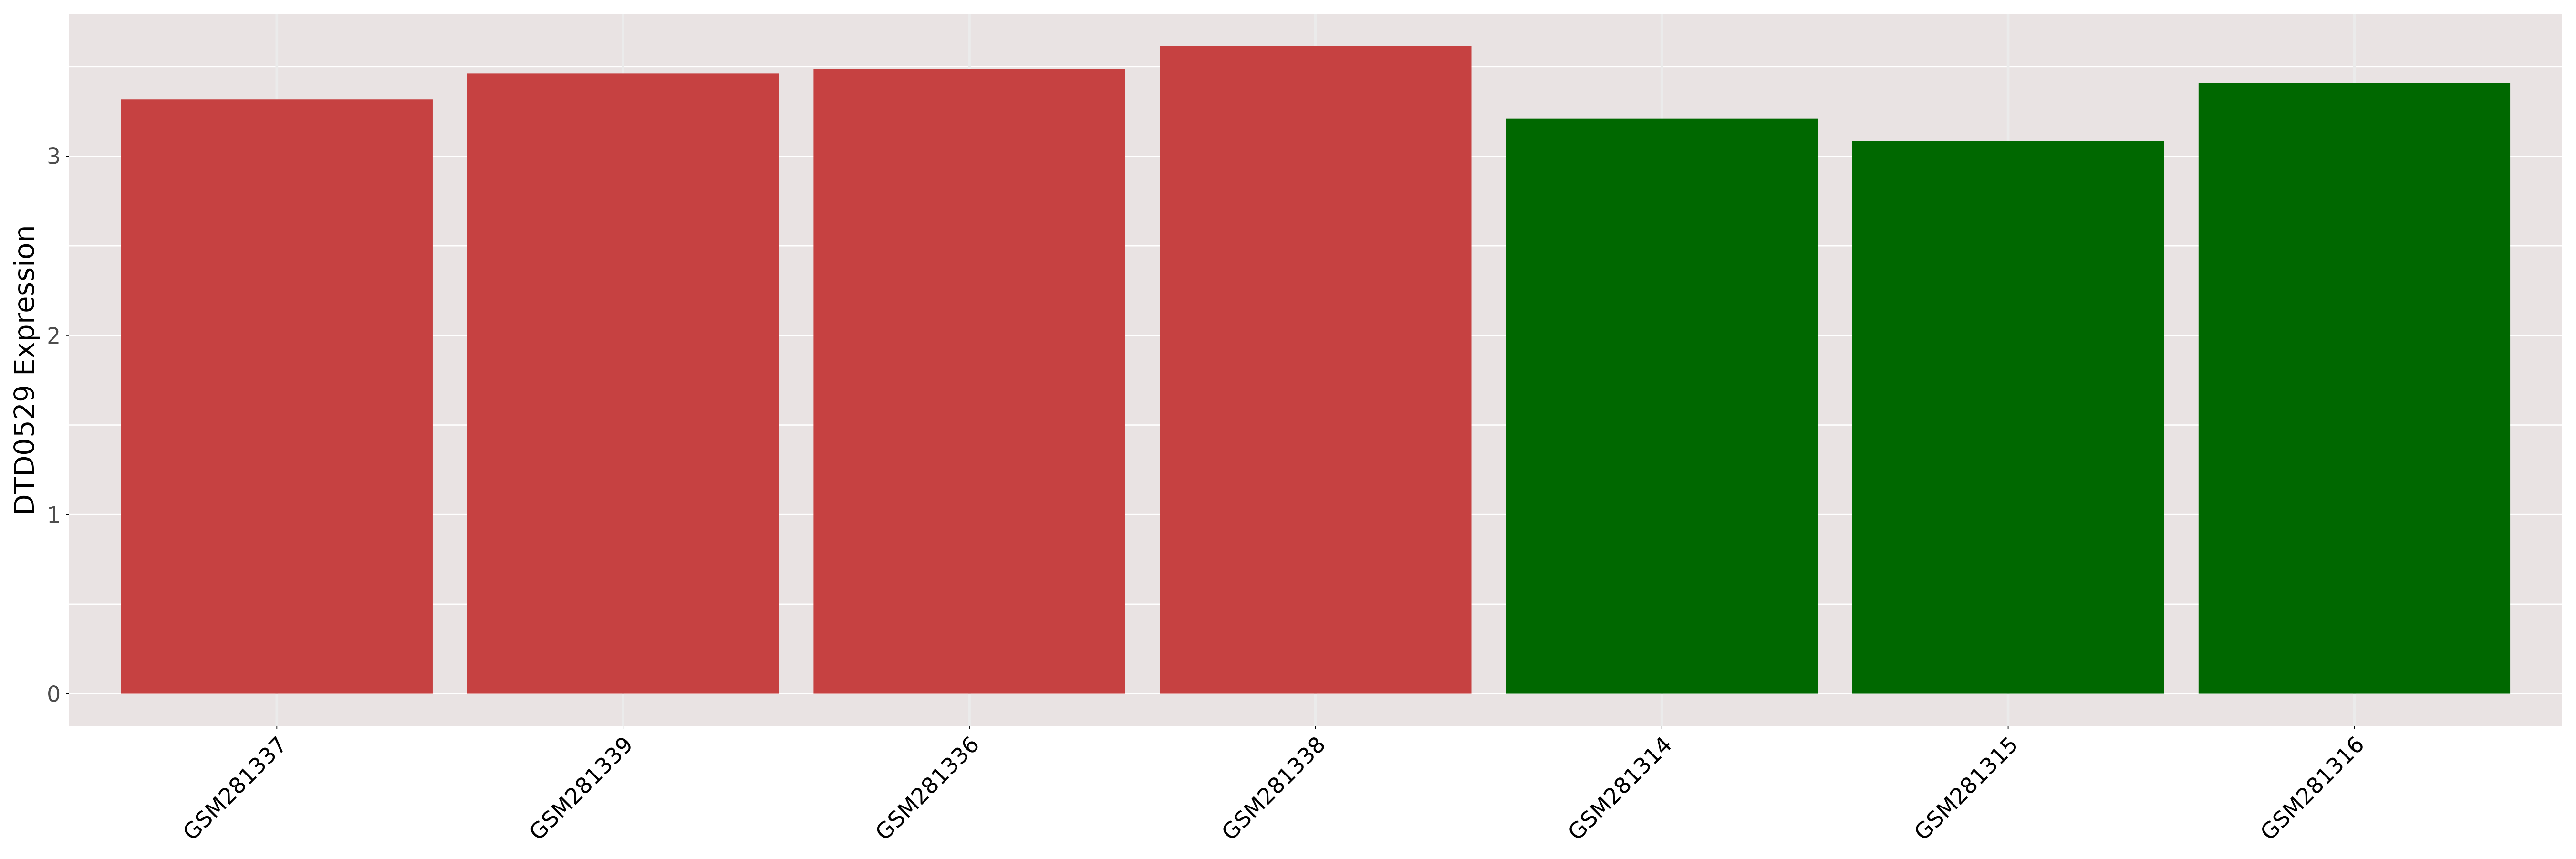
| [+] ICD-11: 6A20 Schizophrenia | Click to Show/Hide the Full List | ||||
| The Studied Tissue | Brodmann (1909) area 9 | ||||
| The Specified Disease | Schizophrenia [ICD-11:6A20] | ||||
| The Expression Level of Disease Section Compare with the Healthy Individual Tissue | p-value:0.5371403059681235; Fold-change:0.7741935483870968; Z-score:-0.367813245 | ||||
| DT expression in the diseased tissue of patients
DT expression in the normal tissue of healthy individuals
|
|||||
_area_9-1.png)
|
_area_9.png) Please Click the above Thumbnail to View/Download
the Expression Barchart for All Samples Please Click the above Thumbnail to View/Download
the Expression Barchart for All Samples
|
||||
| The Studied Tissue | Brodmann (1909) area 11 | ||||
| The Specified Disease | Schizophrenia [ICD-11:6A20] | ||||
| The Expression Level of Disease Section Compare with the Healthy Individual Tissue | p-value:0.7194069451549615; Fold-change:1; Z-score:0.1607664911032586 | ||||
| DT expression in the diseased tissue of patients
DT expression in the normal tissue of healthy individuals
|
|||||
_area_11-1.png)
|
_area_11.png) Please Click the above Thumbnail to View/Download
the Expression Barchart for All Samples Please Click the above Thumbnail to View/Download
the Expression Barchart for All Samples
|
||||
| The Studied Tissue | Brodmann (1909) area 24 | ||||
| The Specified Disease | Schizophrenia [ICD-11:6A20] | ||||
| The Expression Level of Disease Section Compare with the Healthy Individual Tissue | p-value:0.7838049071514559; Fold-change:1.2083333333333333; Z-score:0.1198964088498555 | ||||
| DT expression in the diseased tissue of patients
DT expression in the normal tissue of healthy individuals
|
|||||
_area_24-1.png)
|
_area_24.png) Please Click the above Thumbnail to View/Download
the Expression Barchart for All Samples Please Click the above Thumbnail to View/Download
the Expression Barchart for All Samples
|
||||
| [+] ICD-11: 6A60 Bipolar type I disorder (Bipolar disorder) | Click to Show/Hide the Full List | ||||
| The Studied Tissue | Brodmann (1909) area 9 | ||||
| The Specified Disease | Bipolar disorder [ICD-11:6A60] | ||||
| The Expression Level of Disease Section Compare with the Healthy Individual Tissue | p-value:0.982021688063352; Fold-change:1.096774193548387; Z-score:-0.012125711 | ||||
| DT expression in the diseased tissue of patients
DT expression in the normal tissue of healthy individuals
|
|||||
_area_9-1.png)
|
_area_9.png) Please Click the above Thumbnail to View/Download
the Expression Barchart for All Samples Please Click the above Thumbnail to View/Download
the Expression Barchart for All Samples
|
||||
| The Studied Tissue | Brodmann (1909) area 11 | ||||
| The Specified Disease | Bipolar disorder [ICD-11:6A60] | ||||
| The Expression Level of Disease Section Compare with the Healthy Individual Tissue | p-value:0.0432343367771609; Fold-change:1.4583333333333333; Z-score:1.0771354903918329 | ||||
| DT expression in the diseased tissue of patients
DT expression in the normal tissue of healthy individuals
|
|||||
_area_11-1.png)
|
_area_11.png) Please Click the above Thumbnail to View/Download
the Expression Barchart for All Samples Please Click the above Thumbnail to View/Download
the Expression Barchart for All Samples
|
||||
| The Studied Tissue | Brodmann (1909) area 24 | ||||
| The Specified Disease | Bipolar disorder [ICD-11:6A60] | ||||
| The Expression Level of Disease Section Compare with the Healthy Individual Tissue | p-value:0.725183176643583; Fold-change:1.0416666666666667; Z-score:-0.148882354 | ||||
| DT expression in the diseased tissue of patients
DT expression in the normal tissue of healthy individuals
|
|||||
_area_24-1.png)
|
_area_24.png) Please Click the above Thumbnail to View/Download
the Expression Barchart for All Samples Please Click the above Thumbnail to View/Download
the Expression Barchart for All Samples
|
||||
| The Studied Tissue | Dorsolateral prefrontal cortex | ||||
| The Specified Disease | Bipolar disorder [ICD-11:6A60] | ||||
| The Expression Level of Disease Section Compare with the Healthy Individual Tissue | p-value:0.7670994083372873; Fold-change:1.022222222222222; Z-score:0.0821970115098662 | ||||
| DT expression in the diseased tissue of patients
DT expression in the normal tissue of healthy individuals
|
|||||
|
 Please Click the above Thumbnail to View/Download
the Expression Barchart for All Samples Please Click the above Thumbnail to View/Download
the Expression Barchart for All Samples
|
||||
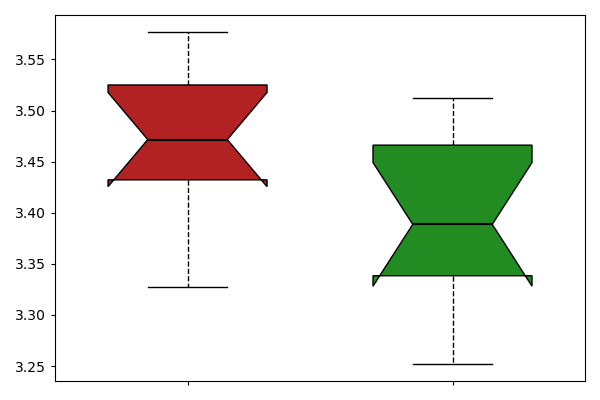
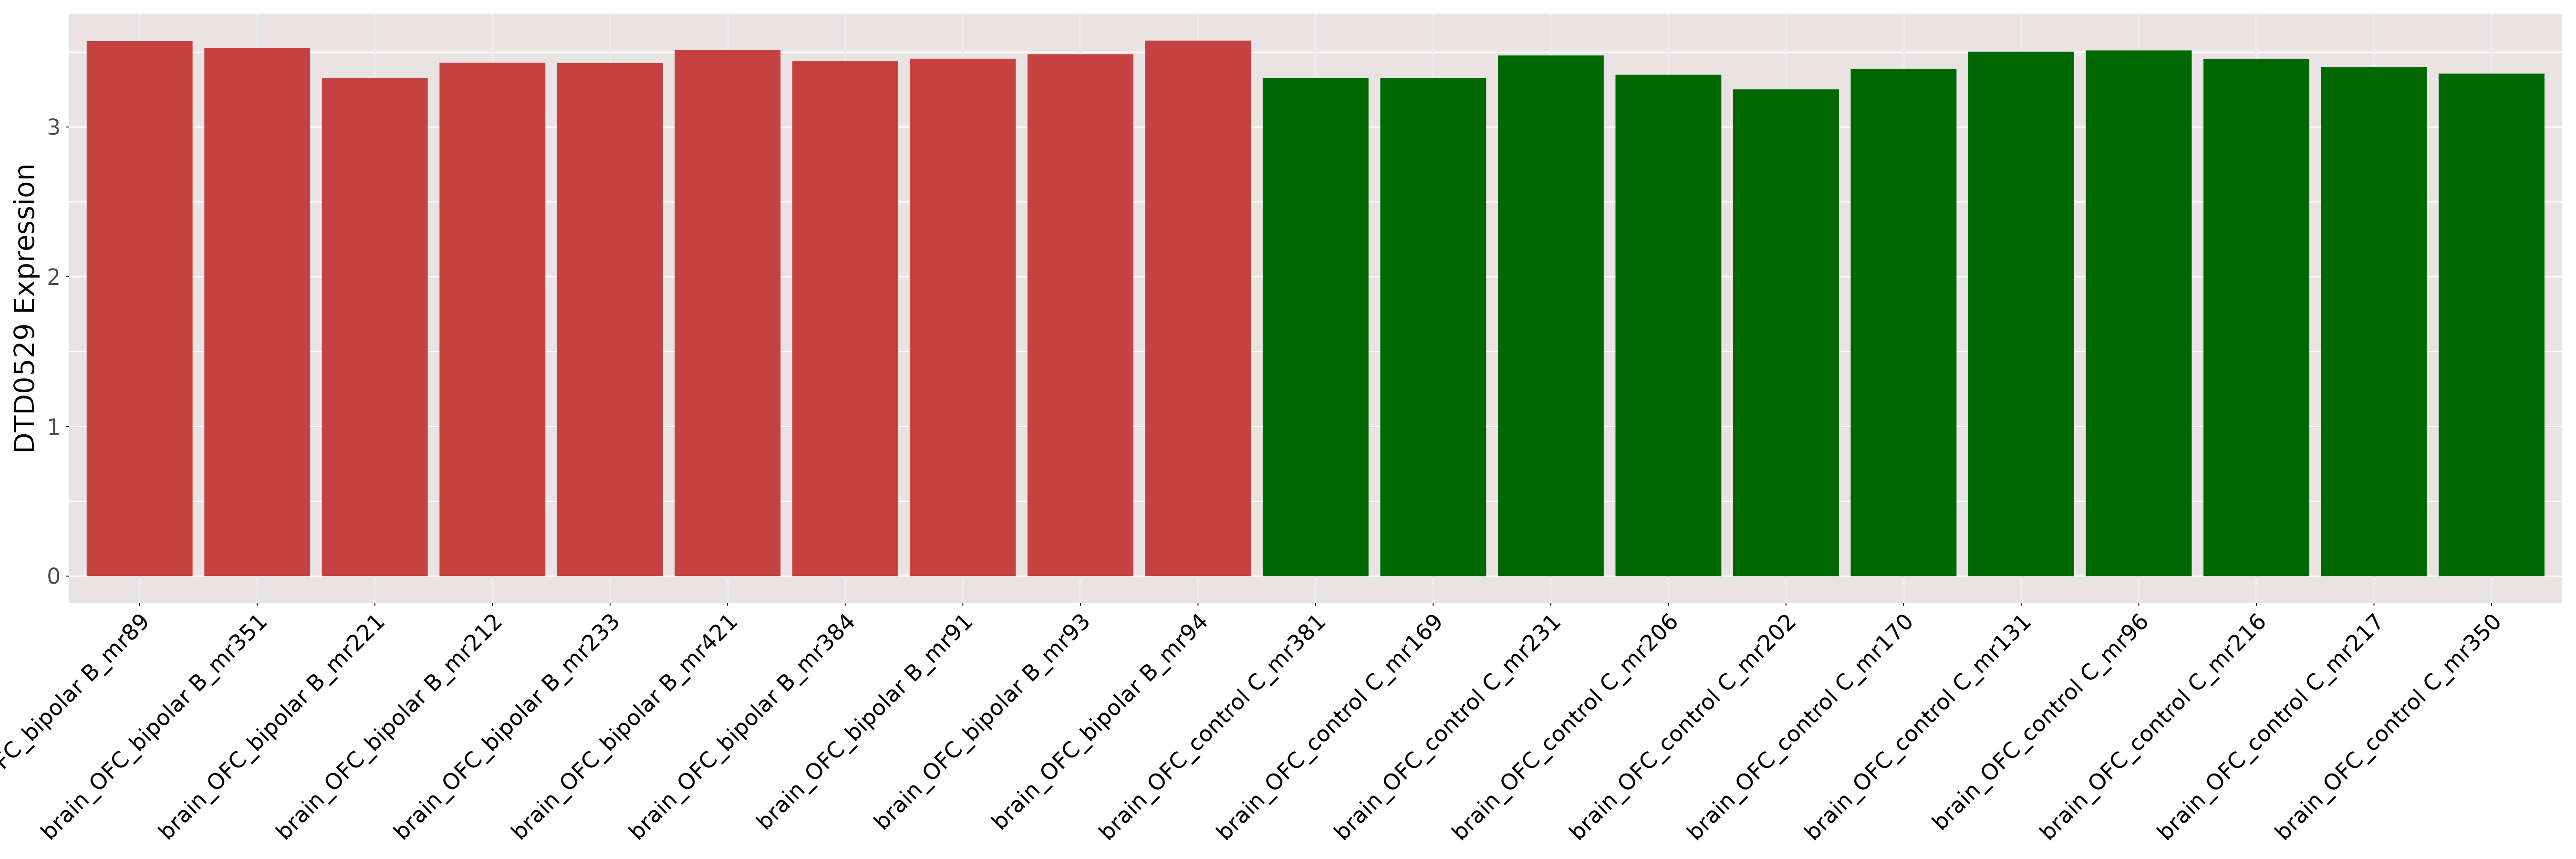
| The Studied Tissue | Orbitofrontal cortex | ||||
| The Specified Disease | Bipolar disorder [ICD-11:6A60] | ||||
| The Expression Level of Disease Section Compare with the Healthy Individual Tissue | p-value:0.0320988004426653; Fold-change:1.0244841877206623; Z-score:0.9724620593479828 | ||||
| DT expression in the diseased tissue of patients
DT expression in the normal tissue of healthy individuals
|
|||||
|
 Please Click the above Thumbnail to View/Download
the Expression Barchart for All Samples Please Click the above Thumbnail to View/Download
the Expression Barchart for All Samples
|
||||
| ICD-11: 08 Disease of the nervous system | |||||
| [+] ICD-11: 8A20 Alzheimer disease | Click to Show/Hide the Full List | ||||
| The Studied Tissue | Frontal cortex | ||||
| The Specified Disease | Alzheimer's disease [ICD-11:8A20] | ||||
| The Expression Level of Disease Section Compare with the Healthy Individual Tissue | p-value:0.8836530068588633; Fold-change:1.009960555195106; Z-score:0.0451316551115166 | ||||
| DT expression in the diseased tissue of patients
DT expression in the normal tissue of healthy individuals
|
|||||
|
 Please Click the above Thumbnail to View/Download
the Expression Barchart for All Samples Please Click the above Thumbnail to View/Download
the Expression Barchart for All Samples
|
||||
| The Studied Tissue | Hippocampus | ||||
| The Specified Disease | Alzheimer's disease [ICD-11:8A20] | ||||
| The Expression Level of Disease Section Compare with the Healthy Individual Tissue | p-value:0.4025192893666561; Fold-change:0.993111942897402; Z-score:-0.647588352 | ||||
| DT expression in the diseased tissue of patients
DT expression in the normal tissue of healthy individuals
|
|||||
|
 Please Click the above Thumbnail to View/Download
the Expression Barchart for All Samples Please Click the above Thumbnail to View/Download
the Expression Barchart for All Samples
|
||||
| The Studied Tissue | Middle temporal gyrus | ||||
| The Specified Disease | Alzheimer's disease [ICD-11:8A20] | ||||
| The Expression Level of Disease Section Compare with the Healthy Individual Tissue | p-value:0.0193279125910267; Fold-change:0.9419437561004383; Z-score:-0.707010846 | ||||
| DT expression in the diseased tissue of patients
DT expression in the normal tissue of healthy individuals
|
|||||
|
 Please Click the above Thumbnail to View/Download
the Expression Barchart for All Samples Please Click the above Thumbnail to View/Download
the Expression Barchart for All Samples
|
||||
| The Studied Tissue | Postcentral gyrus | ||||
| The Specified Disease | Alzheimer's disease [ICD-11:8A20] | ||||
| The Expression Level of Disease Section Compare with the Healthy Individual Tissue | p-value:0.7902444943165552; Fold-change:0.9901773738238284; Z-score:0.0686479886046891 | ||||
| DT expression in the diseased tissue of patients
DT expression in the normal tissue of healthy individuals
|
|||||
|
 Please Click the above Thumbnail to View/Download
the Expression Barchart for All Samples Please Click the above Thumbnail to View/Download
the Expression Barchart for All Samples
|
||||
| The Studied Tissue | Posterior cingulate cortex | ||||
| The Specified Disease | Alzheimer's disease [ICD-11:8A20] | ||||
| The Expression Level of Disease Section Compare with the Healthy Individual Tissue | p-value:0.7066368997277933; Fold-change:0.9782595809396136; Z-score:0.185443619236391 | ||||
| DT expression in the diseased tissue of patients
DT expression in the normal tissue of healthy individuals
|
|||||
|
 Please Click the above Thumbnail to View/Download
the Expression Barchart for All Samples Please Click the above Thumbnail to View/Download
the Expression Barchart for All Samples
|
||||
| The Studied Tissue | Primary visual cortex | ||||
| The Specified Disease | Alzheimer's disease [ICD-11:8A20] | ||||
| The Expression Level of Disease Section Compare with the Healthy Individual Tissue | p-value:0.0339035522636648; Fold-change:1.0758026202277975; Z-score:1.214215557359334 | ||||
| DT expression in the diseased tissue of patients
DT expression in the normal tissue of healthy individuals
|
|||||
|
 Please Click the above Thumbnail to View/Download
the Expression Barchart for All Samples Please Click the above Thumbnail to View/Download
the Expression Barchart for All Samples
|
||||
| The Studied Tissue | Superior frontal gyrus | ||||
| The Specified Disease | Alzheimer's disease [ICD-11:8A20] | ||||
| The Expression Level of Disease Section Compare with the Healthy Individual Tissue | p-value:0.8357043651724144; Fold-change:1.001361127176371; Z-score:-0.05229199 | ||||
| DT expression in the diseased tissue of patients
DT expression in the normal tissue of healthy individuals
|
|||||
|
 Please Click the above Thumbnail to View/Download
the Expression Barchart for All Samples Please Click the above Thumbnail to View/Download
the Expression Barchart for All Samples
|
||||
| The Studied Tissue | Temporal cortex | ||||
| The Specified Disease | Alzheimer's disease [ICD-11:8A20] | ||||
| The Expression Level of Disease Section Compare with the Healthy Individual Tissue | p-value:0.0376540605747277; Fold-change:0.9711899849737298; Z-score:-0.844410522 | ||||
| DT expression in the diseased tissue of patients
DT expression in the normal tissue of healthy individuals
|
|||||
|
 Please Click the above Thumbnail to View/Download
the Expression Barchart for All Samples Please Click the above Thumbnail to View/Download
the Expression Barchart for All Samples
|
||||
| [+] ICD-11: 8B44.0 Hereditary spastic paraplegia | Click to Show/Hide the Full List | ||||
| The Studied Tissue | Skeletal muscle | ||||
| The Specified Disease | Hereditary spastic paraplegia [ICD-11:8B44.0] | ||||
| The Expression Level of Disease Section Compare with the Healthy Individual Tissue | p-value:0.0497704512105621; Fold-change:0.9901856755483974; Z-score:-1.188576427 | ||||
| DT expression in the diseased tissue of patients
DT expression in the normal tissue of healthy individuals
|
|||||
|
 Please Click the above Thumbnail to View/Download
the Expression Barchart for All Samples Please Click the above Thumbnail to View/Download
the Expression Barchart for All Samples
|
||||
| [+] ICD-11: 8B60.0 Amyotrophic lateral sclerosis | Click to Show/Hide the Full List | ||||
| The Studied Tissue | Skeletal muscle | ||||
| The Specified Disease | Amyotrophic lateral sclerosis [ICD-11:8B60.0] | ||||
| The Expression Level of Disease Section Compare with the Healthy Individual Tissue | p-value:0.0017023212291705; Fold-change:0.9872901434070112; Z-score:-1.346464573 | ||||
| DT expression in the diseased tissue of patients
DT expression in the normal tissue of healthy individuals
|
|||||
|
 Please Click the above Thumbnail to View/Download
the Expression Barchart for All Samples Please Click the above Thumbnail to View/Download
the Expression Barchart for All Samples
|
||||
| [+] ICD-11: 8C70.1 Duchenne muscular dystrophy | Click to Show/Hide the Full List | ||||
| The Studied Tissue | Skeletal muscle | ||||
| The Specified Disease | Duchenne muscular dystrophy [ICD-11:8C70.1] | ||||
| The Expression Level of Disease Section Compare with the Healthy Individual Tissue | p-value:0.554471500599661; Fold-change:0.9956576153368834; Z-score:-0.275313984 | ||||
| DT expression in the diseased tissue of patients
DT expression in the normal tissue of healthy individuals
|
|||||
|
 Please Click the above Thumbnail to View/Download
the Expression Barchart for All Samples Please Click the above Thumbnail to View/Download
the Expression Barchart for All Samples
|
||||
| [+] ICD-11: 8C70.1 Duchenne/Becker muscular dystrophy | Click to Show/Hide the Full List | ||||
| The Studied Tissue | Skeletal muscle | ||||
| The Specified Disease | Becker muscular dystrophy [ICD-11:8C70.0] | ||||
| The Expression Level of Disease Section Compare with the Healthy Individual Tissue | p-value:0.7424354172599759; Fold-change:0.9983618594914956; Z-score:0.2330254402921116 | ||||
| DT expression in the diseased tissue of patients
DT expression in the normal tissue of healthy individuals
|
|||||
|
 Please Click the above Thumbnail to View/Download
the Expression Barchart for All Samples Please Click the above Thumbnail to View/Download
the Expression Barchart for All Samples
|
||||
| [+] ICD-11: 8C70.2 Emery-Dreifuss muscular dystrophy | Click to Show/Hide the Full List | ||||
| The Studied Tissue | Skeletal muscle | ||||
| The Specified Disease | Autosomal dominant emery dreifuss muscular dystrophy [ICD-11:8C70.2] | ||||
| The Expression Level of Disease Section Compare with the Healthy Individual Tissue | p-value:0.9551369644217148; Fold-change:0.9905375415979636; Z-score:-0.043056008 | ||||
| DT expression in the diseased tissue of patients
DT expression in the normal tissue of healthy individuals
|
|||||
|
 Please Click the above Thumbnail to View/Download
the Expression Barchart for All Samples Please Click the above Thumbnail to View/Download
the Expression Barchart for All Samples
|
||||
| The Studied Tissue | Skeletal muscle | ||||
| The Specified Disease | X linked recessive emery dreifuss muscular dystrophy [ICD-11:8C70.2] | ||||
| The Expression Level of Disease Section Compare with the Healthy Individual Tissue | p-value:0.0865563934492731; Fold-change:0.9928265449557566; Z-score:-0.992284527 | ||||
| DT expression in the diseased tissue of patients
DT expression in the normal tissue of healthy individuals
|
|||||
|
 Please Click the above Thumbnail to View/Download
the Expression Barchart for All Samples Please Click the above Thumbnail to View/Download
the Expression Barchart for All Samples
|
||||
| [+] ICD-11: 8C70.3 Facioscapulohumeral muscular dystrophy | Click to Show/Hide the Full List | ||||
| The Studied Tissue | Muscle | ||||
| The Specified Disease | Facioscapulohumeral dystrophy [ICD-11:8C70.3] | ||||
| The Expression Level of Disease Section Compare with the Healthy Individual Tissue | p-value:0.3273171048501315; Fold-change:1.6666666666666667; Z-score:0.3804531226427893 | ||||
| DT expression in the diseased tissue of patients
DT expression in the normal tissue of healthy individuals
|
|||||
|
 Please Click the above Thumbnail to View/Download
the Expression Barchart for All Samples Please Click the above Thumbnail to View/Download
the Expression Barchart for All Samples
|
||||
| The Studied Tissue | Myoblast | ||||
| The Specified Disease | Facioscapulohumeral dystrophy [ICD-11:8C70.3] | ||||
| The Expression Level of Disease Section Compare with the Healthy Individual Tissue | p-value:0.3308663489355495; Fold-change:0.2384823848238482; Z-score:-0.510371427 | ||||
| DT expression in the diseased tissue of patients
DT expression in the normal tissue of healthy individuals
|
|||||
|
 Please Click the above Thumbnail to View/Download
the Expression Barchart for All Samples Please Click the above Thumbnail to View/Download
the Expression Barchart for All Samples
|
||||
| The Studied Tissue | Myotube | ||||
| The Specified Disease | Facioscapulohumeral dystrophy [ICD-11:8C70.3] | ||||
| The Expression Level of Disease Section Compare with the Healthy Individual Tissue | p-value:0.861375824225057; Fold-change:15.909090909090908; Z-score:0.0963408599879524 | ||||
| DT expression in the diseased tissue of patients
DT expression in the normal tissue of healthy individuals
|
|||||
|
 Please Click the above Thumbnail to View/Download
the Expression Barchart for All Samples Please Click the above Thumbnail to View/Download
the Expression Barchart for All Samples
|
||||
| The Studied Tissue | Skeletal muscle | ||||
| The Specified Disease | Fascioscapulohumeral muscular dystrophy [ICD-11:8C70.3] | ||||
| The Expression Level of Disease Section Compare with the Healthy Individual Tissue | p-value:0.0595982628749383; Fold-change:0.9925514705991348; Z-score:-0.886613515 | ||||
| DT expression in the diseased tissue of patients
DT expression in the normal tissue of healthy individuals
|
|||||
| [+] ICD-11: 8C70.4 Limb-girdle muscular dystrophy | Click to Show/Hide the Full List | ||||
| The Studied Tissue | Skeletal muscle | ||||
| The Specified Disease | Limb girdle muscular dystrophy 2a [ICD-11:8C70.4] | ||||
| The Expression Level of Disease Section Compare with the Healthy Individual Tissue | p-value:0.1076448353617408; Fold-change:1.006210675305729; Z-score:0.8217067358450912 | ||||
| DT expression in the diseased tissue of patients
DT expression in the normal tissue of healthy individuals
|
|||||
|
 Please Click the above Thumbnail to View/Download
the Expression Barchart for All Samples Please Click the above Thumbnail to View/Download
the Expression Barchart for All Samples
|
||||
| The Studied Tissue | Skeletal muscle | ||||
| The Specified Disease | Limb girdle muscular dystrophy 2b [ICD-11:8C70.4] | ||||
| The Expression Level of Disease Section Compare with the Healthy Individual Tissue | p-value:0.1755861771293363; Fold-change:1.0037639402410206; Z-score:0.6576119694079873 | ||||
| DT expression in the diseased tissue of patients
DT expression in the normal tissue of healthy individuals
|
|||||
|
 Please Click the above Thumbnail to View/Download
the Expression Barchart for All Samples Please Click the above Thumbnail to View/Download
the Expression Barchart for All Samples
|
||||
| The Studied Tissue | Skeletal muscle | ||||
| The Specified Disease | Limb girdle muscular dystrophy 2i [ICD-11:8C70.4] | ||||
| The Expression Level of Disease Section Compare with the Healthy Individual Tissue | p-value:0.7051007683486707; Fold-change:0.9970366682229111; Z-score:-0.171289343 | ||||
| DT expression in the diseased tissue of patients
DT expression in the normal tissue of healthy individuals
|
|||||
|
 Please Click the above Thumbnail to View/Download
the Expression Barchart for All Samples Please Click the above Thumbnail to View/Download
the Expression Barchart for All Samples
|
||||
| [+] ICD-11: 8C71.0 Myotonic dystrophy | Click to Show/Hide the Full List | ||||
| The Studied Tissue | Heart left ventricle | ||||
| The Specified Disease | Myotonic dystrophy [ICD-11:8C71.0] | ||||
| The Expression Level of Disease Section Compare with the Healthy Individual Tissue | p-value:0.5487162222101284; Fold-change:1.6666666666666667; Z-score:3.4718665514101468 | ||||
| DT expression in the diseased tissue of patients
DT expression in the normal tissue of healthy individuals
|
|||||
|
 Please Click the above Thumbnail to View/Download
the Expression Barchart for All Samples Please Click the above Thumbnail to View/Download
the Expression Barchart for All Samples
|
||||
| [+] ICD-11: 8C81 Critical illness myopathy (acute quadriplegic myopathy) | Click to Show/Hide the Full List | ||||
| The Studied Tissue | Skeletal muscle | ||||
| The Specified Disease | Acute quadriplegic myopathy [ICD-11:8C81] | ||||
| The Expression Level of Disease Section Compare with the Healthy Individual Tissue | p-value:0.9792026686932376; Fold-change:0.9945095032392928; Z-score:0.0140161068048752 | ||||
| DT expression in the diseased tissue of patients
DT expression in the normal tissue of healthy individuals
|
|||||
|
 Please Click the above Thumbnail to View/Download
the Expression Barchart for All Samples Please Click the above Thumbnail to View/Download
the Expression Barchart for All Samples
|
||||
| ICD-11: 11 Disease of the circulatory system | |||||
| [+] ICD-11: BA8Z Diseases of coronary artery, unspecified (coronary artery disease) | Click to Show/Hide the Full List | ||||
| The Studied Tissue | Epicardial fat | ||||
| The Specified Disease | Coronary artery disease [ICD-11:BA8Z] | ||||
| The Expression Level of Disease Section Compare with the Healthy Individual Tissue | p-value:0.7650433800154174; Fold-change:1.0031438623874471; Z-score:0.1541299113731618 | ||||
| DT expression in the diseased tissue of patients
DT expression in the normal tissue of healthy individuals
|
|||||
|
 Please Click the above Thumbnail to View/Download
the Expression Barchart for All Samples Please Click the above Thumbnail to View/Download
the Expression Barchart for All Samples
|
||||
| The Studied Tissue | Subcutaneous adipose tissue | ||||
| The Specified Disease | Coronary artery disease [ICD-11:BA8Z] | ||||
| The Expression Level of Disease Section Compare with the Healthy Individual Tissue | p-value:0.3055711820223332; Fold-change:1.0459560175161842; Z-score:0.5983604821631795 | ||||
| DT expression in the diseased tissue of patients
DT expression in the normal tissue of healthy individuals
|
|||||
|
 Please Click the above Thumbnail to View/Download
the Expression Barchart for All Samples Please Click the above Thumbnail to View/Download
the Expression Barchart for All Samples
|
||||
| [+] ICD-11: BD10 Congestive heart failure | Click to Show/Hide the Full List | ||||
| The Studied Tissue | Skeletal muscle tissue | ||||
| The Specified Disease | Heart failure [ICD-11:BD10] | ||||
| The Expression Level of Disease Section Compare with the Healthy Individual Tissue | p-value:0.8324062553654652; Fold-change:1.2; Z-score:0.2061965247105805 | ||||
| DT expression in the diseased tissue of patients
DT expression in the normal tissue of healthy individuals
|
|||||
|
 Please Click the above Thumbnail to View/Download
the Expression Barchart for All Samples Please Click the above Thumbnail to View/Download
the Expression Barchart for All Samples
|
||||
| [+] ICD-11: BD10 Congestive heart failure (post-ischemic) | Click to Show/Hide the Full List | ||||
| The Studied Tissue | Left ventricle | ||||
| The Specified Disease | Post ischemic heart failure [ICD-11:BD10] | ||||
| The Expression Level of Disease Section Compare with the Healthy Individual Tissue | p-value:0.2384997438780779; Fold-change:1.0193056747516718; Z-score:1.62038757326467 | ||||
| DT expression in the diseased tissue of patients
DT expression in the normal tissue of healthy individuals
|
|||||
|
 Please Click the above Thumbnail to View/Download
the Expression Barchart for All Samples Please Click the above Thumbnail to View/Download
the Expression Barchart for All Samples
|
||||
| ICD-11: 13 Disease of the digestive system | |||||
| [+] ICD-11: DB91 Acute or subacute hepatic failure | Click to Show/Hide the Full List | ||||
| The Studied Tissue | Liver | ||||
| The Specified Disease | Acute liver failure [ICD-11:DB91.Z] | ||||
| The Expression Level of Disease Section Compare with the Healthy Individual Tissue | p-value:0.000586287010986; Fold-change:0.8347036036407328; Z-score:-1.603666188 | ||||
| DT expression in the diseased tissue of patients
DT expression in the normal tissue of healthy individuals
|
|||||
|
 Please Click the above Thumbnail to View/Download
the Expression Barchart for All Samples Please Click the above Thumbnail to View/Download
the Expression Barchart for All Samples
|
||||
| [+] ICD-11: DB92.1 Non-alcoholic steatohepatitis | Click to Show/Hide the Full List | ||||
| The Studied Tissue | Liver | ||||
| The Specified Disease | Non alcoholic steatohepatitis [ICD-11:DB92.1] | ||||
| The Expression Level of Disease Section Compare with the Healthy Individual Tissue | p-value:0.1989056041064736; Fold-change:0.96754725949846; Z-score:-1.024724321 | ||||
| DT expression in the diseased tissue of patients
DT expression in the normal tissue of healthy individuals
|
|||||
|
 Please Click the above Thumbnail to View/Download
the Expression Barchart for All Samples Please Click the above Thumbnail to View/Download
the Expression Barchart for All Samples
|
||||
| [+] ICD-11: DD70 Crohn disease | Click to Show/Hide the Full List | ||||
| The Studied Tissue | Ileum | ||||
| The Specified Disease | Crohn's disease [ICD-11:DD70.Z] | ||||
| The Expression Level of Disease Section Compare with the Healthy Individual Tissue | p-value:0.0180138846567948; Fold-change:0.5972850678733032; Z-score:-0.391428421 | ||||
| DT expression in the diseased tissue of patients
DT expression in the normal tissue of healthy individuals
|
|||||
|
 Please Click the above Thumbnail to View/Download
the Expression Barchart for All Samples Please Click the above Thumbnail to View/Download
the Expression Barchart for All Samples
|
||||
| The Studied Tissue | Colonic mucosa | ||||
| The Specified Disease | Crohn's disease [ICD-11:DD70.Z] | ||||
| The Expression Level of Disease Section Compare with the Healthy Individual Tissue | p-value:0.1358470889227339; Fold-change:0.9501479408458804; Z-score:-0.790372235 | ||||
| DT expression in the diseased tissue of patients
DT expression in the normal tissue of healthy individuals
|
|||||
|
 Please Click the above Thumbnail to View/Download
the Expression Barchart for All Samples Please Click the above Thumbnail to View/Download
the Expression Barchart for All Samples
|
||||
| The Studied Tissue | Ileal mucosa | ||||
| The Specified Disease | Crohn's disease [ICD-11:DD70.Z] | ||||
| The Expression Level of Disease Section Compare with the Healthy Individual Tissue | p-value:0.0946604554109551; Fold-change:0.929508857507208; Z-score:-0.490097362 | ||||
| DT expression in the diseased tissue of patients
DT expression in the normal tissue of healthy individuals
|
|||||
|
 Please Click the above Thumbnail to View/Download
the Expression Barchart for All Samples Please Click the above Thumbnail to View/Download
the Expression Barchart for All Samples
|
||||
| [+] ICD-11: DD71 Ulcerative colitis | Click to Show/Hide the Full List | ||||
| The Studied Tissue | Caecum | ||||
| The Specified Disease | Active ulcerative colitis [ICD-11:DD71.Z] | ||||
| The Expression Level of Disease Section Compare with the Healthy Individual Tissue | p-value:0.536263500033722; Fold-change:1.0432742383771911; Z-score:-0.467489232 | ||||
| DT expression in the diseased tissue of patients
DT expression in the normal tissue of healthy individuals
|
|||||
|
 Please Click the above Thumbnail to View/Download
the Expression Barchart for All Samples Please Click the above Thumbnail to View/Download
the Expression Barchart for All Samples
|
||||
| The Studied Tissue | Left colon | ||||
| The Specified Disease | Active ulcerative colitis [ICD-11:DD71.Z] | ||||
| The Expression Level of Disease Section Compare with the Healthy Individual Tissue | p-value:0.0035215459888162; Fold-change:0.8176933052472077; Z-score:-3.28966546 | ||||
| DT expression in the diseased tissue of patients
DT expression in the normal tissue of healthy individuals
|
|||||
|
 Please Click the above Thumbnail to View/Download
the Expression Barchart for All Samples Please Click the above Thumbnail to View/Download
the Expression Barchart for All Samples
|
||||
| The Studied Tissue | Rectum | ||||
| The Specified Disease | Active ulcerative colitis [ICD-11:DD71.Z] | ||||
| The Expression Level of Disease Section Compare with the Healthy Individual Tissue | p-value:0.0325801107555854; Fold-change:0.8433788877290004; Z-score:-4.462392454 | ||||
| DT expression in the diseased tissue of patients
DT expression in the normal tissue of healthy individuals
|
|||||
|
 Please Click the above Thumbnail to View/Download
the Expression Barchart for All Samples Please Click the above Thumbnail to View/Download
the Expression Barchart for All Samples
|
||||
| The Studied Tissue | Transverse colon | ||||
| The Specified Disease | Active ulcerative colitis [ICD-11:DD71.Z] | ||||
| The Expression Level of Disease Section Compare with the Healthy Individual Tissue | p-value:0.0247275357318351; Fold-change:0.8780628914308528; Z-score:-5.239008079 | ||||
| DT expression in the diseased tissue of patients
DT expression in the normal tissue of healthy individuals
|
|||||
|
|
|
||||
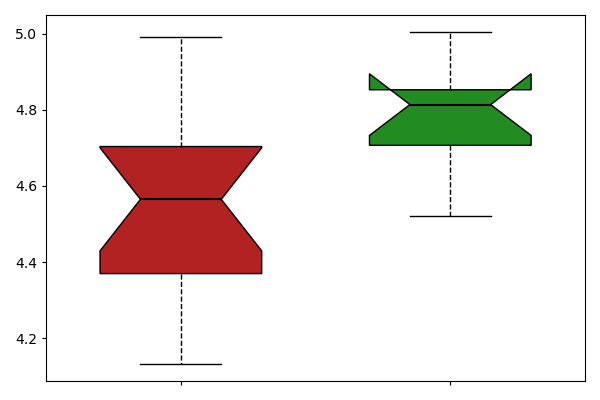
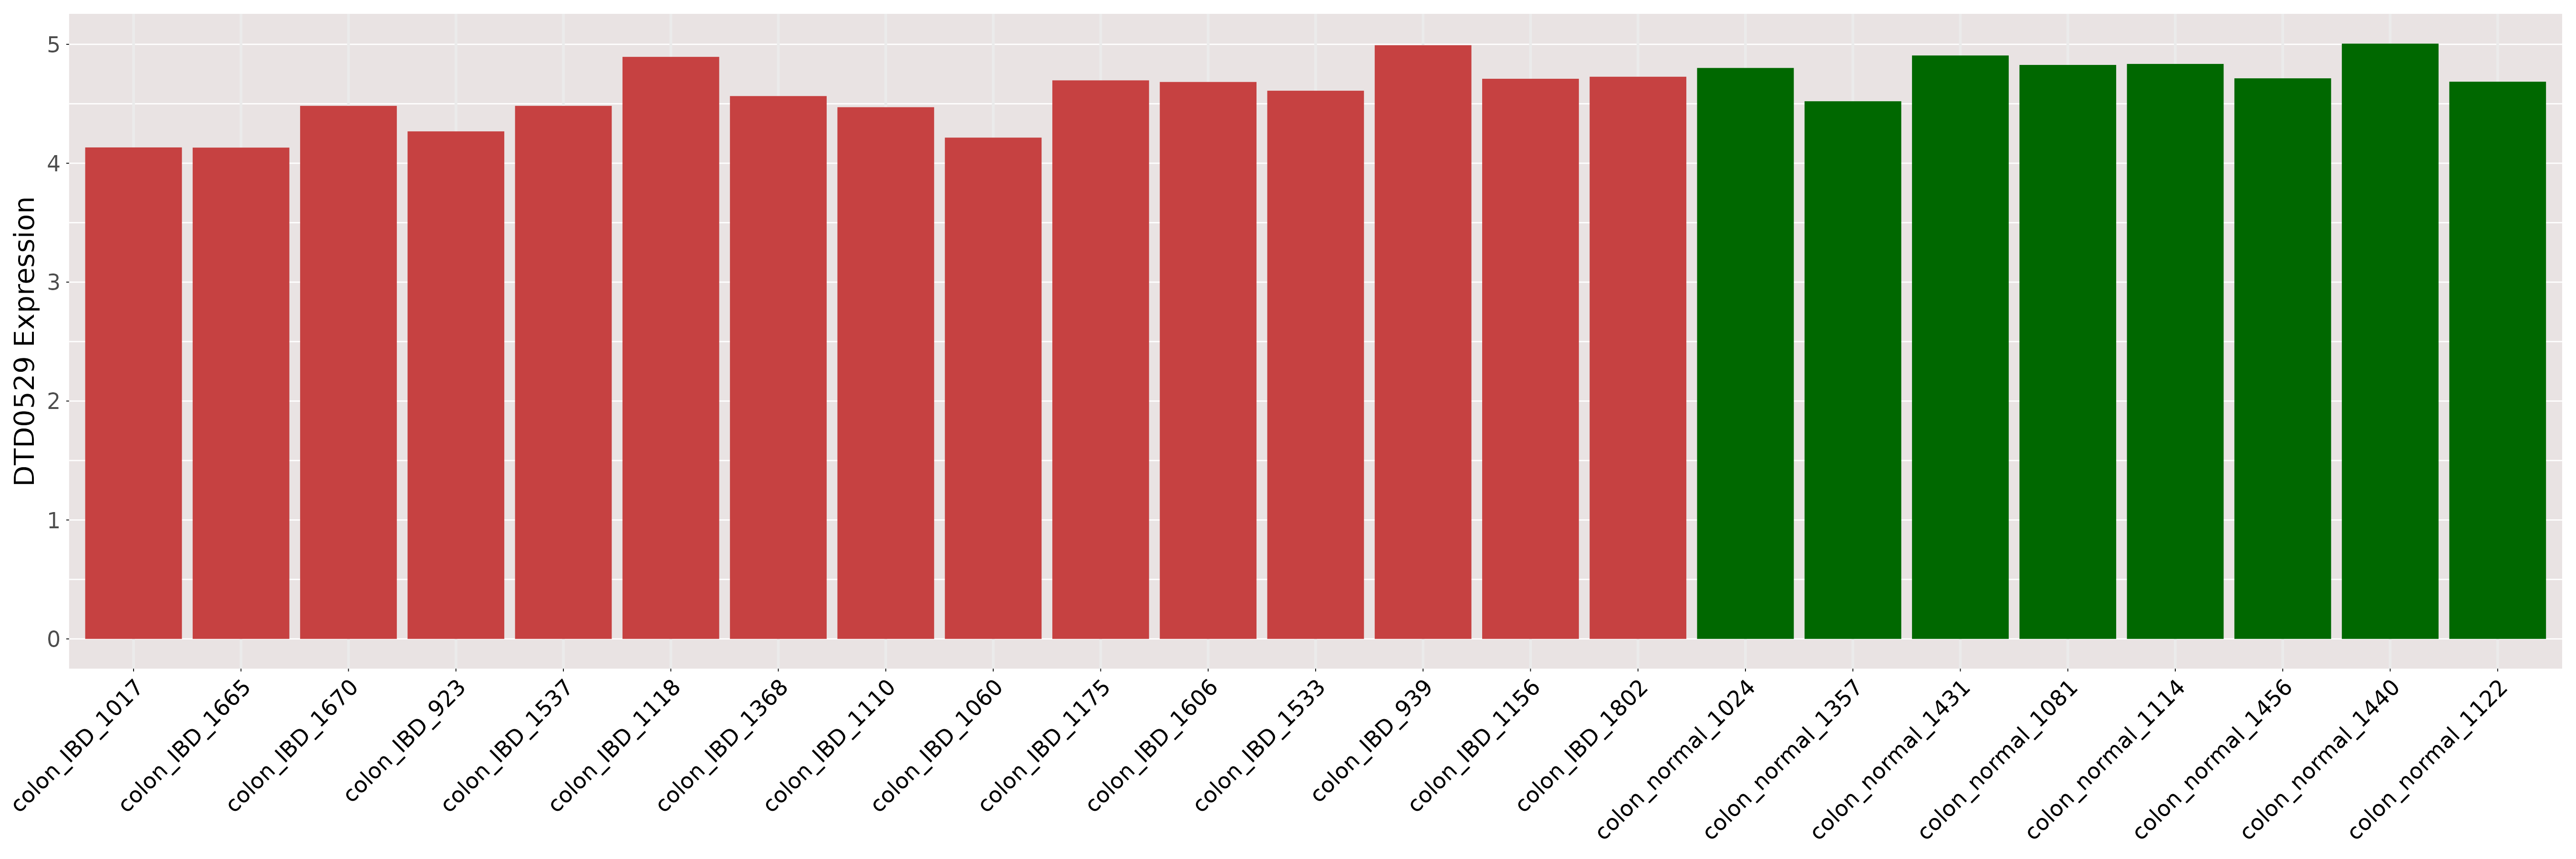
| [+] ICD-11: DD7Z Inflammatory bowel disease, unspecified | Click to Show/Hide the Full List | ||||
| The Studied Tissue | Colon | ||||
| The Specified Disease | Inflammatory bowel disease [ICD-11:DD7Z] | ||||
| The Expression Level of Disease Section Compare with the Healthy Individual Tissue | p-value:0.0223844256438015; Fold-change:0.9482647924594744; Z-score:-1.689911058 | ||||
| DT expression in the diseased tissue of patients
DT expression in the normal tissue of healthy individuals
|
|||||
|
 Please Click the above Thumbnail to View/Download
the Expression Barchart for All Samples Please Click the above Thumbnail to View/Download
the Expression Barchart for All Samples
|
||||
| The Studied Tissue | Sigmoid colon | ||||
| The Specified Disease | Inflammatory bowel disease [ICD-11:DD7Z] | ||||
| The Expression Level of Disease Section Compare with the Healthy Individual Tissue | p-value:0.7532357440705023; Fold-change:1.009522844424281; Z-score:0.0589761807000112 | ||||
| DT expression in the diseased tissue of patients
DT expression in the normal tissue of healthy individuals
|
|||||
|
 Please Click the above Thumbnail to View/Download
the Expression Barchart for All Samples Please Click the above Thumbnail to View/Download
the Expression Barchart for All Samples
|
||||
| ICD-11: 14 Disease of the skin | |||||
| [+] ICD-11: EA80 Atopic dermatitis | Click to Show/Hide the Full List | ||||
| The Studied Tissue | Skin | ||||
| The Specified Disease | Atopic eczema [ICD-11:EA80] | ||||
| The Expression Level of Disease Section Compare with the Healthy Individual Tissue | p-value:0.2025325479335698; Fold-change:1.034368669907786; Z-score:0.5201387344882809 | ||||
| DT expression in the diseased tissue of patients
DT expression in the normal tissue of healthy individuals
|
|||||
|
 Please Click the above Thumbnail to View/Download
the Expression Barchart for All Samples Please Click the above Thumbnail to View/Download
the Expression Barchart for All Samples
|
||||
| [+] ICD-11: EA91 Lichen planus (oral mucosal involvement) | Click to Show/Hide the Full List | ||||
| The Studied Tissue | Mouth mucosa | ||||
| The Specified Disease | Oral lichen planus [ICD-11:EA91.42] | ||||
| The Expression Level of Disease Section Compare with the Healthy Individual Tissue | p-value:0.7209643375309565; Fold-change:1.0953523830891412; Z-score:0.1868423787498428 | ||||
| DT expression in the diseased tissue of patients
DT expression in the normal tissue of healthy individuals
|
|||||
|
 Please Click the above Thumbnail to View/Download
the Expression Barchart for All Samples Please Click the above Thumbnail to View/Download
the Expression Barchart for All Samples
|
||||
| [+] ICD-11: ED90.0 Rosacea | Click to Show/Hide the Full List | ||||
| The Studied Tissue | Skin | ||||
| The Specified Disease | Rosacea [ICD-11:ED90.0] | ||||
| The Expression Level of Disease Section Compare with the Healthy Individual Tissue | p-value:1.3311901099255392e-05; Fold-change:0.932027049711848; Z-score:-1.069635712 | ||||
| DT expression in the diseased tissue of patients
DT expression in the normal tissue of healthy individuals
|
|||||
|
 Please Click the above Thumbnail to View/Download
the Expression Barchart for All Samples Please Click the above Thumbnail to View/Download
the Expression Barchart for All Samples
|
||||
| [+] ICD-11: EK90.0 Actinic keratosis | Click to Show/Hide the Full List | ||||
| The Studied Tissue | Skin | ||||
| The Specified Disease | Actinic keratosis [ICD-11:EK90.0] | ||||
| The Expression Level of Disease Section Compare with the Healthy Individual Tissue | p-value:2.2854153545063704e-13; Fold-change:0.03125; Z-score:-6.607008425 | ||||
| DT expression in the diseased tissue of patients
DT expression in the normal tissue of healthy individuals
|
|||||
|
 Please Click the above Thumbnail to View/Download
the Expression Barchart for All Samples Please Click the above Thumbnail to View/Download
the Expression Barchart for All Samples
|
||||
| ICD-11: 15 Disease of the musculoskeletal system/connective tissue | |||||
| [+] ICD-11: FA0Z Osteoarthritis, unspecified site | Click to Show/Hide the Full List | ||||
| The Studied Tissue | Bone | ||||
| The Specified Disease | Osteoarthritis [ICD-11:FA0Z] | ||||
| The Expression Level of Disease Section Compare with the Healthy Individual Tissue | p-value:0.1691646912963052; Fold-change:0.9275943736600686; Z-score:-0.539637757 | ||||
| DT expression in the diseased tissue of patients
DT expression in the normal tissue of healthy individuals
|
|||||
|
 Please Click the above Thumbnail to View/Download
the Expression Barchart for All Samples Please Click the above Thumbnail to View/Download
the Expression Barchart for All Samples
|
||||
| ICD-11: 16 Disease of the genitourinary system | |||||
| [+] ICD-11: GB61 Chronic kidney disease | Click to Show/Hide the Full List | ||||
| The Studied Tissue | Kidney | ||||
| The Specified Disease | Chronic kidney disease [ICD-11:GB61.Z] | ||||
| The Expression Level of Disease Section Compare with the Healthy Individual Tissue | p-value:0.0382587780901781; Fold-change:0.929532237015893; Z-score:-0.739704112 | ||||
| DT expression in the diseased tissue of patients
DT expression in the normal tissue of healthy individuals
|
|||||
|
 Please Click the above Thumbnail to View/Download
the Expression Barchart for All Samples Please Click the above Thumbnail to View/Download
the Expression Barchart for All Samples
|
||||
| ICD-11: 20 Developmental anomaly | |||||
| [+] ICD-11: LA88.2 Tetralogy of Fallot | Click to Show/Hide the Full List | ||||
| The Studied Tissue | Heart ventricle | ||||
| The Specified Disease | Tetralogy of fallot [ICD-11:LA88.2] | ||||
| The Expression Level of Disease Section Compare with the Healthy Individual Tissue | p-value:0.5049403403952777; Fold-change:1; Z-score:-0.311068269 | ||||
| DT expression in the diseased tissue of patients
DT expression in the normal tissue of healthy individuals
|
|||||
|
 Please Click the above Thumbnail to View/Download
the Expression Barchart for All Samples Please Click the above Thumbnail to View/Download
the Expression Barchart for All Samples
|
||||
| [+] ICD-11: LB20.21 Biliary atresia | Click to Show/Hide the Full List | ||||
| The Studied Tissue | Liver | ||||
| The Specified Disease | Biliary atresia [ICD-11:LB20.21] | ||||
| The Expression Level of Disease Section Compare with the Healthy Individual Tissue | p-value:0.1453164669012884; Fold-change:1.0400892334048064; Z-score:0.6381726487932469 | ||||
| DT expression in the diseased tissue of patients
DT expression in the normal tissue of healthy individuals
|
|||||
|
 Please Click the above Thumbnail to View/Download
the Expression Barchart for All Samples Please Click the above Thumbnail to View/Download
the Expression Barchart for All Samples
|
||||
| [+] ICD-11: LB70.00 Unicoronal craniosynostosis | Click to Show/Hide the Full List | ||||
| The Studied Tissue | Skull | ||||
| The Specified Disease | Coronal craniosynostosis [ICD-11:LB70.00] | ||||
| The Expression Level of Disease Section Compare with the Healthy Individual Tissue | p-value:0.1717201368047348; Fold-change:0.3184768498485504; Z-score:-1.126330149 | ||||
| DT expression in the diseased tissue of patients
DT expression in the normal tissue of healthy individuals
|
|||||
|
 Please Click the above Thumbnail to View/Download
the Expression Barchart for All Samples Please Click the above Thumbnail to View/Download
the Expression Barchart for All Samples
|
||||
| [+] ICD-11: LB70.02 Lambdoid craniosynostosis | Click to Show/Hide the Full List | ||||
| The Studied Tissue | Skull | ||||
| The Specified Disease | Lambdoid craniosynostosis [ICD-11:LB70.3] | ||||
| The Expression Level of Disease Section Compare with the Healthy Individual Tissue | p-value:0.0135812391163974; Fold-change:0.1151016875811337; Z-score:-2.217743971 | ||||
| DT expression in the diseased tissue of patients
DT expression in the normal tissue of healthy individuals
|
|||||
|
 Please Click the above Thumbnail to View/Download
the Expression Barchart for All Samples Please Click the above Thumbnail to View/Download
the Expression Barchart for All Samples
|
||||
| [+] ICD-11: LB70.03 Metopic craniosynostosis | Click to Show/Hide the Full List | ||||
| The Studied Tissue | Skull | ||||
| The Specified Disease | Metopic craniosynostosis [ICD-11:LB70.2] | ||||
| The Expression Level of Disease Section Compare with the Healthy Individual Tissue | p-value:0.0038767596391722; Fold-change:0.2881869320640415; Z-score:-1.786861632 | ||||
| DT expression in the diseased tissue of patients
DT expression in the normal tissue of healthy individuals
|
|||||
|
 Please Click the above Thumbnail to View/Download
the Expression Barchart for All Samples Please Click the above Thumbnail to View/Download
the Expression Barchart for All Samples
|
||||
| [+] ICD-11: LB70.0Y Sagittal craniosynostosis | Click to Show/Hide the Full List | ||||
| The Studied Tissue | Skull | ||||
| The Specified Disease | Sagittal craniosynostosis [ICD-11:LB70.1] | ||||
| The Expression Level of Disease Section Compare with the Healthy Individual Tissue | p-value:0.0047543979735844; Fold-change:0.2959757680657724; Z-score:-1.900525422 | ||||
| DT expression in the diseased tissue of patients
DT expression in the normal tissue of healthy individuals
|
|||||
|
 Please Click the above Thumbnail to View/Download
the Expression Barchart for All Samples Please Click the above Thumbnail to View/Download
the Expression Barchart for All Samples
|
||||
| [+] ICD-11: LC02 Sebaceous naevus (nevus sebaceus of Jadassohn) | Click to Show/Hide the Full List | ||||
| The Studied Tissue | Skin | ||||
| The Specified Disease | Sebaceous of jadassohn nevus [ICD-11:LD2D.Y] | ||||
| The Expression Level of Disease Section Compare with the Healthy Individual Tissue | p-value:5.4653771917296544e-08; Fold-change:0.0641447368421052; Z-score:-6.438382399 | ||||
| DT expression in the diseased tissue of patients
DT expression in the normal tissue of healthy individuals
|
|||||
|
 Please Click the above Thumbnail to View/Download
the Expression Barchart for All Samples Please Click the above Thumbnail to View/Download
the Expression Barchart for All Samples
|
||||
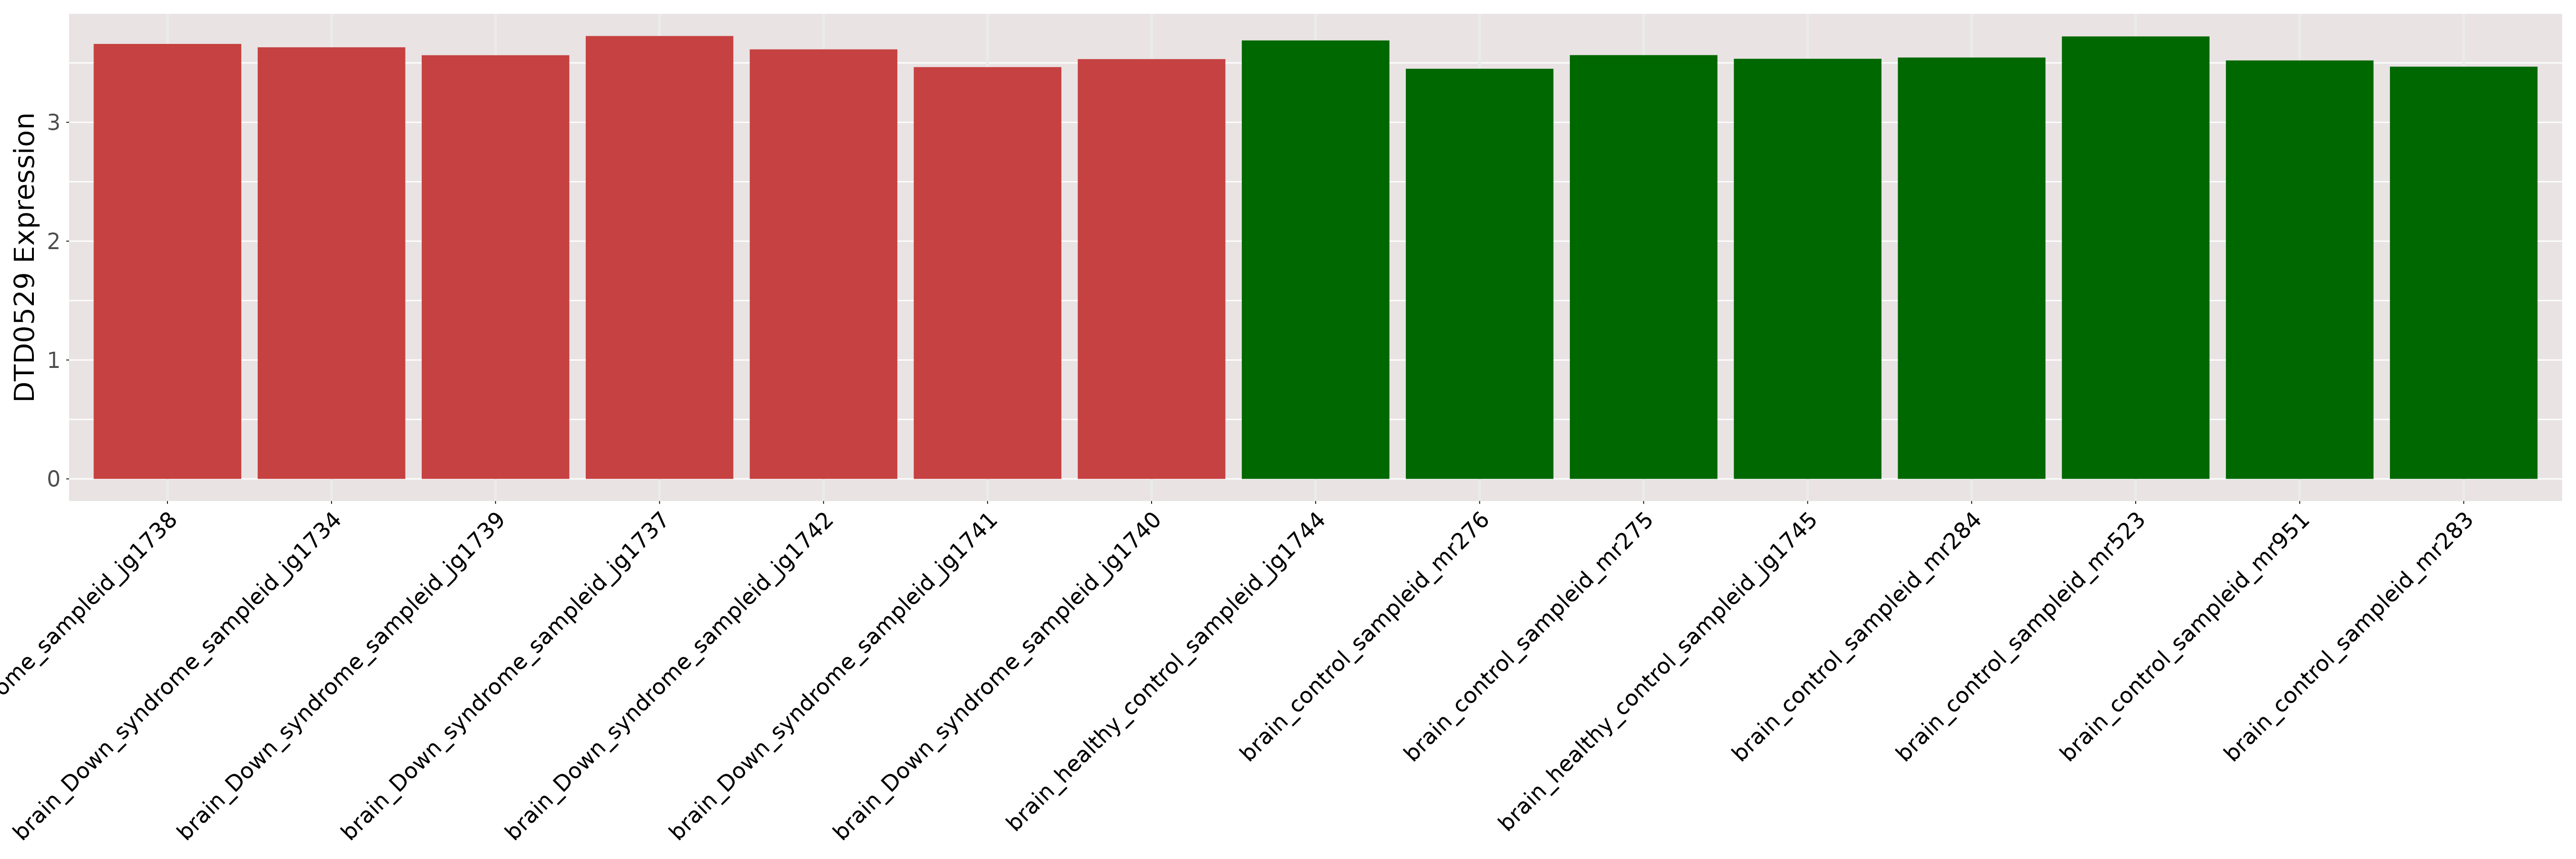
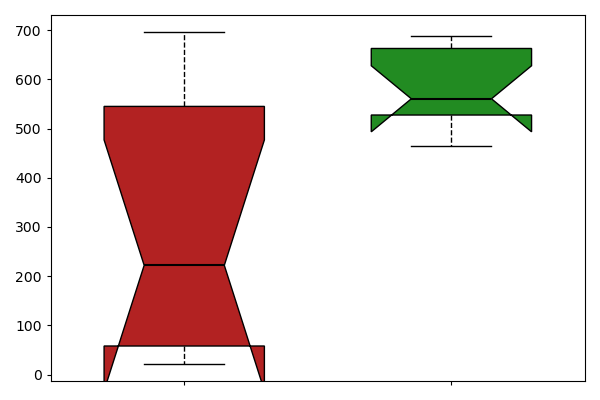
| [+] ICD-11: LD40.0 Complete trisomy 21 (Down syndrome) | Click to Show/Hide the Full List | ||||
| The Studied Tissue | Brain | ||||
| The Specified Disease | Down syndrome [ICD-11:LD40.0] | ||||
| The Expression Level of Disease Section Compare with the Healthy Individual Tissue | p-value:0.4553473181953478; Fold-change:1.0209131419946786; Z-score:0.3788842915858801 | ||||
| DT expression in the diseased tissue of patients
DT expression in the normal tissue of healthy individuals
|
|||||
|
 Please Click the above Thumbnail to View/Download
the Expression Barchart for All Samples Please Click the above Thumbnail to View/Download
the Expression Barchart for All Samples
|
||||
| ICD-11: 25 Codes for special purposes | |||||
| [+] ICD-11: RA01 COVID-19 | Click to Show/Hide the Full List | ||||
| The Studied Tissue | Lung | ||||
| The Specified Disease | Covid [ICD-11:RA01.0] | ||||
| The Expression Level of Disease Section Compare with the Healthy Individual Tissue | p-value:0.0273255959613133; Fold-change:0.3960749330954505; Z-score:-0.982581029 | ||||
| DT expression in the diseased tissue of patients
DT expression in the normal tissue of healthy individuals
|
|||||
|
 Please Click the above Thumbnail to View/Download
the Expression Barchart for All Samples Please Click the above Thumbnail to View/Download
the Expression Barchart for All Samples
|
||||
| The Studied Tissue | Colon | ||||
| The Specified Disease | Covid [ICD-11:RA01.0] | ||||
| The Expression Level of Disease Section Compare with the Healthy Individual Tissue | p-value:0.785959967073128; Fold-change:0.9690560125342734; Z-score:-0.139986413 | ||||
| DT expression in the diseased tissue of patients
DT expression in the normal tissue of healthy individuals
|
|||||
|
 Please Click the above Thumbnail to View/Download
the Expression Barchart for All Samples Please Click the above Thumbnail to View/Download
the Expression Barchart for All Samples
|
||||
| ICD-11: 28 Extension Codes | |||||
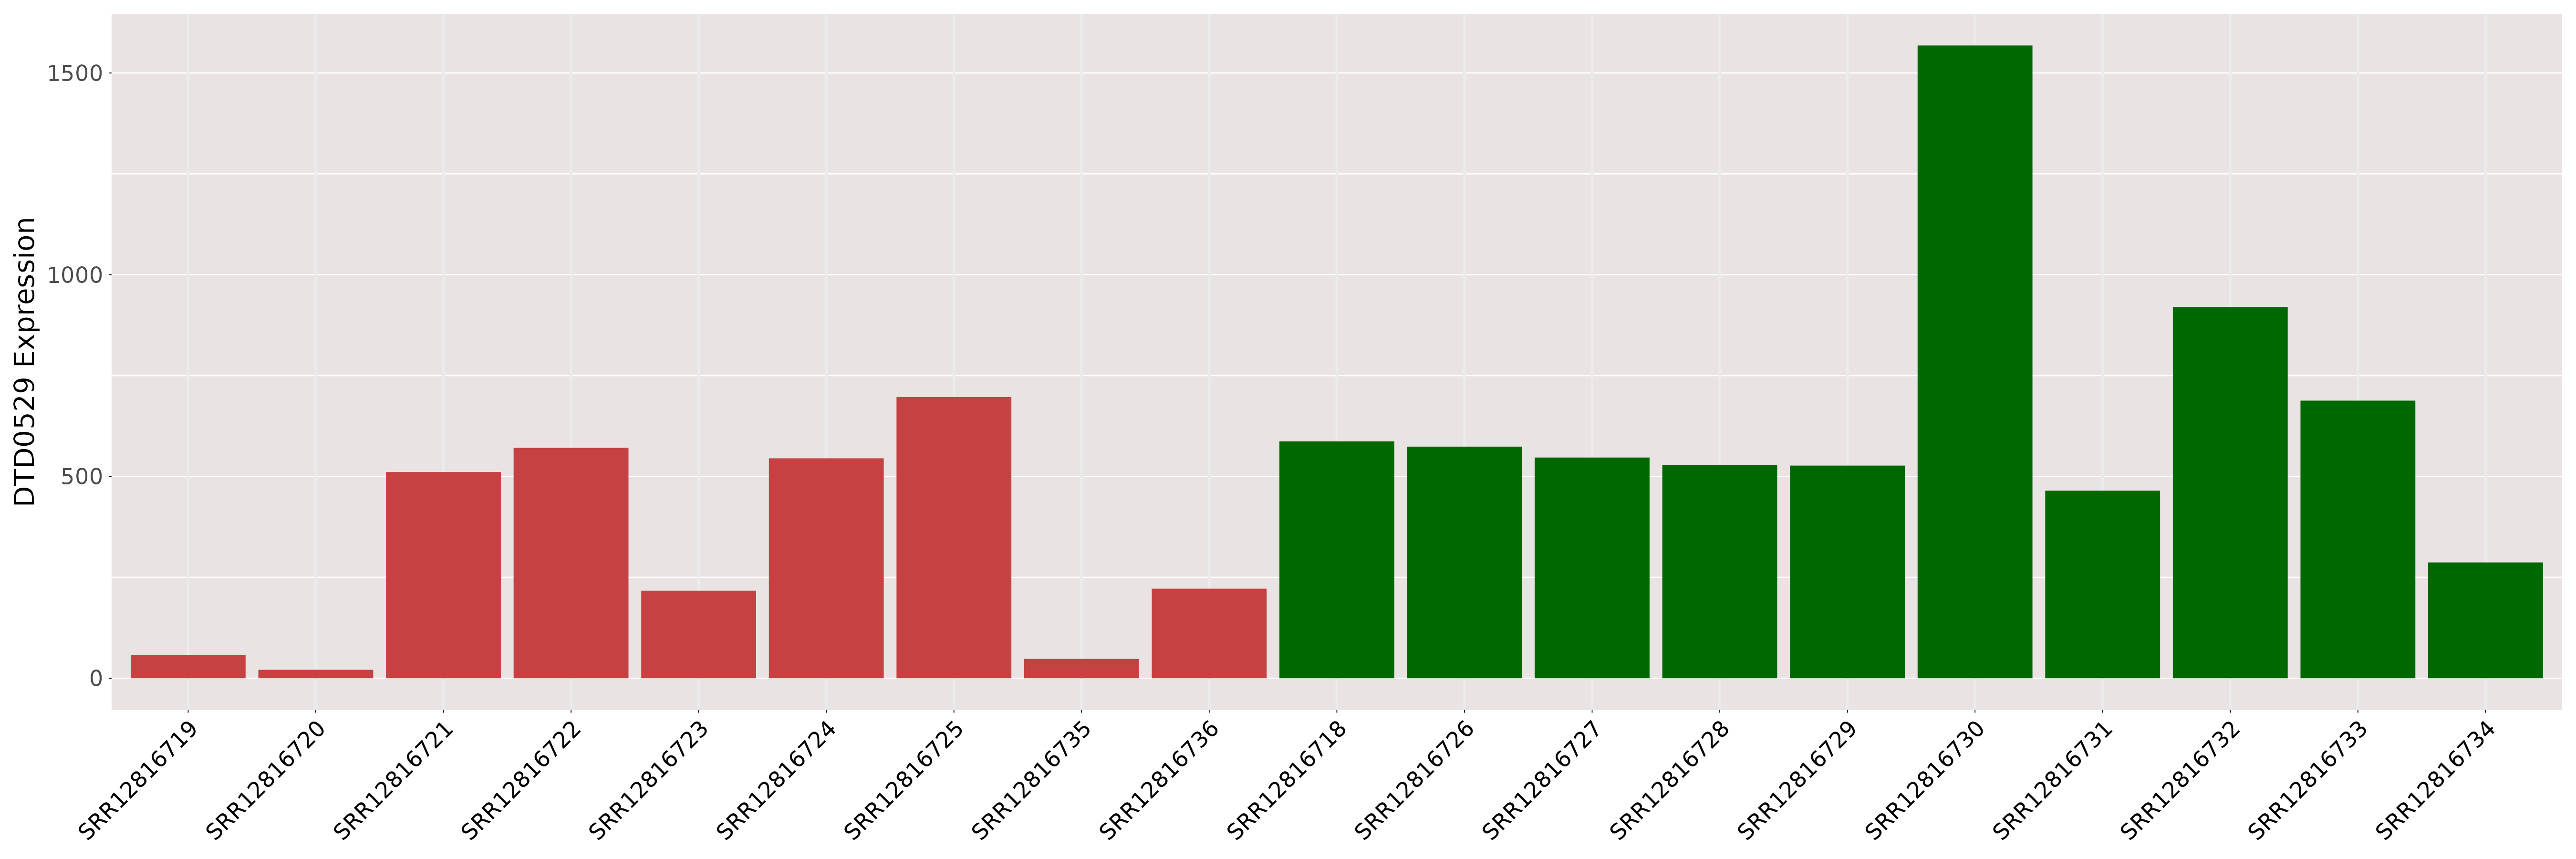
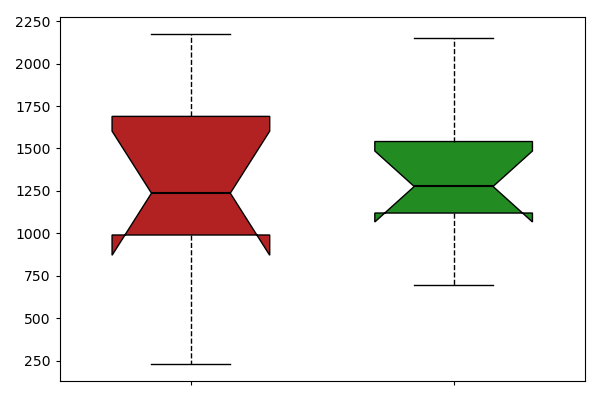
| [+] ICD-11: XH12D2 Pilocytic astrocytoma | Click to Show/Hide the Full List | ||||
| The Studied Tissue | Brain | ||||
| The Specified Disease | Astrocytoma, pilocytic [ICD-11:XH12D2] | ||||
| The Expression Level of Disease Section Compare with the Healthy Individual Tissue | p-value:5.406289347163648e-08; Fold-change:1.5729793055182884; Z-score:3.694313205025285 | ||||
| DT expression in the diseased tissue of patients
DT expression in the normal tissue of healthy individuals
|
|||||
|
 Please Click the above Thumbnail to View/Download
the Expression Barchart for All Samples Please Click the above Thumbnail to View/Download
the Expression Barchart for All Samples
|
||||
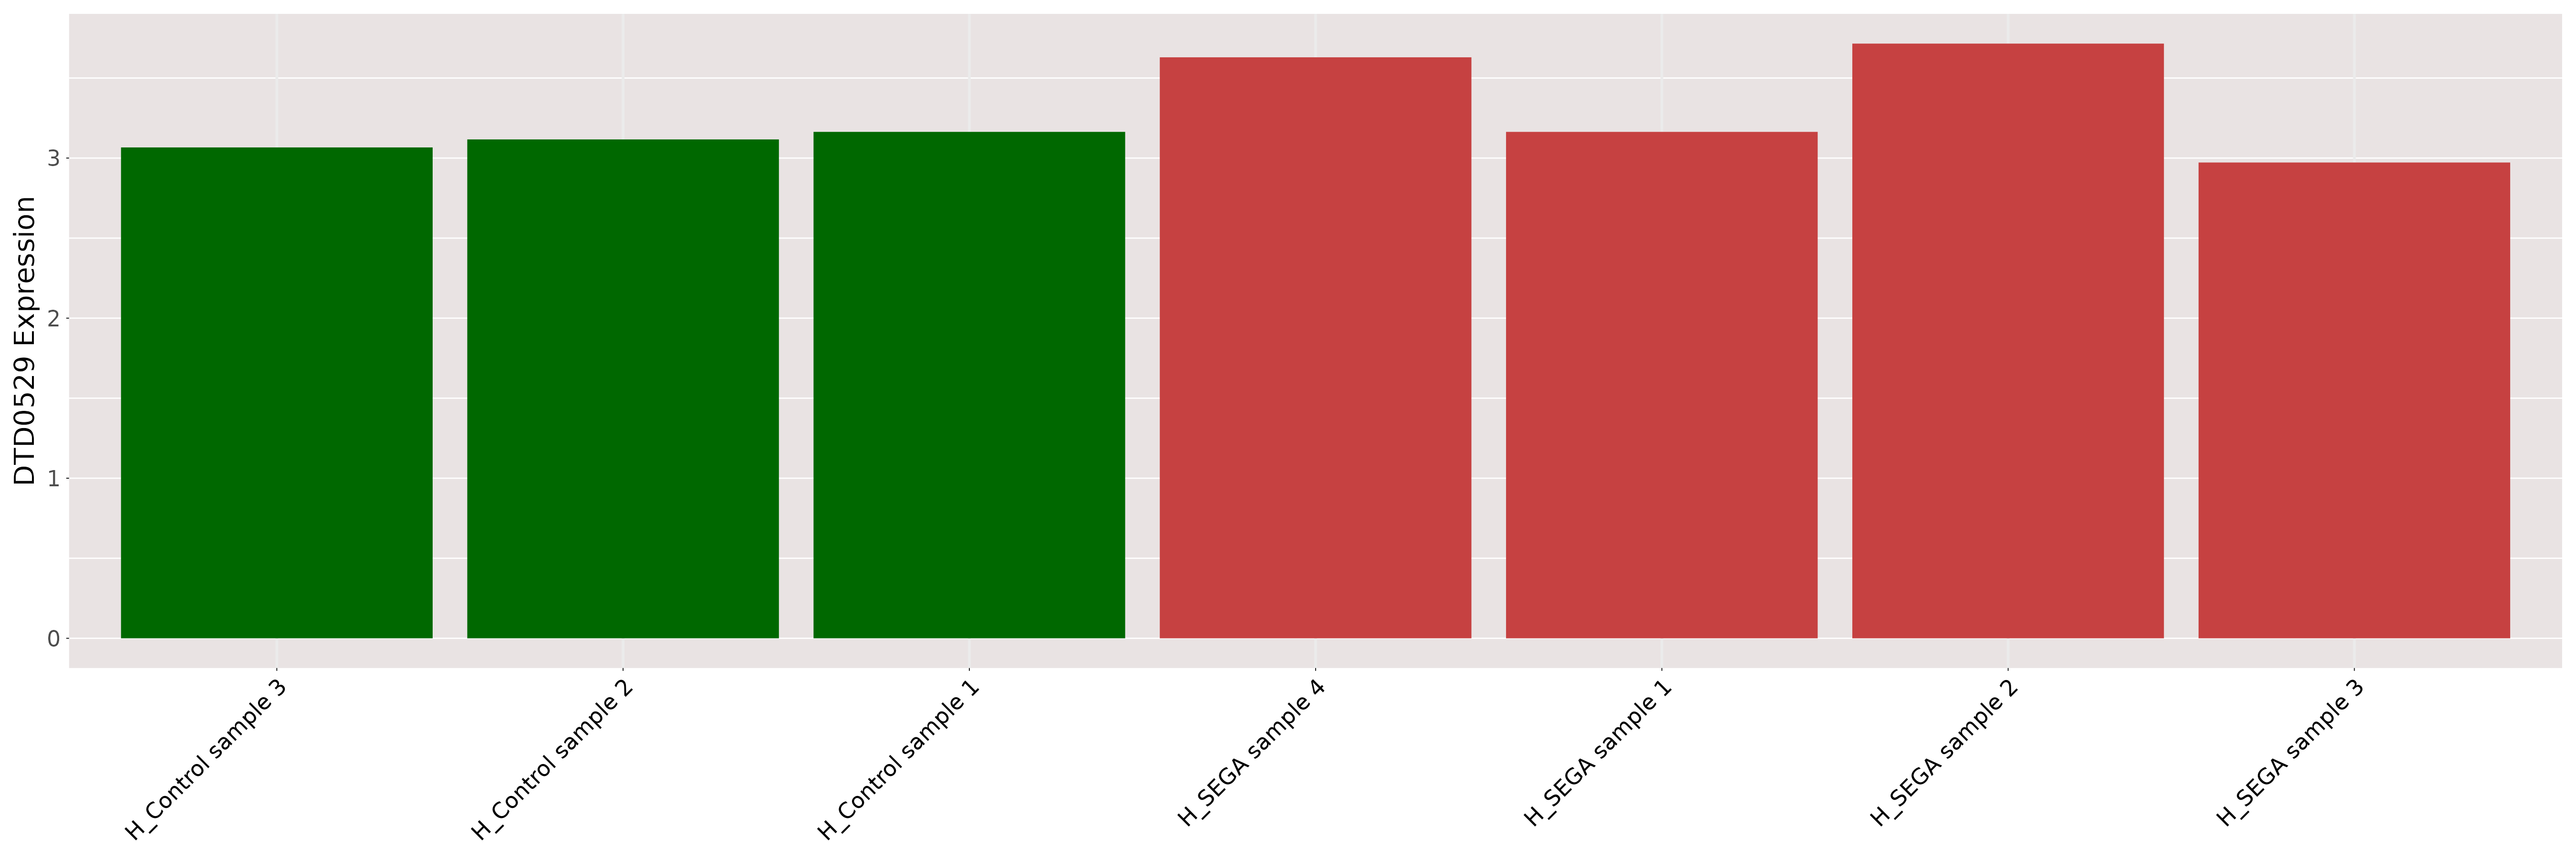
| [+] ICD-11: XH1L48 Subependymal giant cell astrocytoma | Click to Show/Hide the Full List | ||||
| The Studied Tissue | Brain | ||||
| The Specified Disease | Subependymal giant cell astrocytoma [ICD-11:XH1L48] | ||||
| The Expression Level of Disease Section Compare with the Healthy Individual Tissue | p-value:0.2872201787634706; Fold-change:1.0898711930606355; Z-score:5.238684186304594 | ||||
| DT expression in the diseased tissue of patients
DT expression in the normal tissue of healthy individuals
|
|||||
|
 Please Click the above Thumbnail to View/Download
the Expression Barchart for All Samples Please Click the above Thumbnail to View/Download
the Expression Barchart for All Samples
|
||||
| [+] ICD-11: XH77N6 Clear cell sarcoma, NOS (soft tissue) | Click to Show/Hide the Full List | ||||
| The Studied Tissue | Kidney | ||||
| The Specified Disease | Clear cell sarcoma [ICD-11:XH77N6] | ||||
| The Expression Level of Disease Section Compare with the Healthy Individual Tissue | p-value:0.203303164079099; Fold-change:1.1127922062038336; Z-score:2.9195356261688854 | ||||
| DT expression in the diseased tissue of patients
DT expression in the normal tissue of healthy individuals
|
|||||
|
|
|
||||
| [+] ICD-11: XH7ZQ4 Atypical teratoid/rhabdoid tumour | Click to Show/Hide the Full List | ||||
| The Studied Tissue | Brain | ||||
| The Specified Disease | Atypical teratoid rhabdoid tumor [ICD-11:XH7ZQ4] | ||||
| The Expression Level of Disease Section Compare with the Healthy Individual Tissue | p-value:0.5645493801232602; Fold-change:0.9020925935305596; Z-score:-0.404540364 | ||||
| DT expression in the diseased tissue of patients
DT expression in the normal tissue of healthy individuals
|
|||||
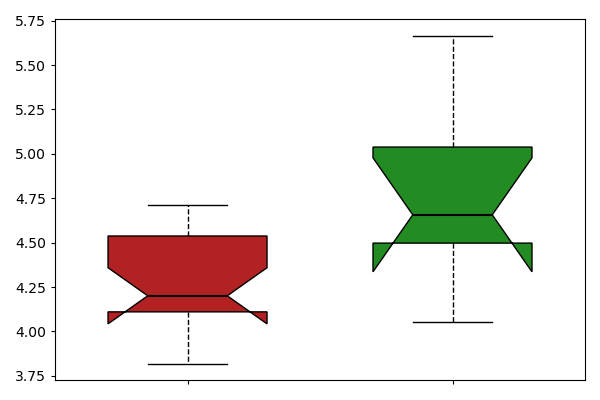
|
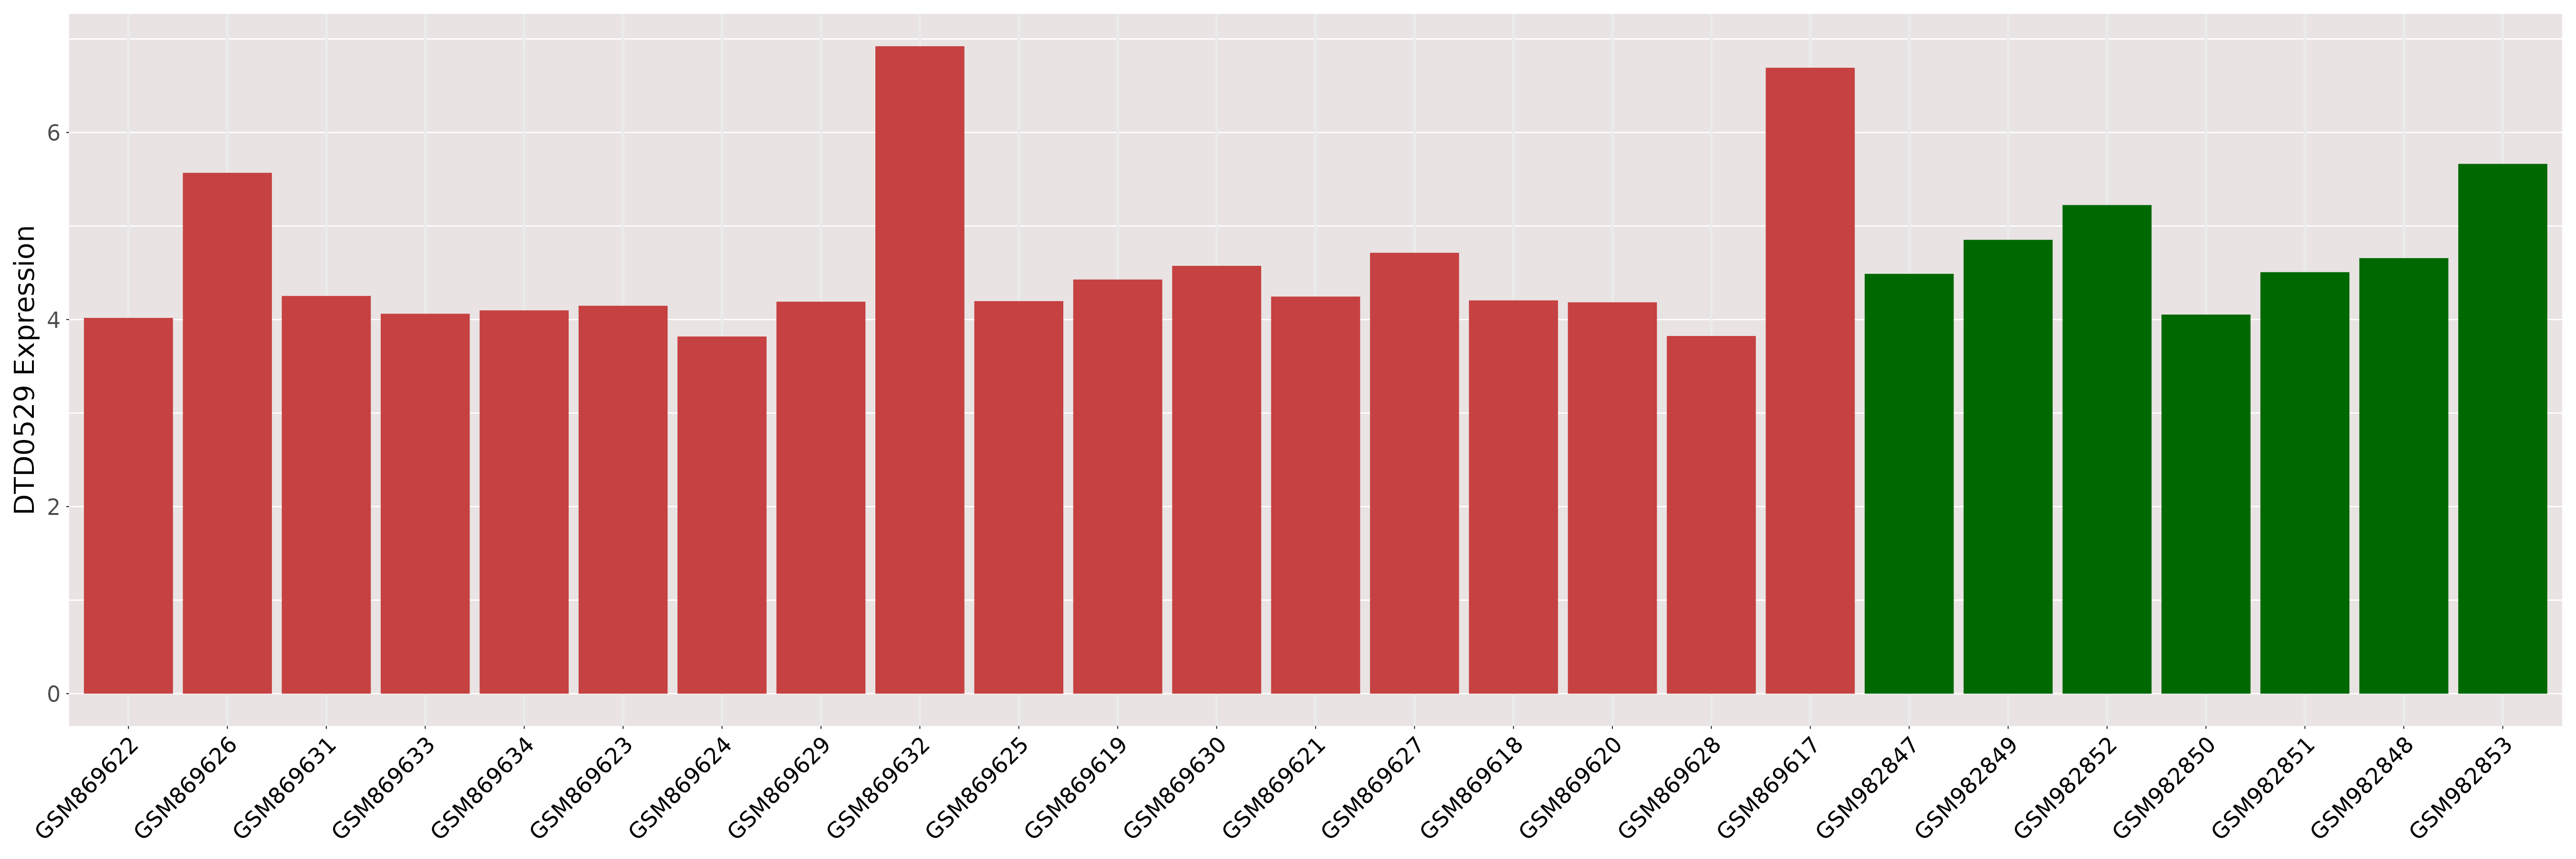 Please Click the above Thumbnail to View/Download
the Expression Barchart for All Samples Please Click the above Thumbnail to View/Download
the Expression Barchart for All Samples
|
||||
If you find any error in data or bug in web service, please kindly report it to Dr. Li and Dr. Fu.