
Detail Information of Disease-specific Protein Abundances
| General Information of Drug Transporter (DT) | |||||
|---|---|---|---|---|---|
| DT ID | DTD0522 Transporter Info | ||||
| Gene Name | CACNB4 | ||||
| Protien Name | Voltage-dependent L-type calcium channel beta-4 | ||||
| Gene ID | |||||
| UniProt ID | |||||
| Disease-specific Protein Abundances of DT (DPAD) | |||||
|---|---|---|---|---|---|
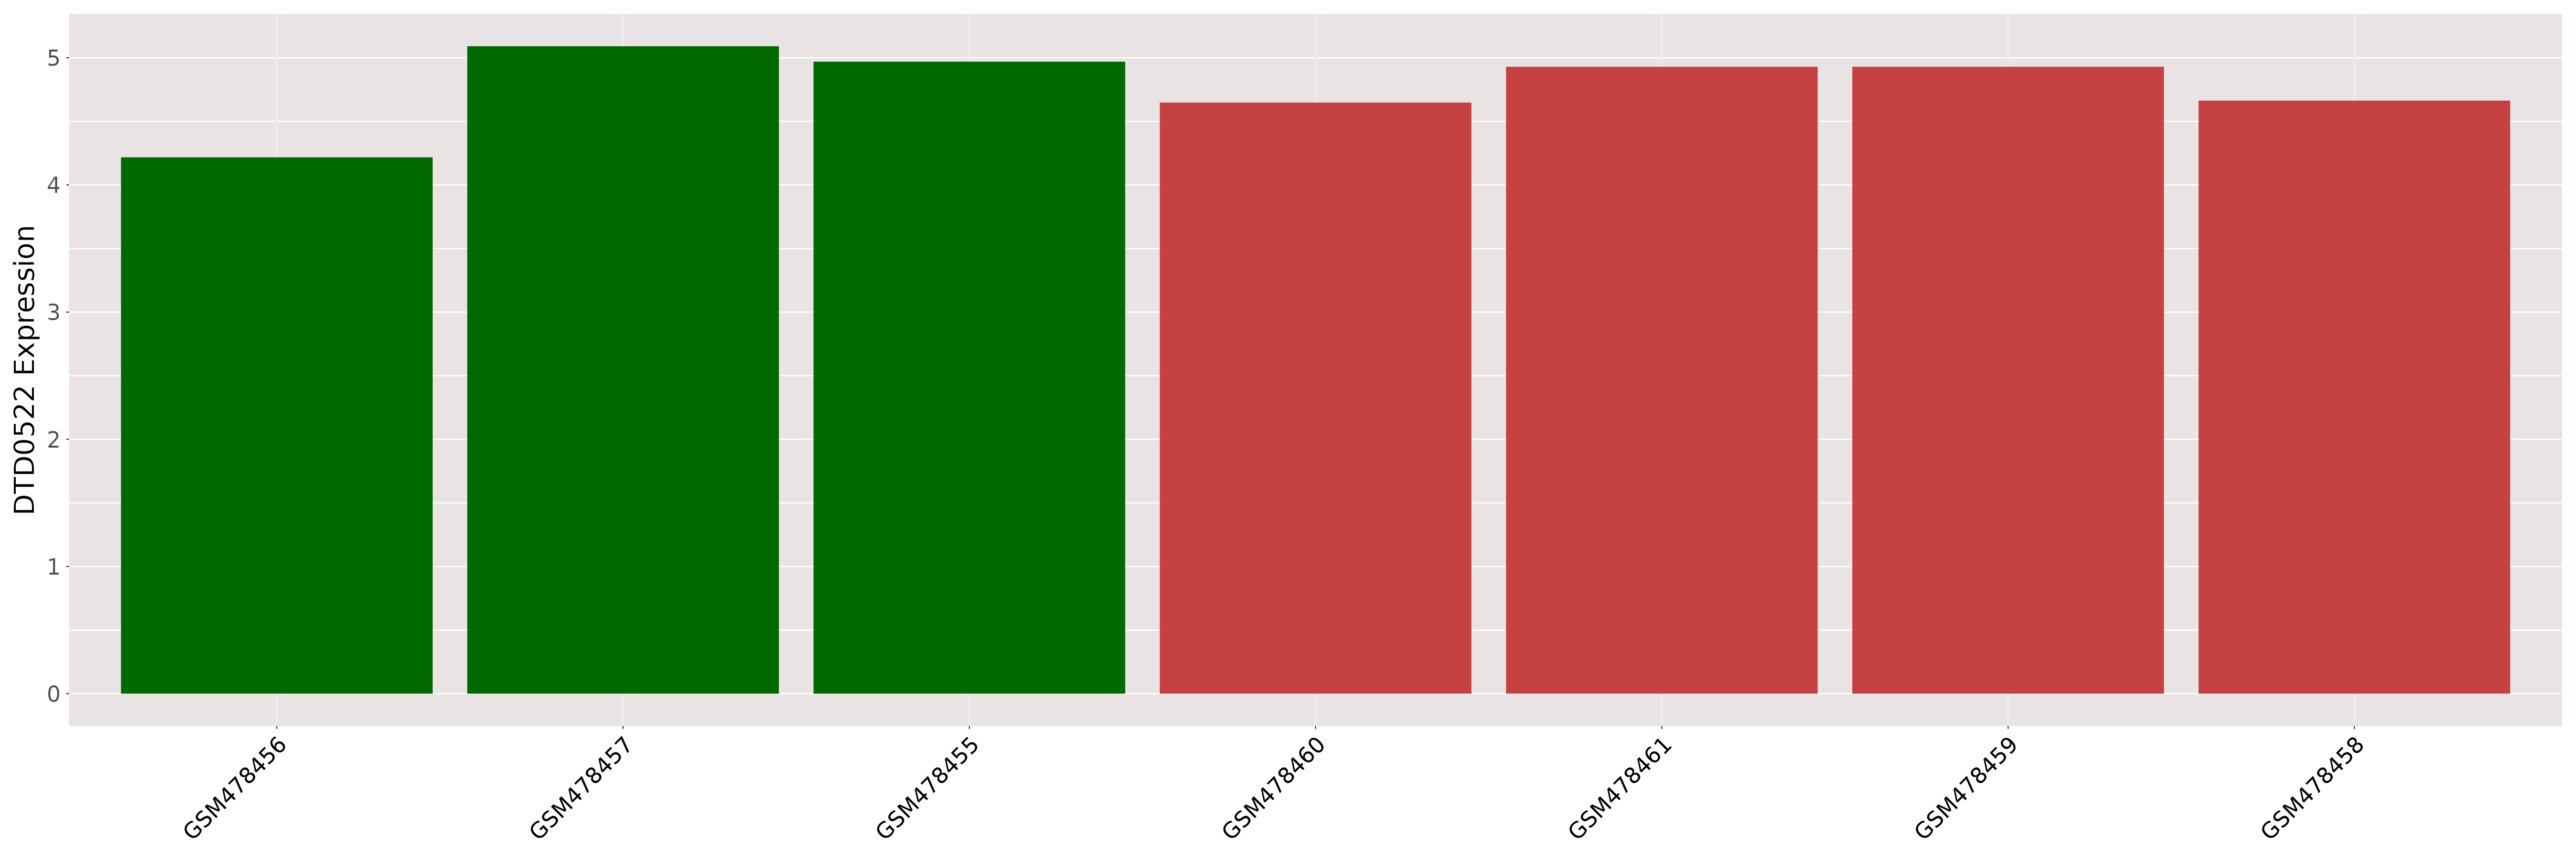
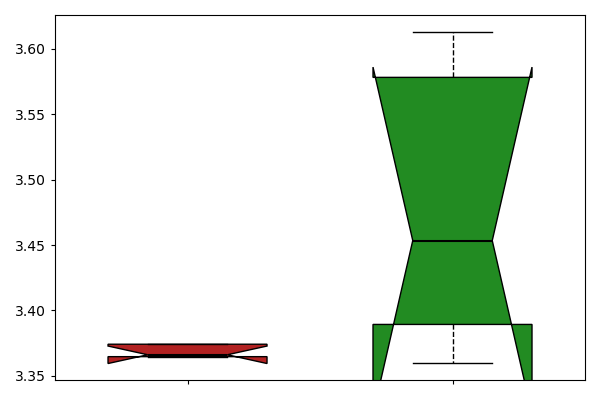
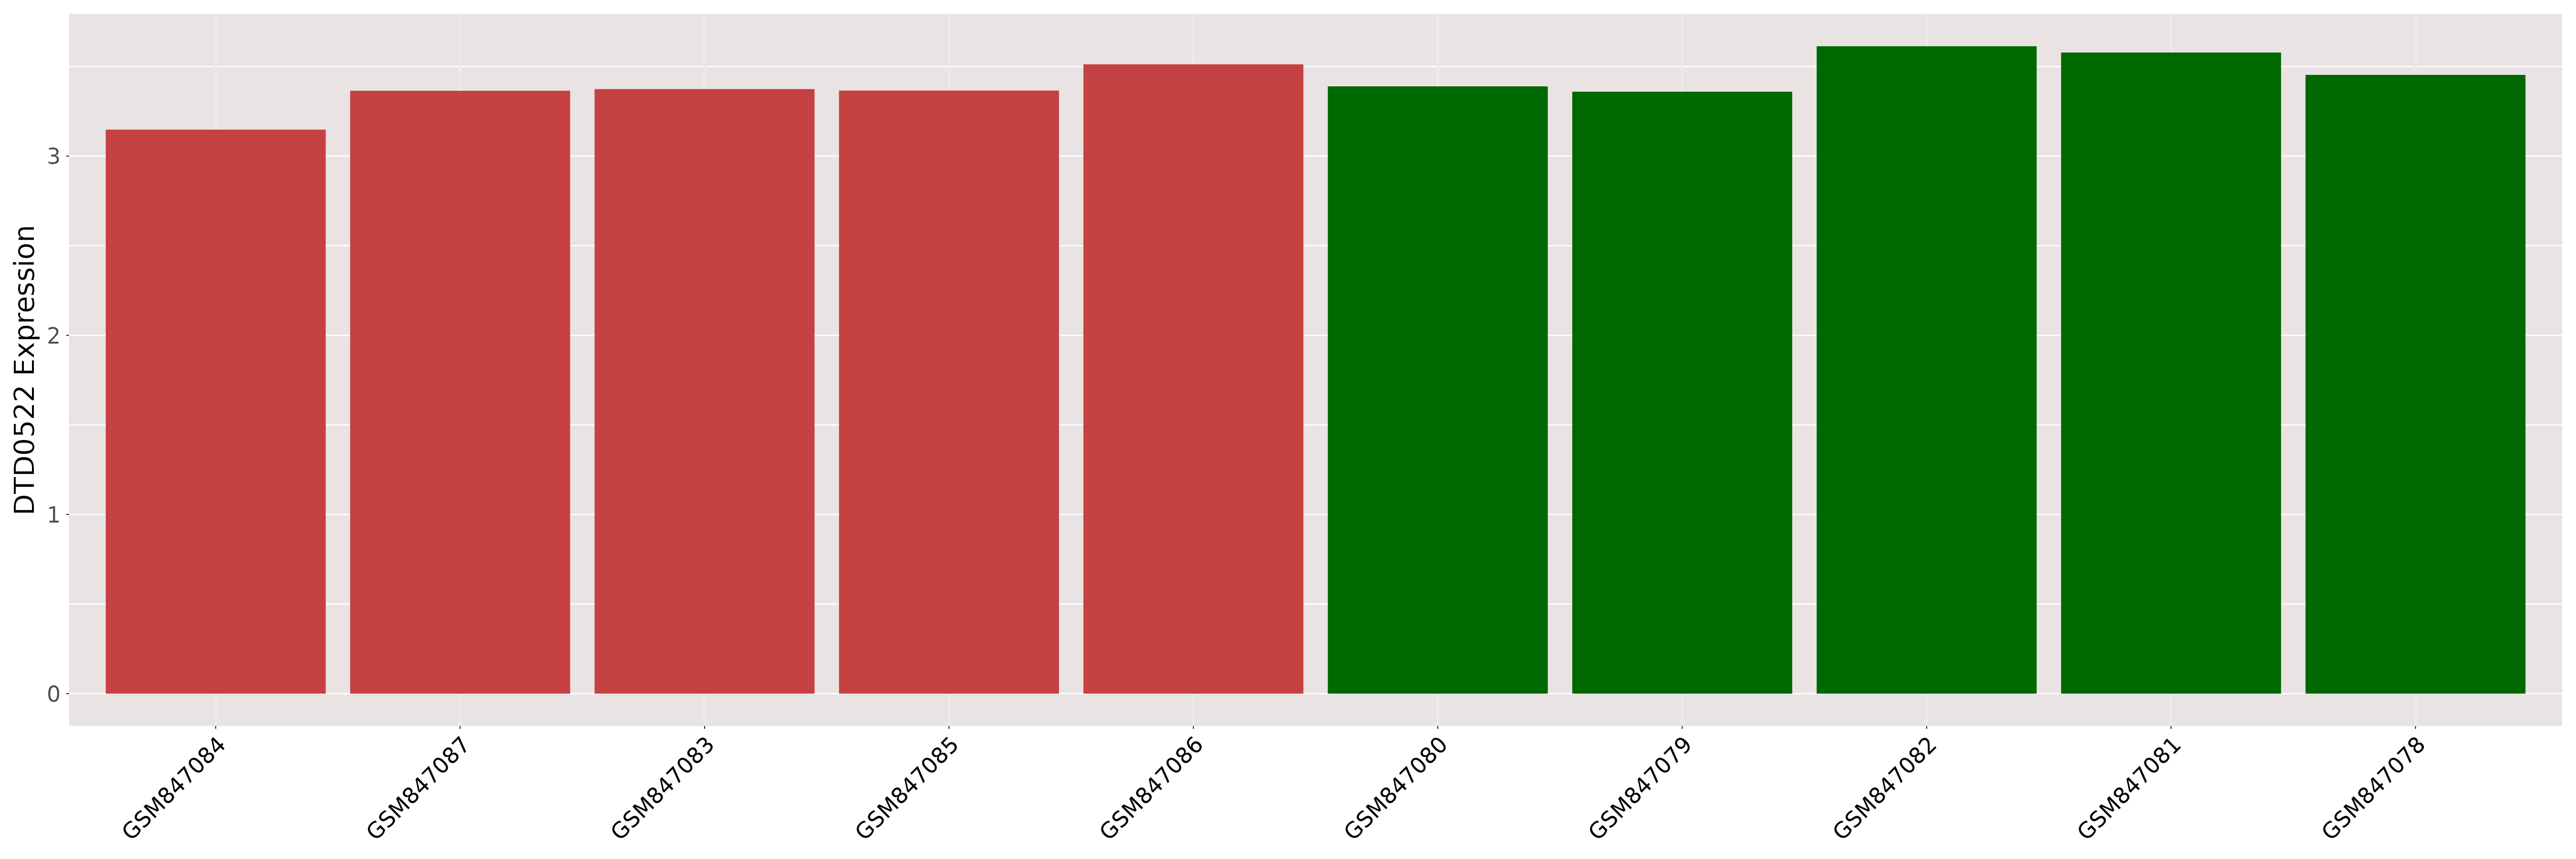
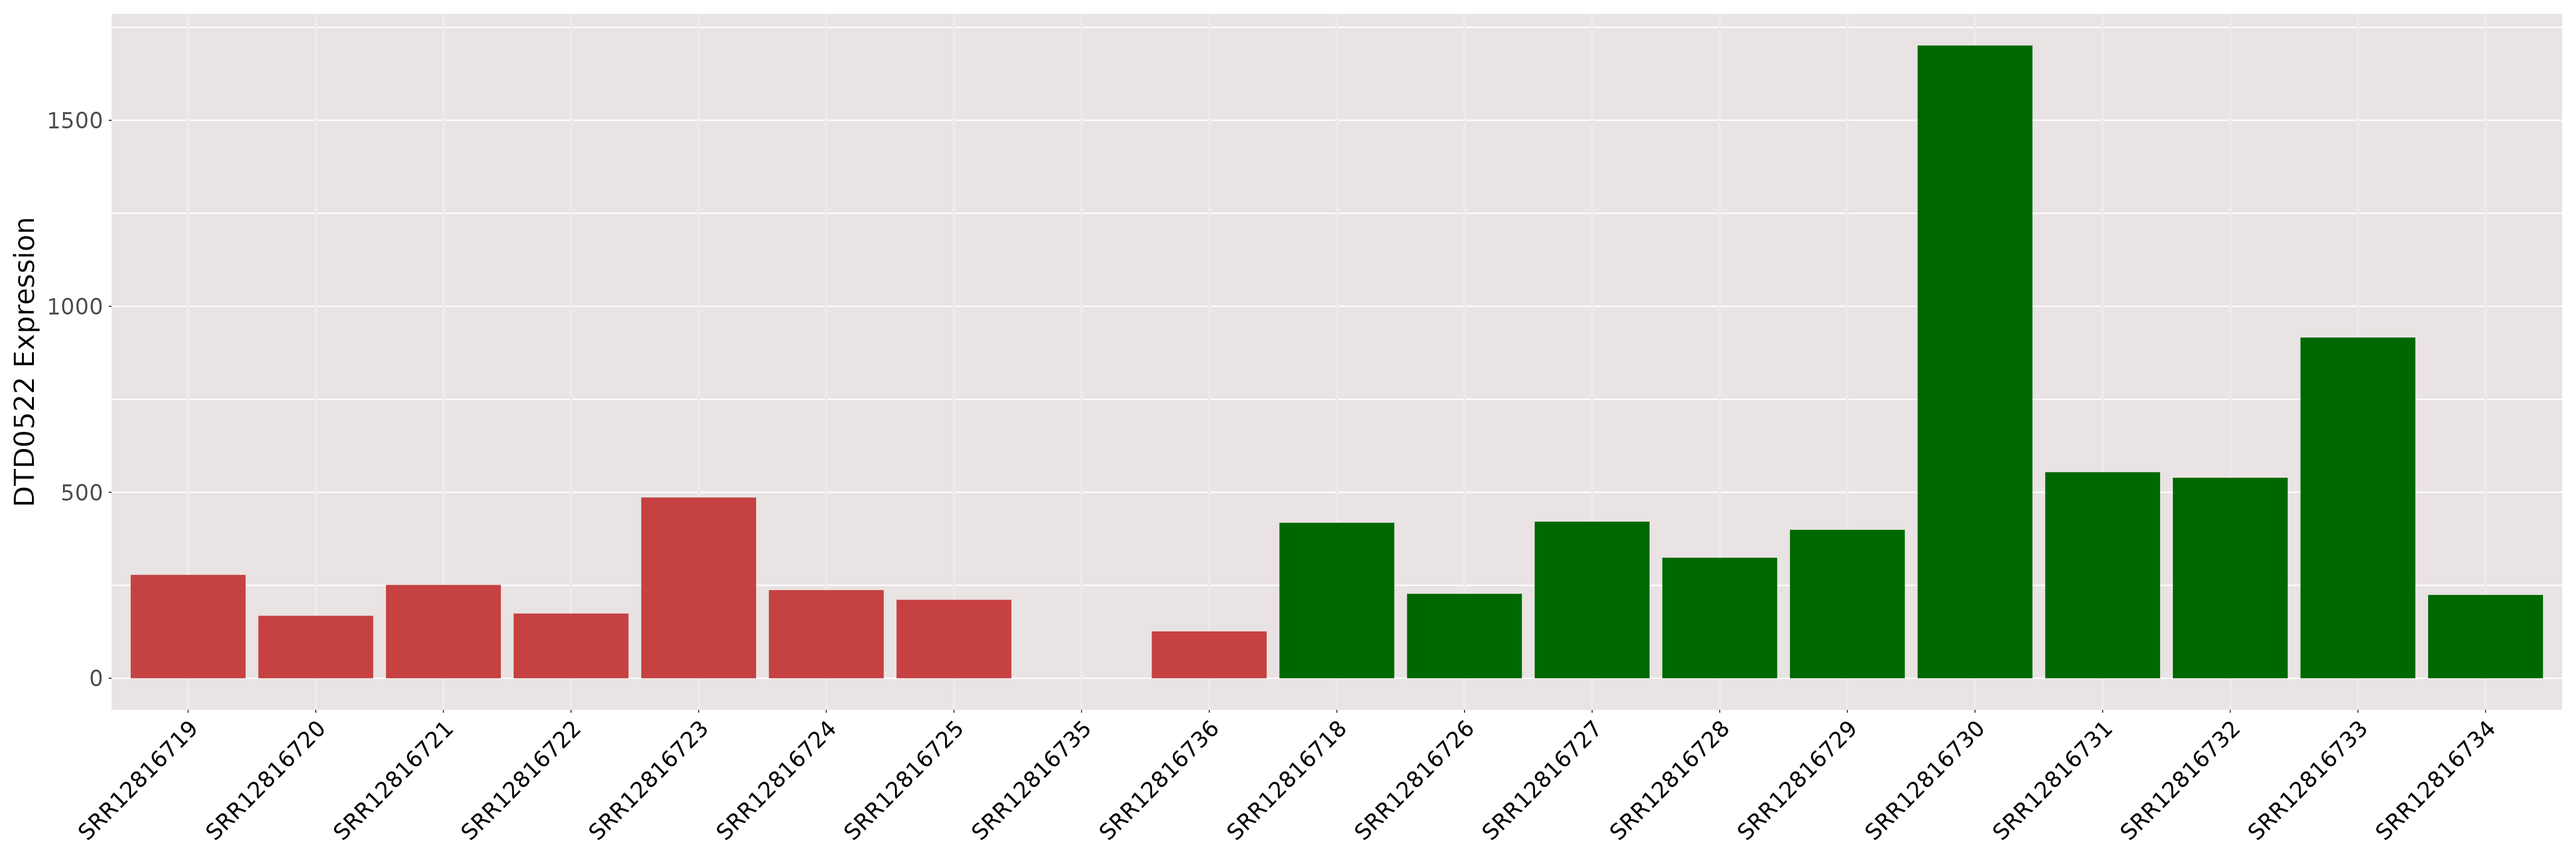
| ICD-11: 01 Certain infectious or parasitic disease | |||||
| [+] ICD-11: 1E50.1 Acute hepatitis B (viral hepatitis B) | Click to Show/Hide the Full List | ||||
| The Studied Tissue | Liver | ||||
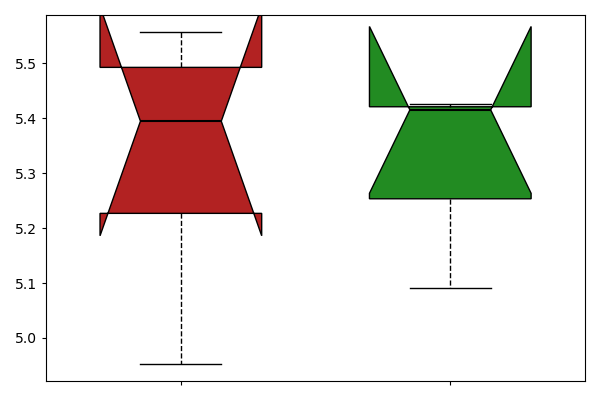
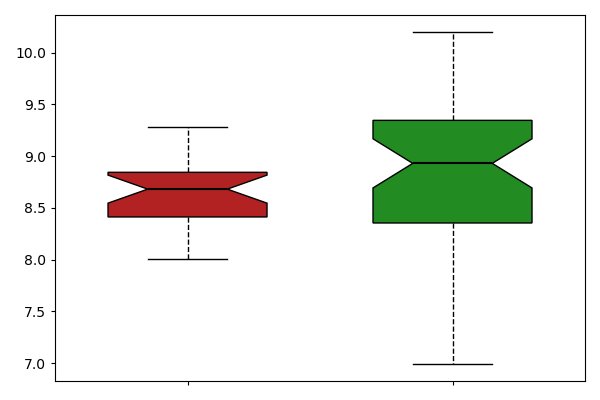
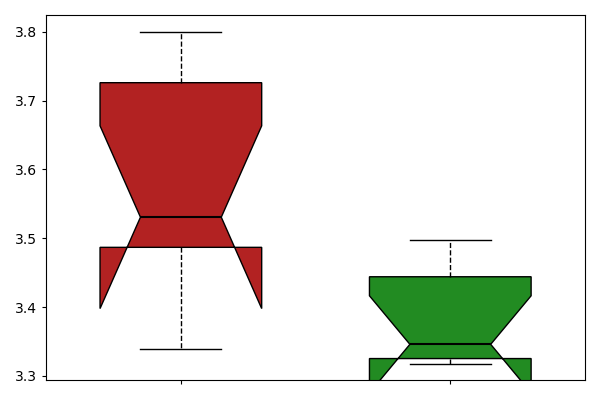
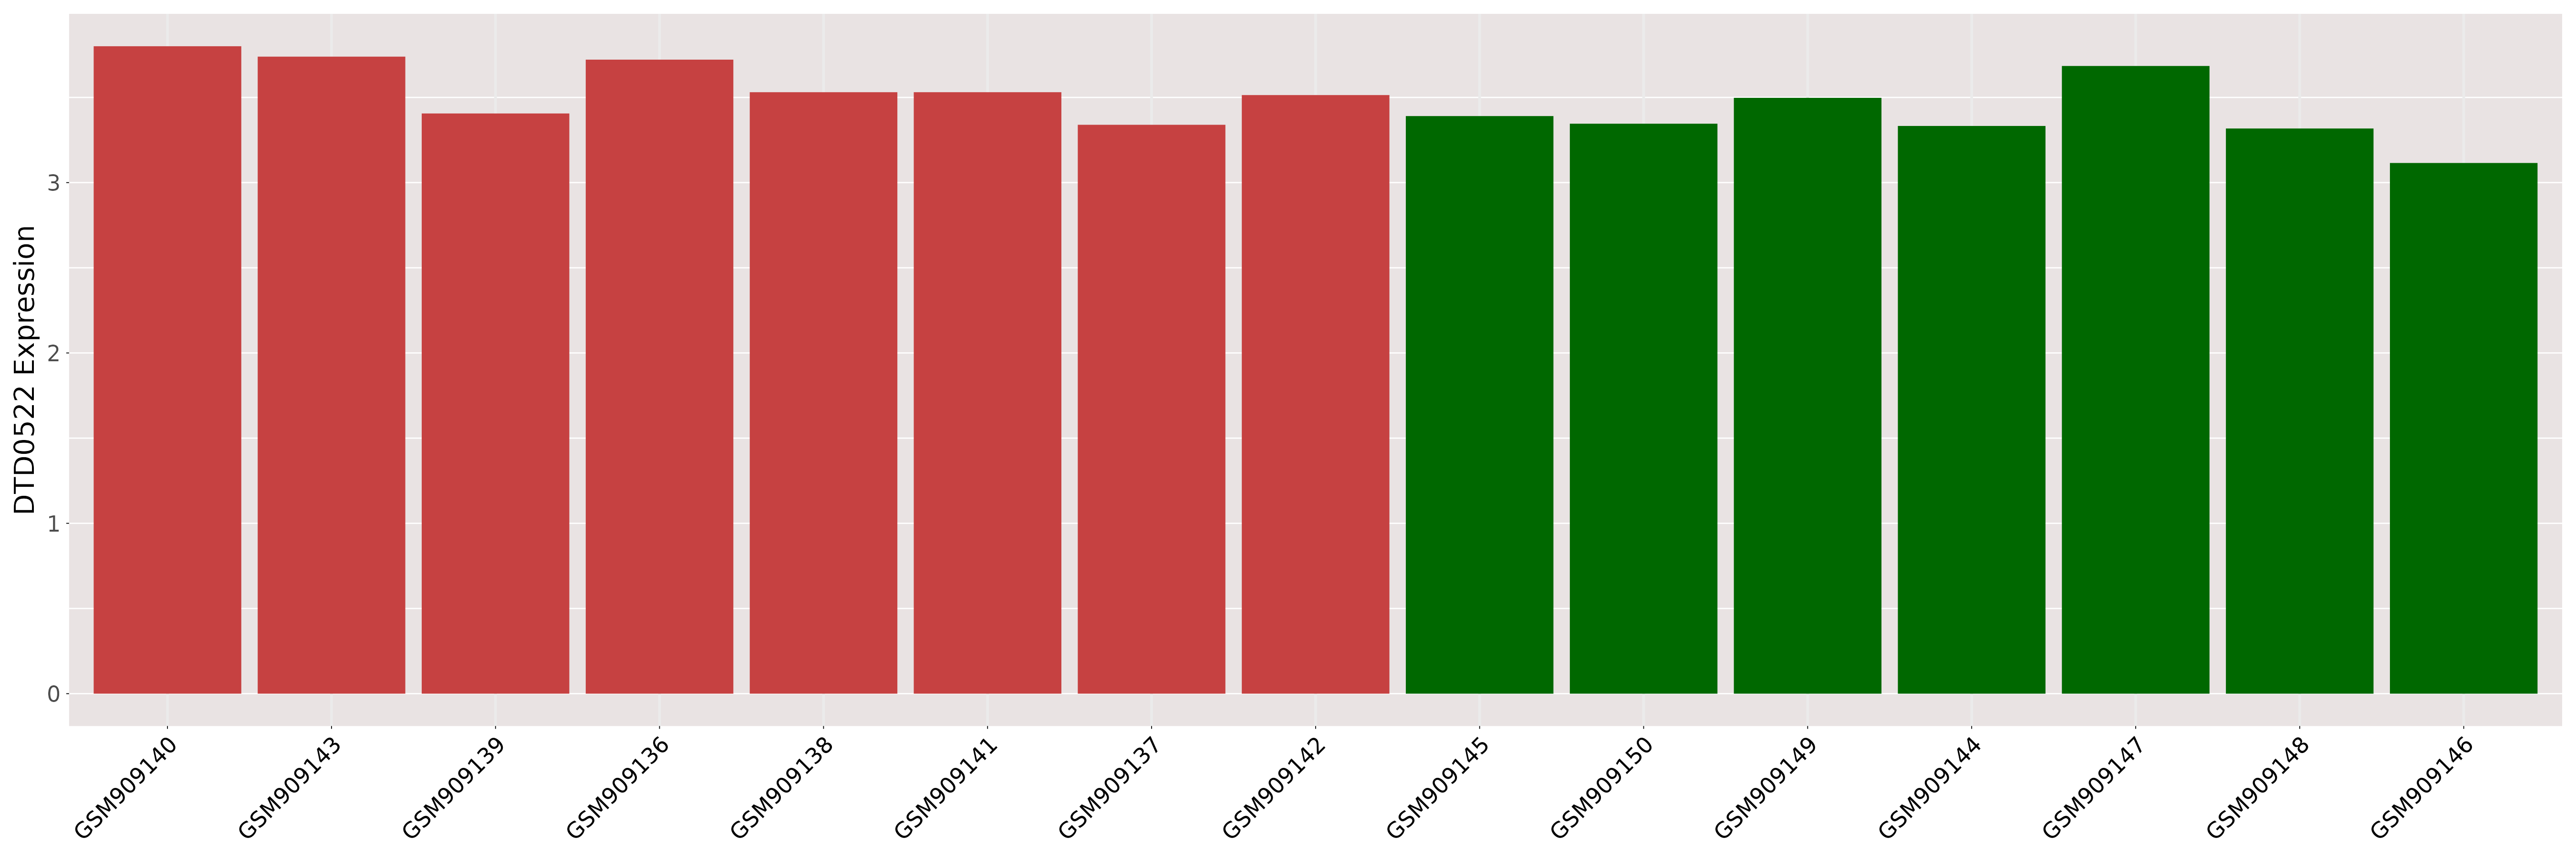
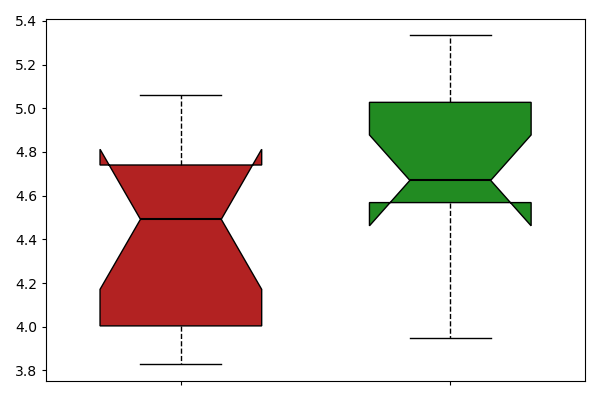
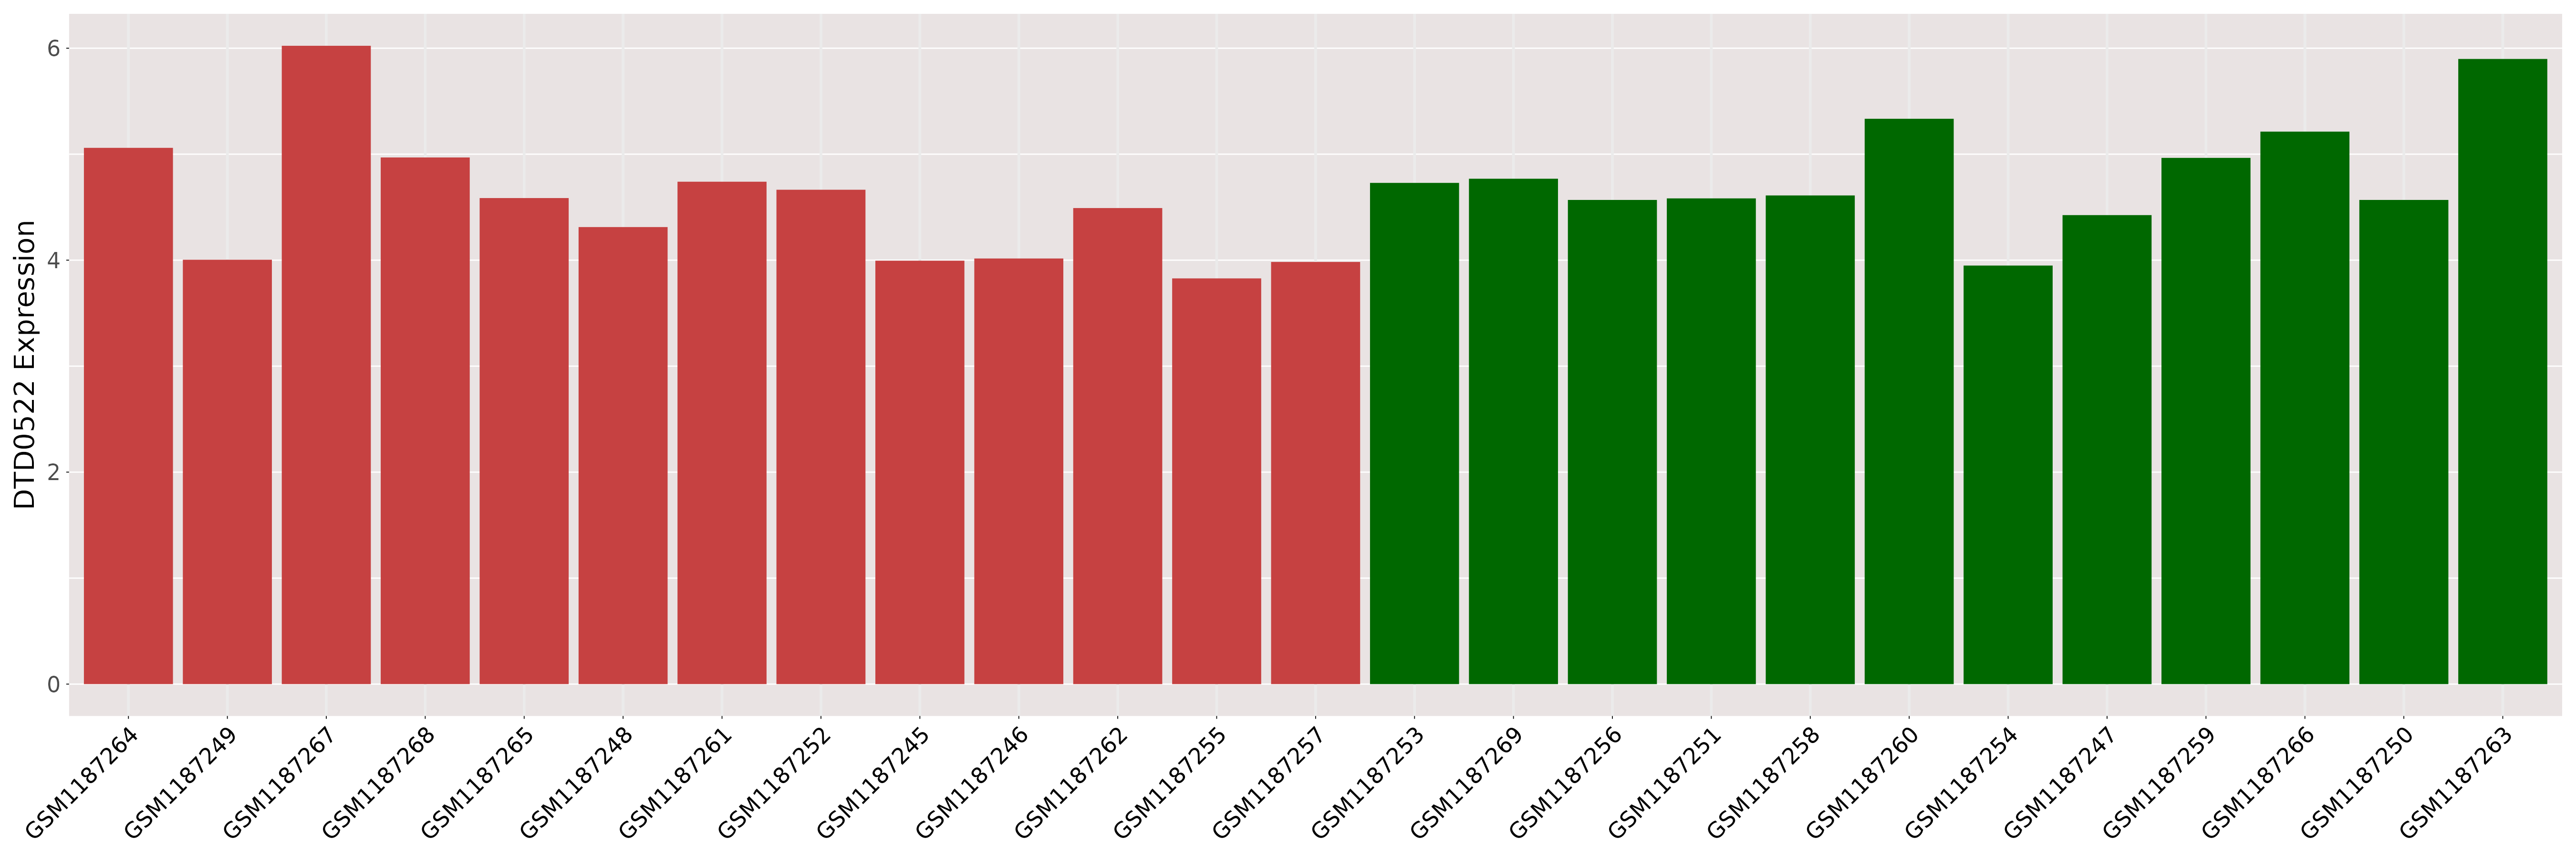
| The Specified Disease | Hepatitis b virus infection [ICD-11:1E50.1] | ||||
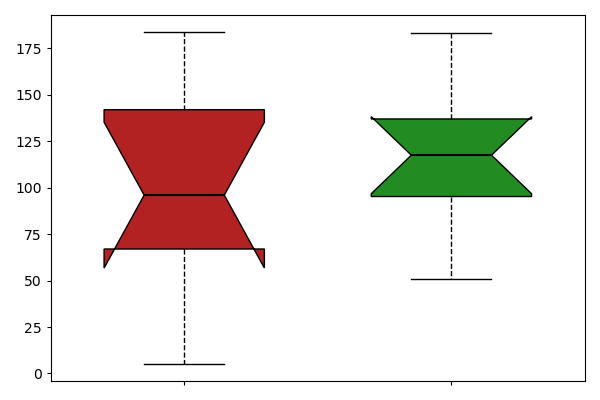
| The Expression Level of Disease Section Compare with the Healthy Individual Tissue | p-value:0.1479234944411216; Fold-change:1.0303634194243885; Z-score:0.5801147976741196 | ||||
|
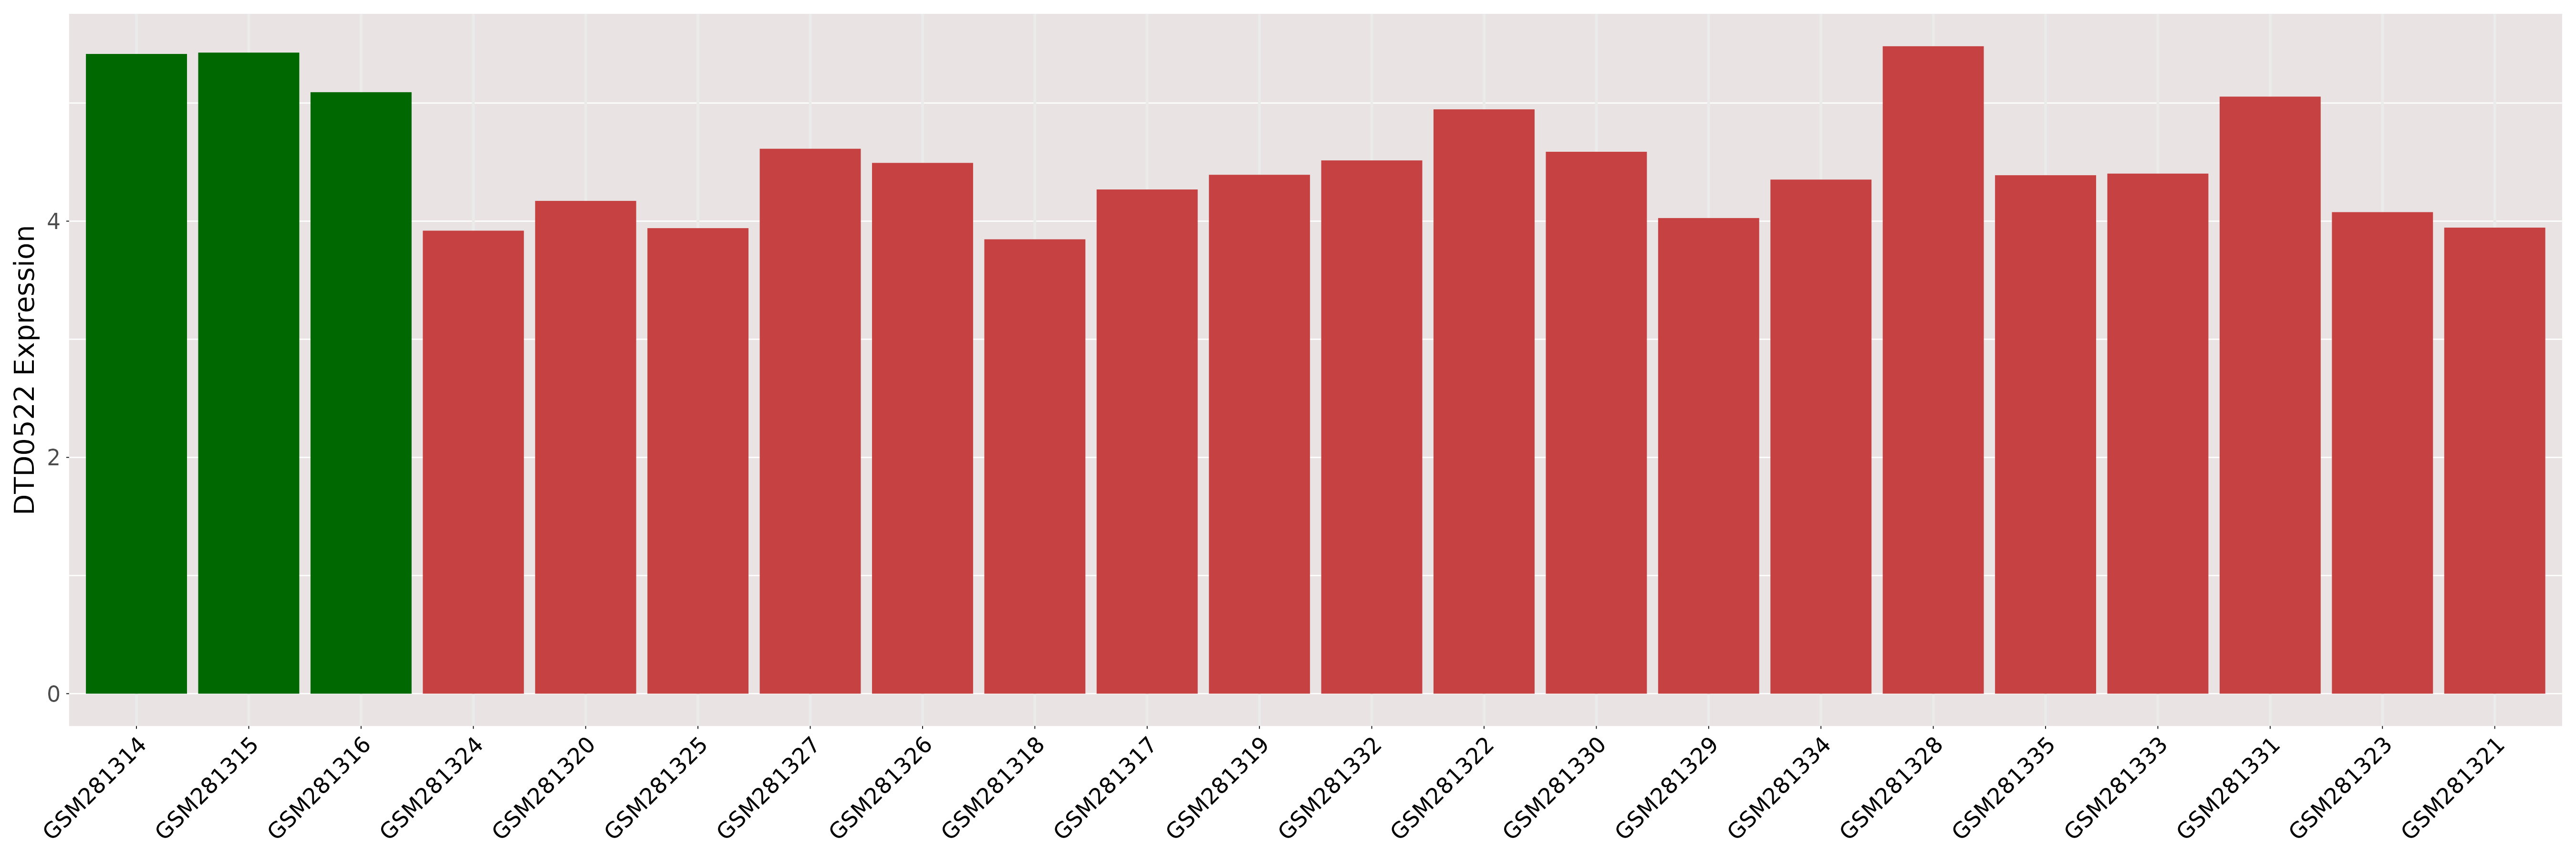
Please Click the above Thumbnail to View/Download the Expression Barchart for All Samples | ||||
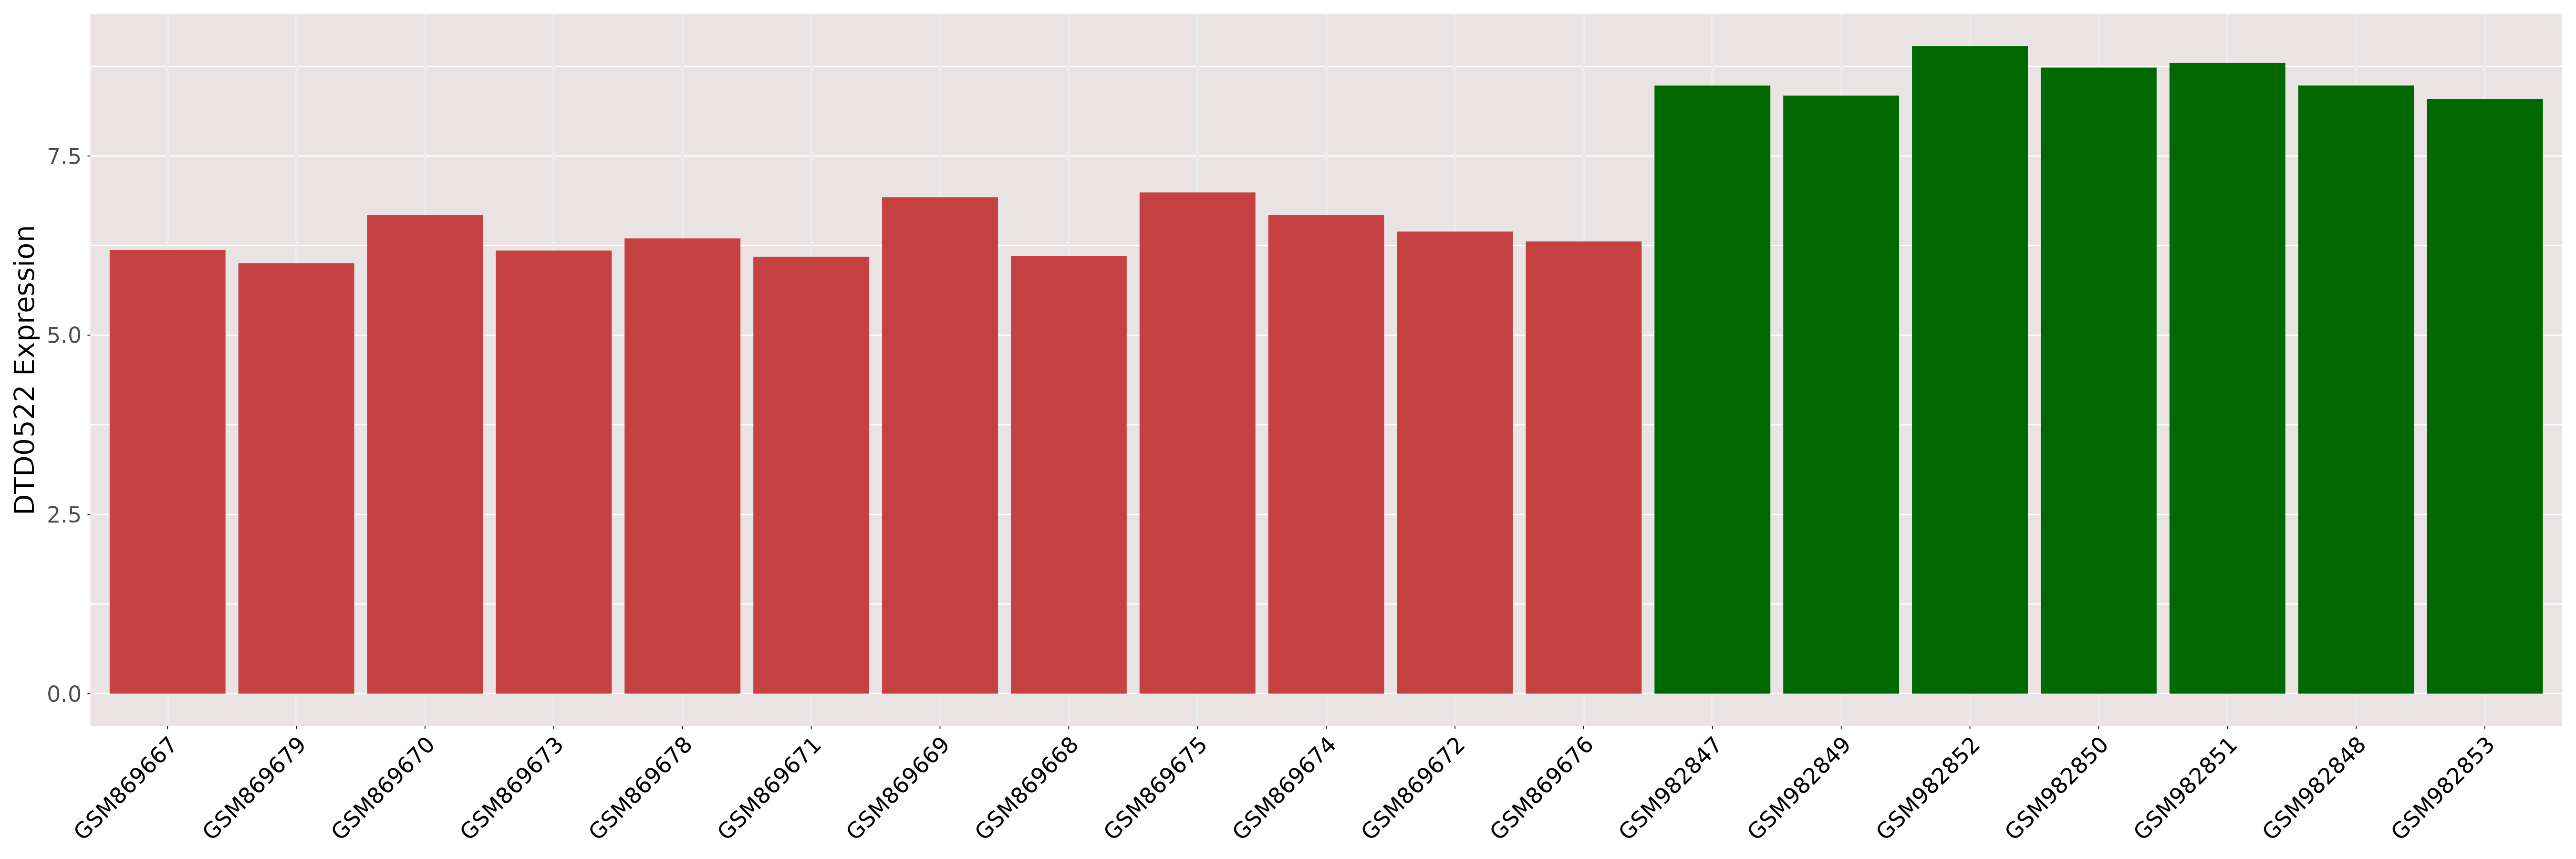
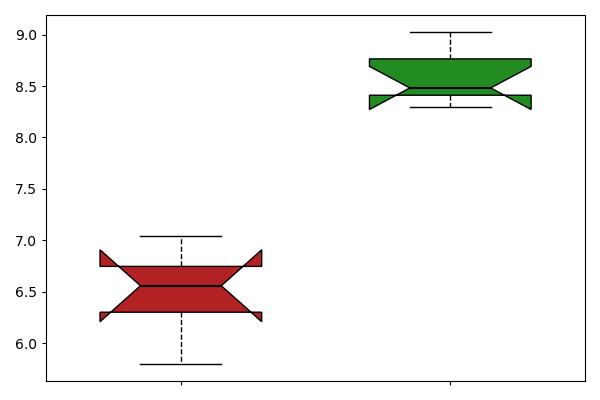
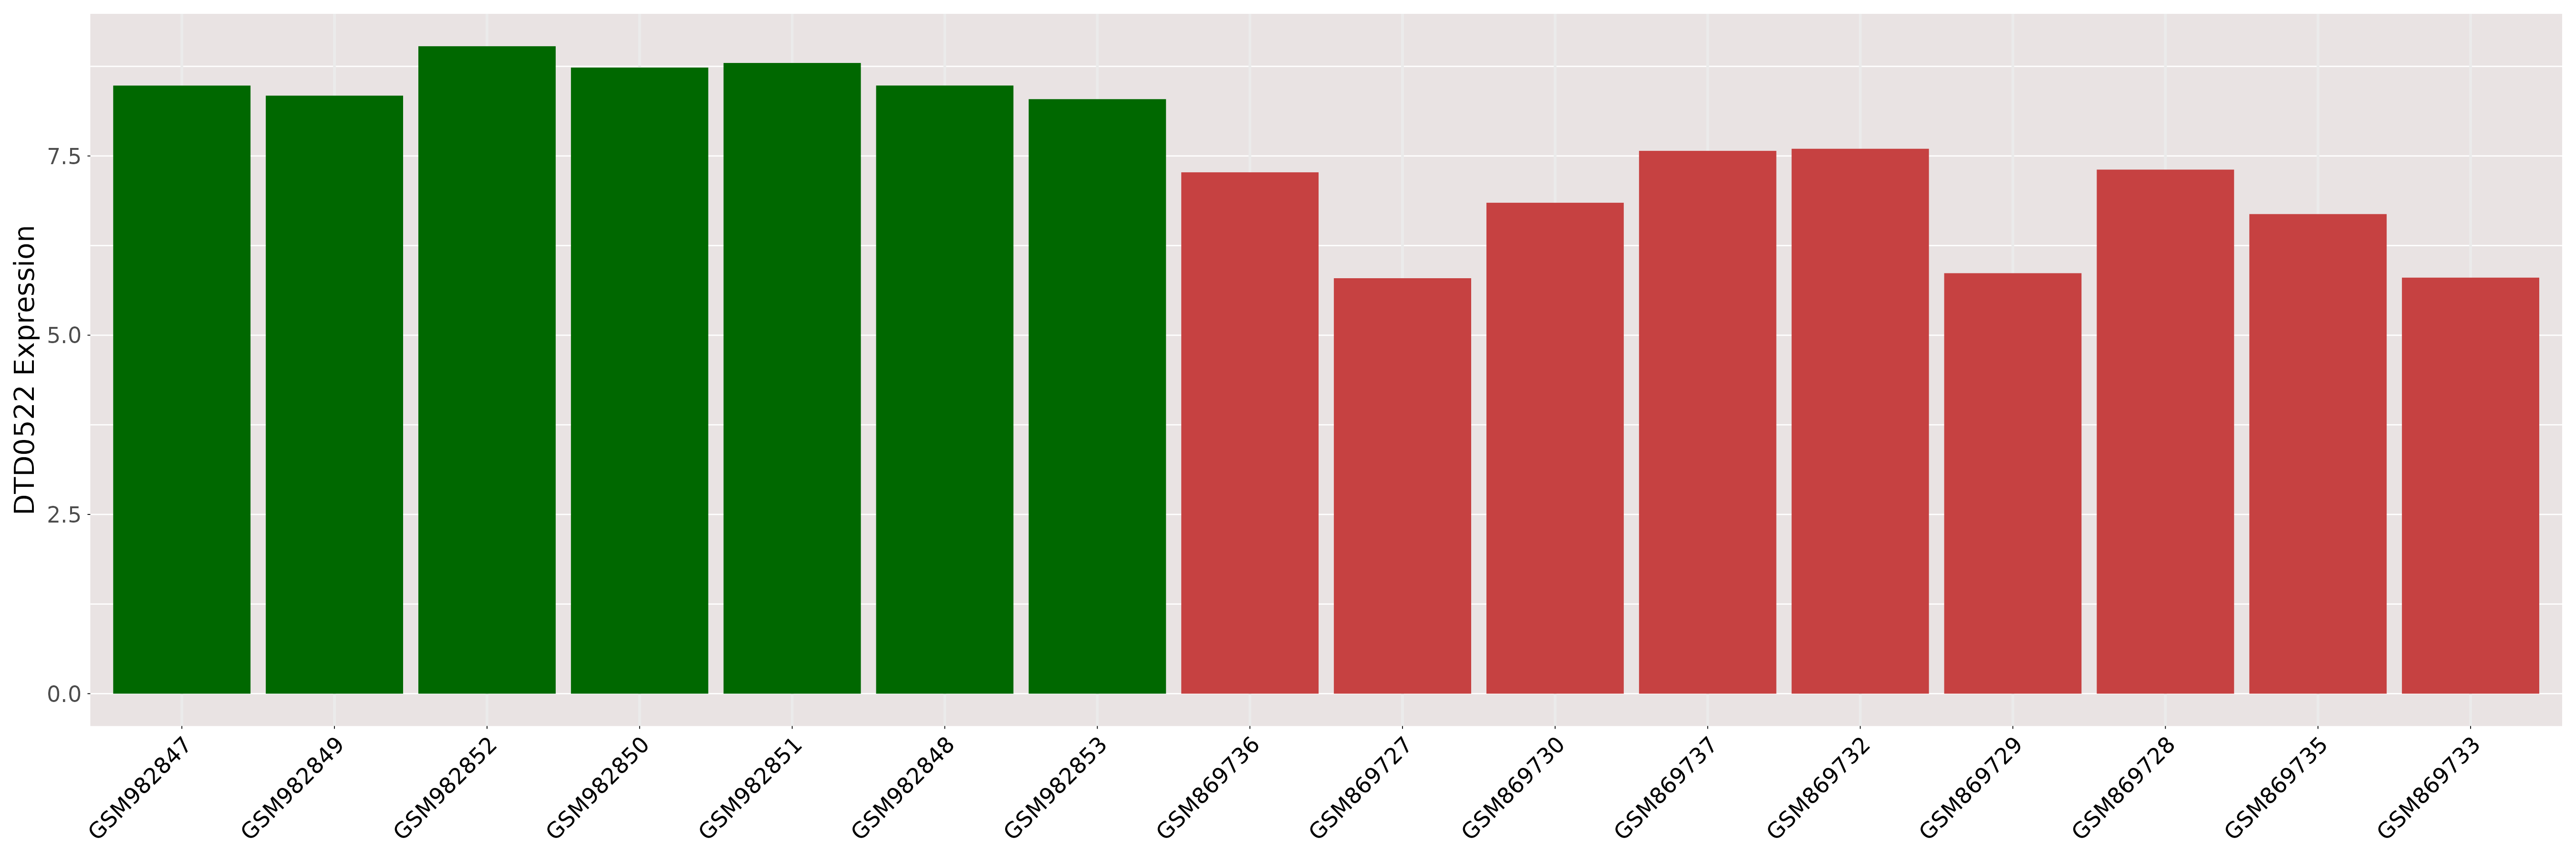
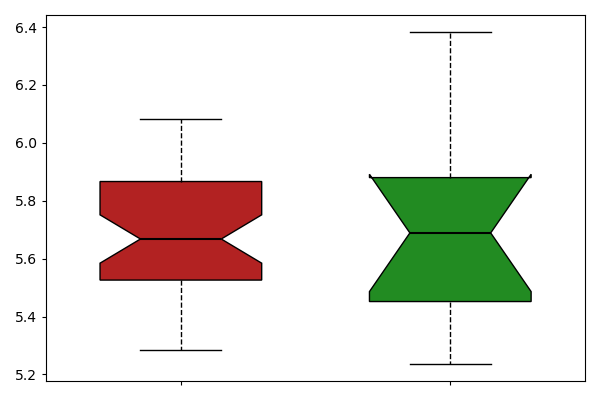
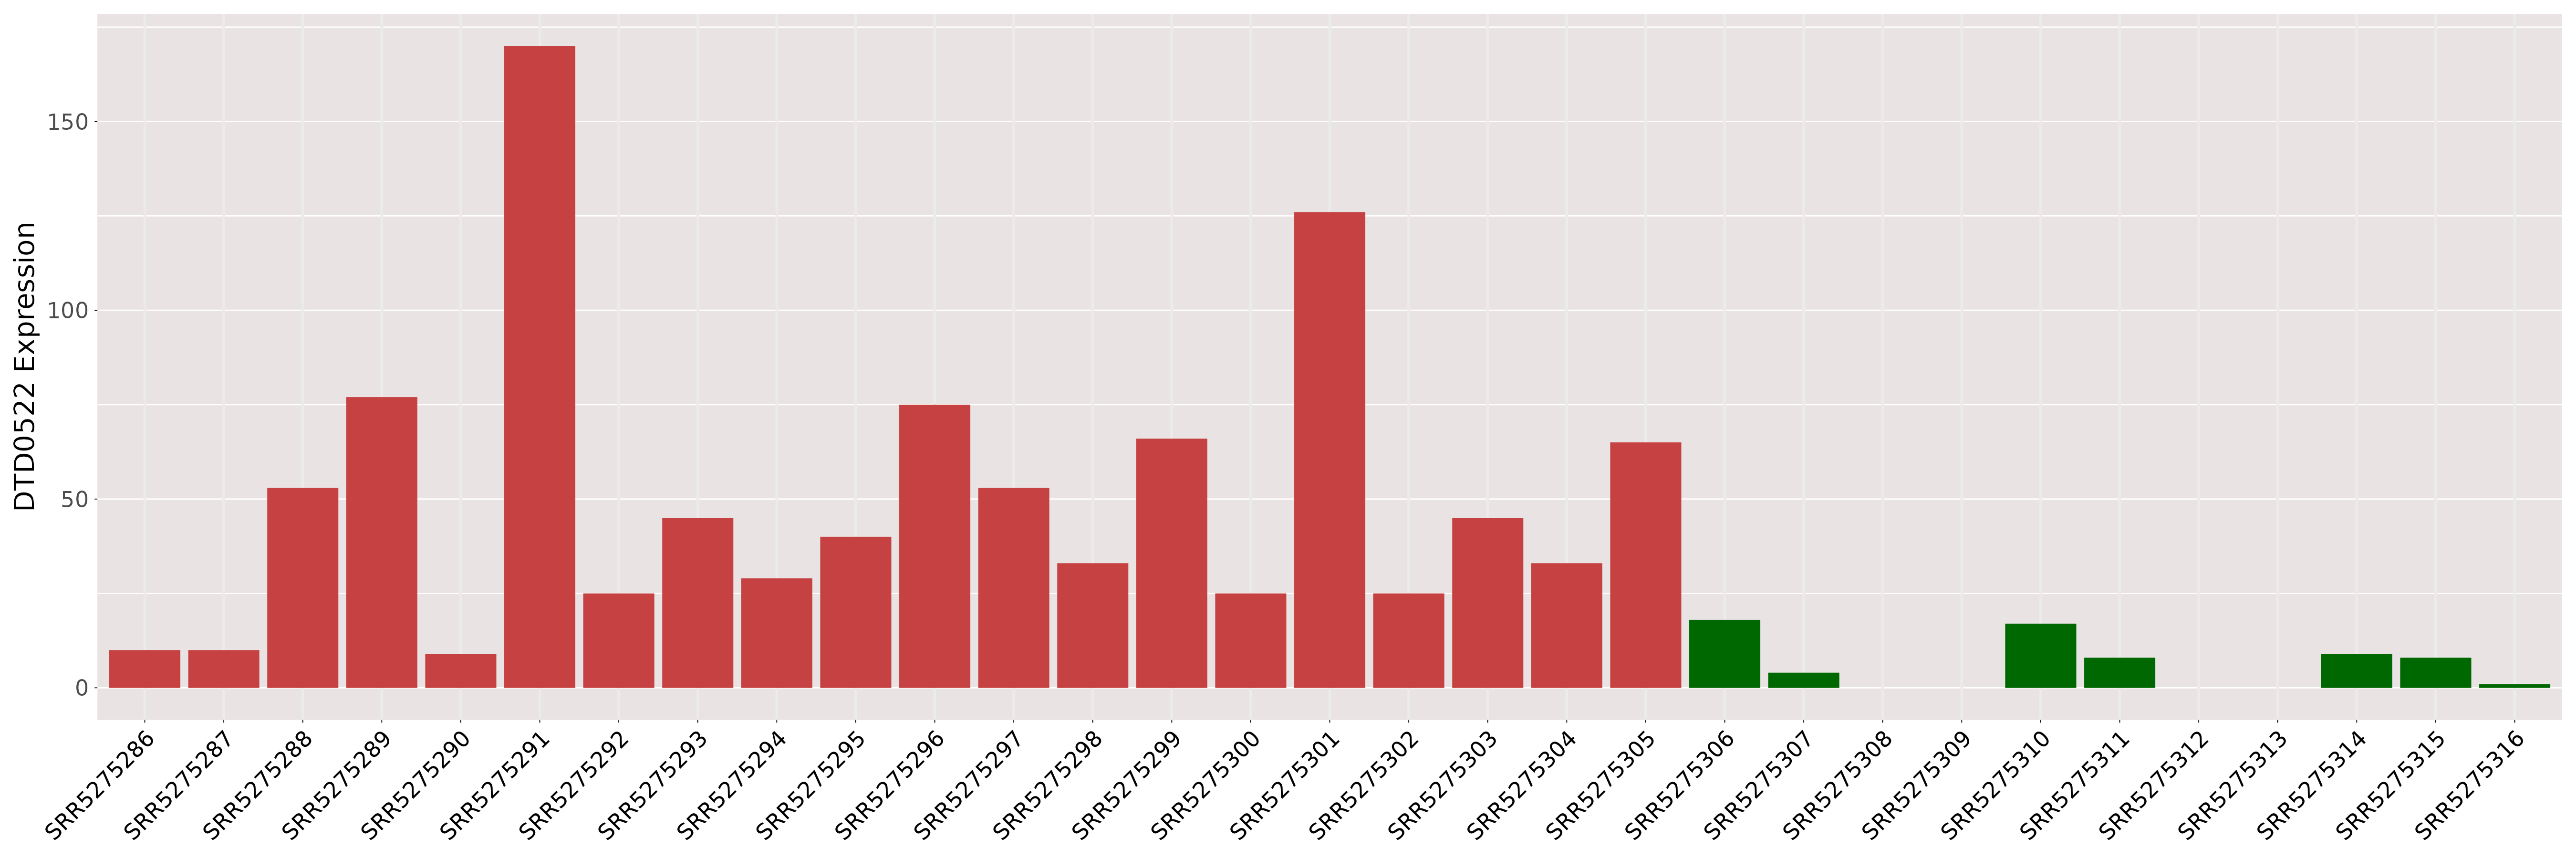
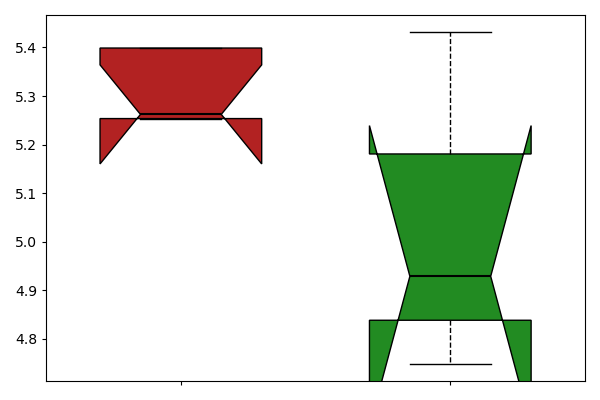
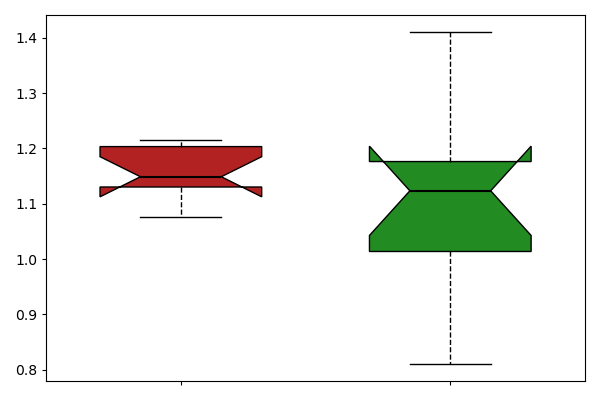
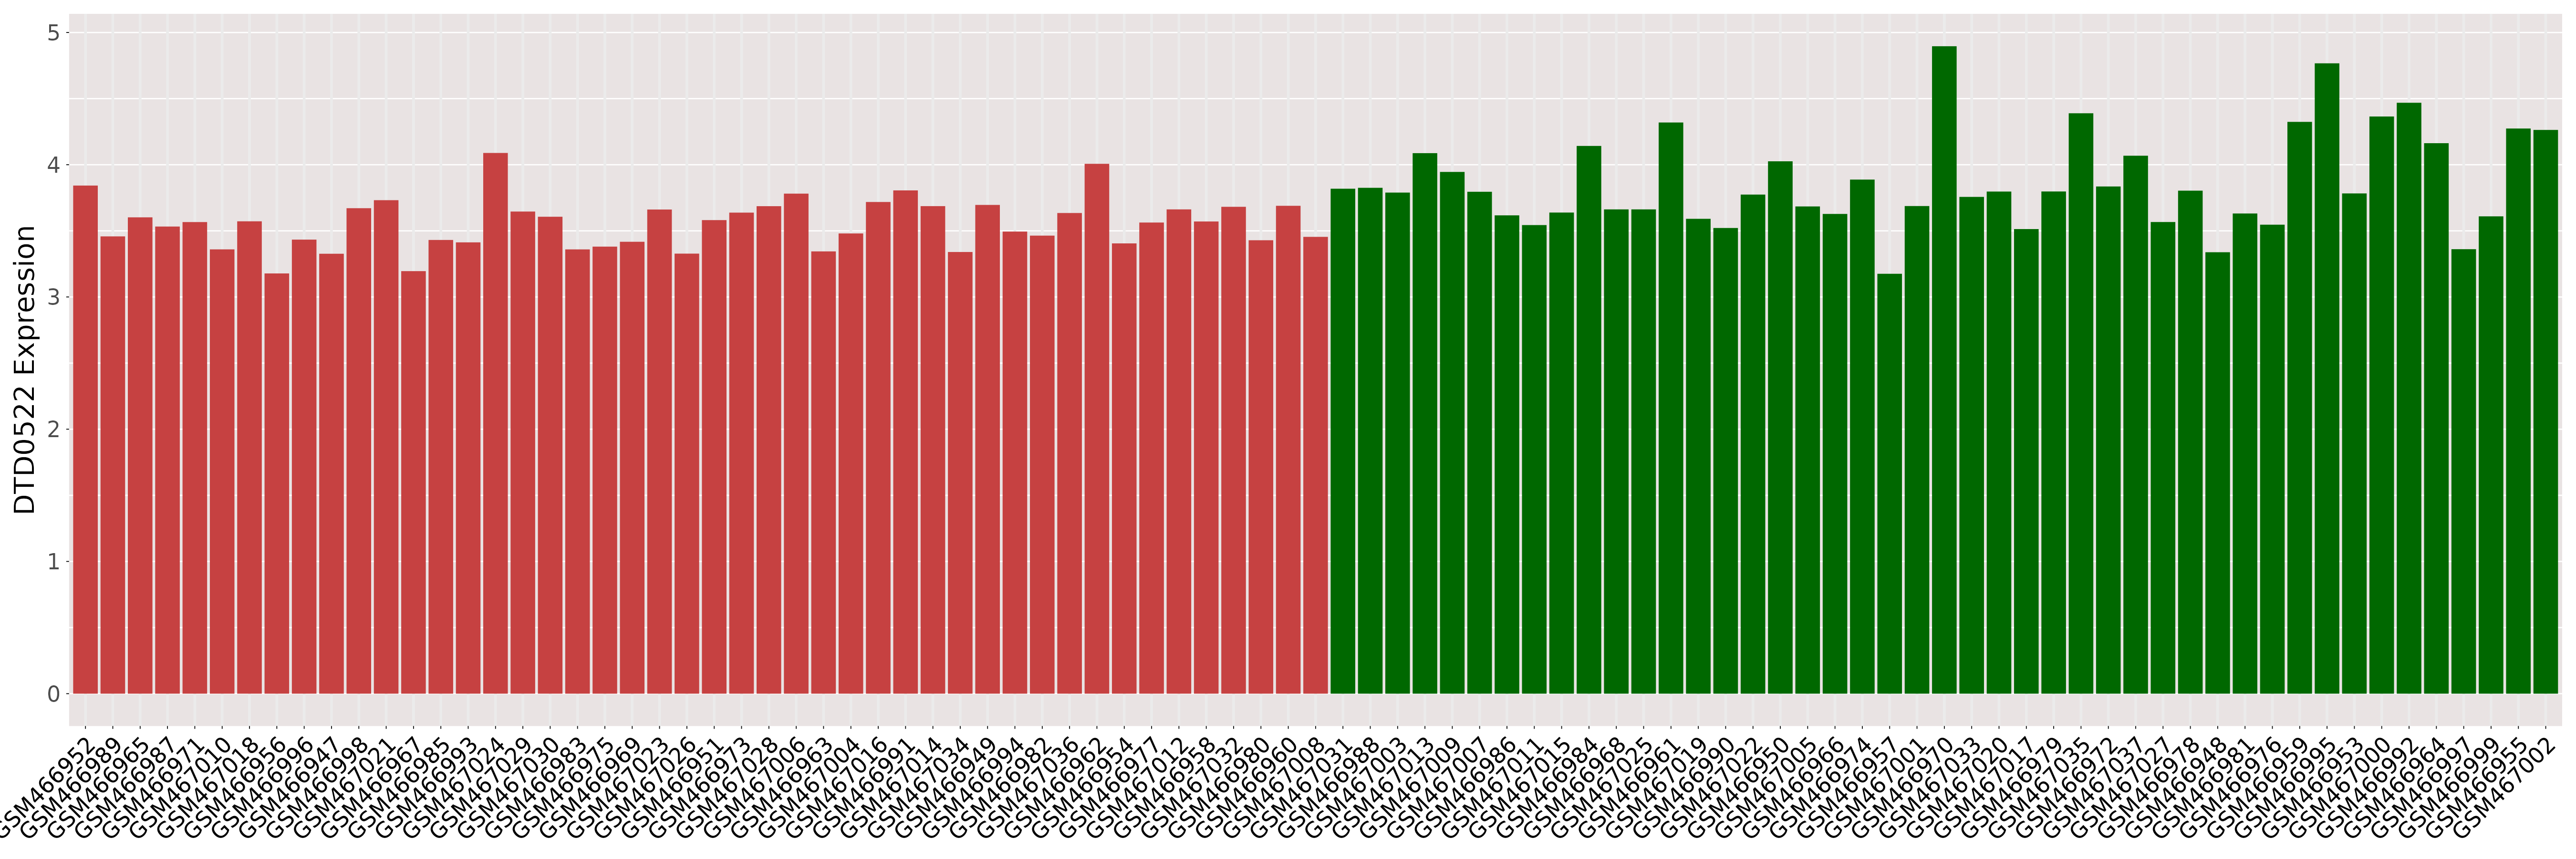
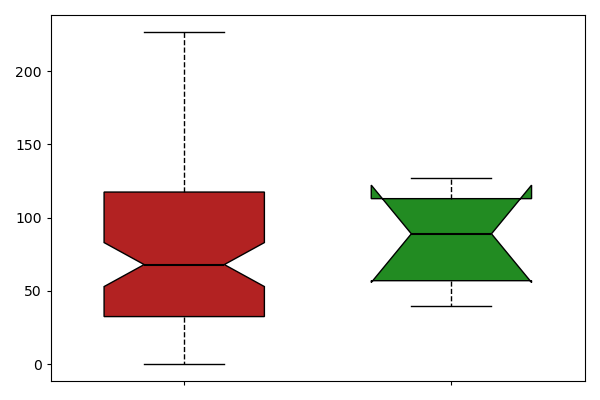
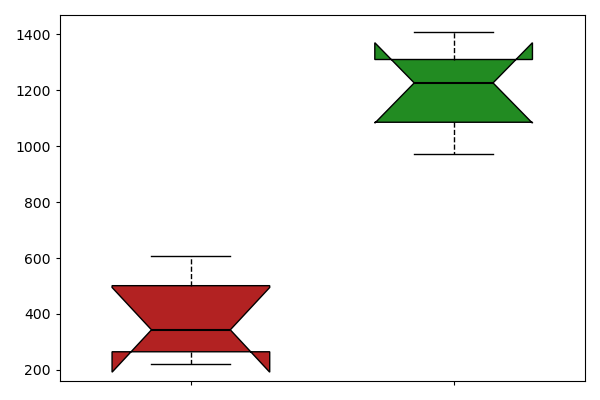
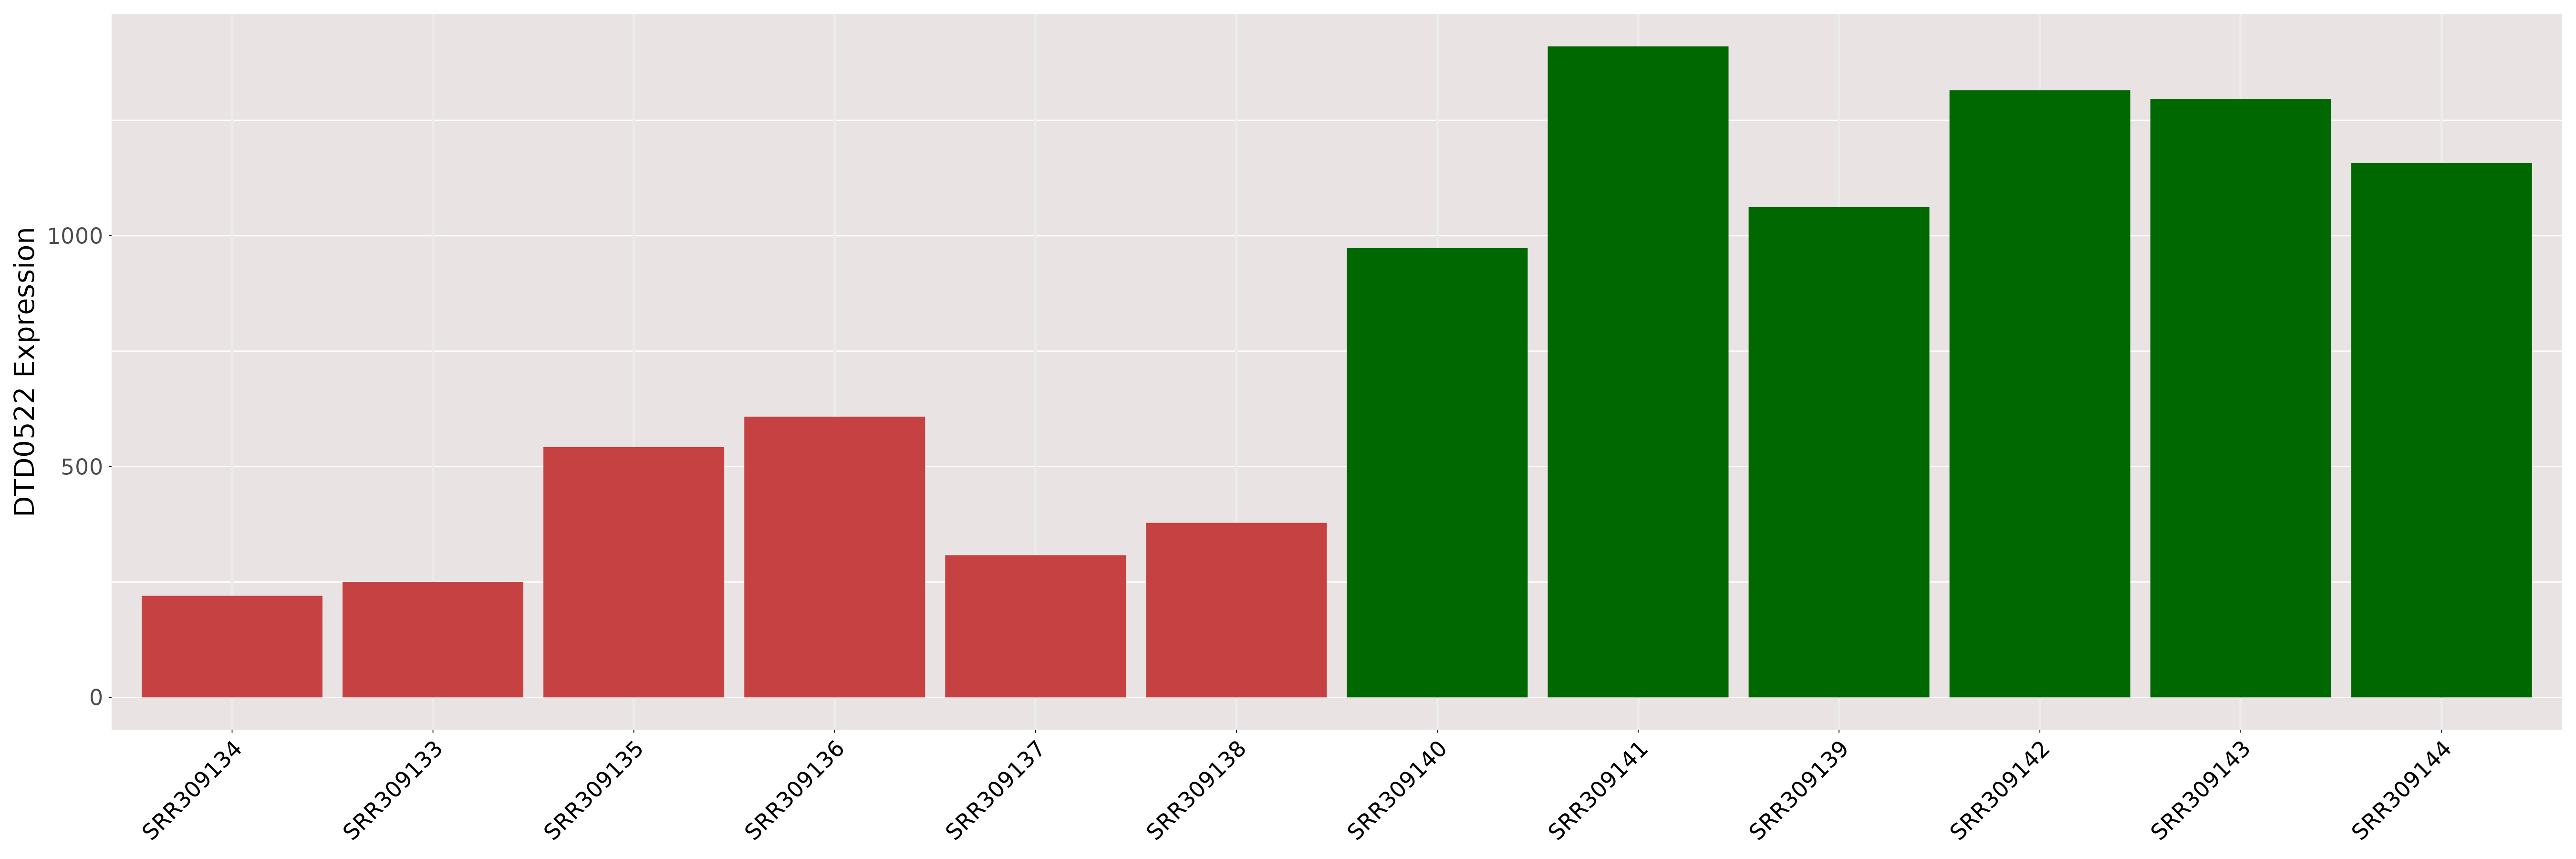
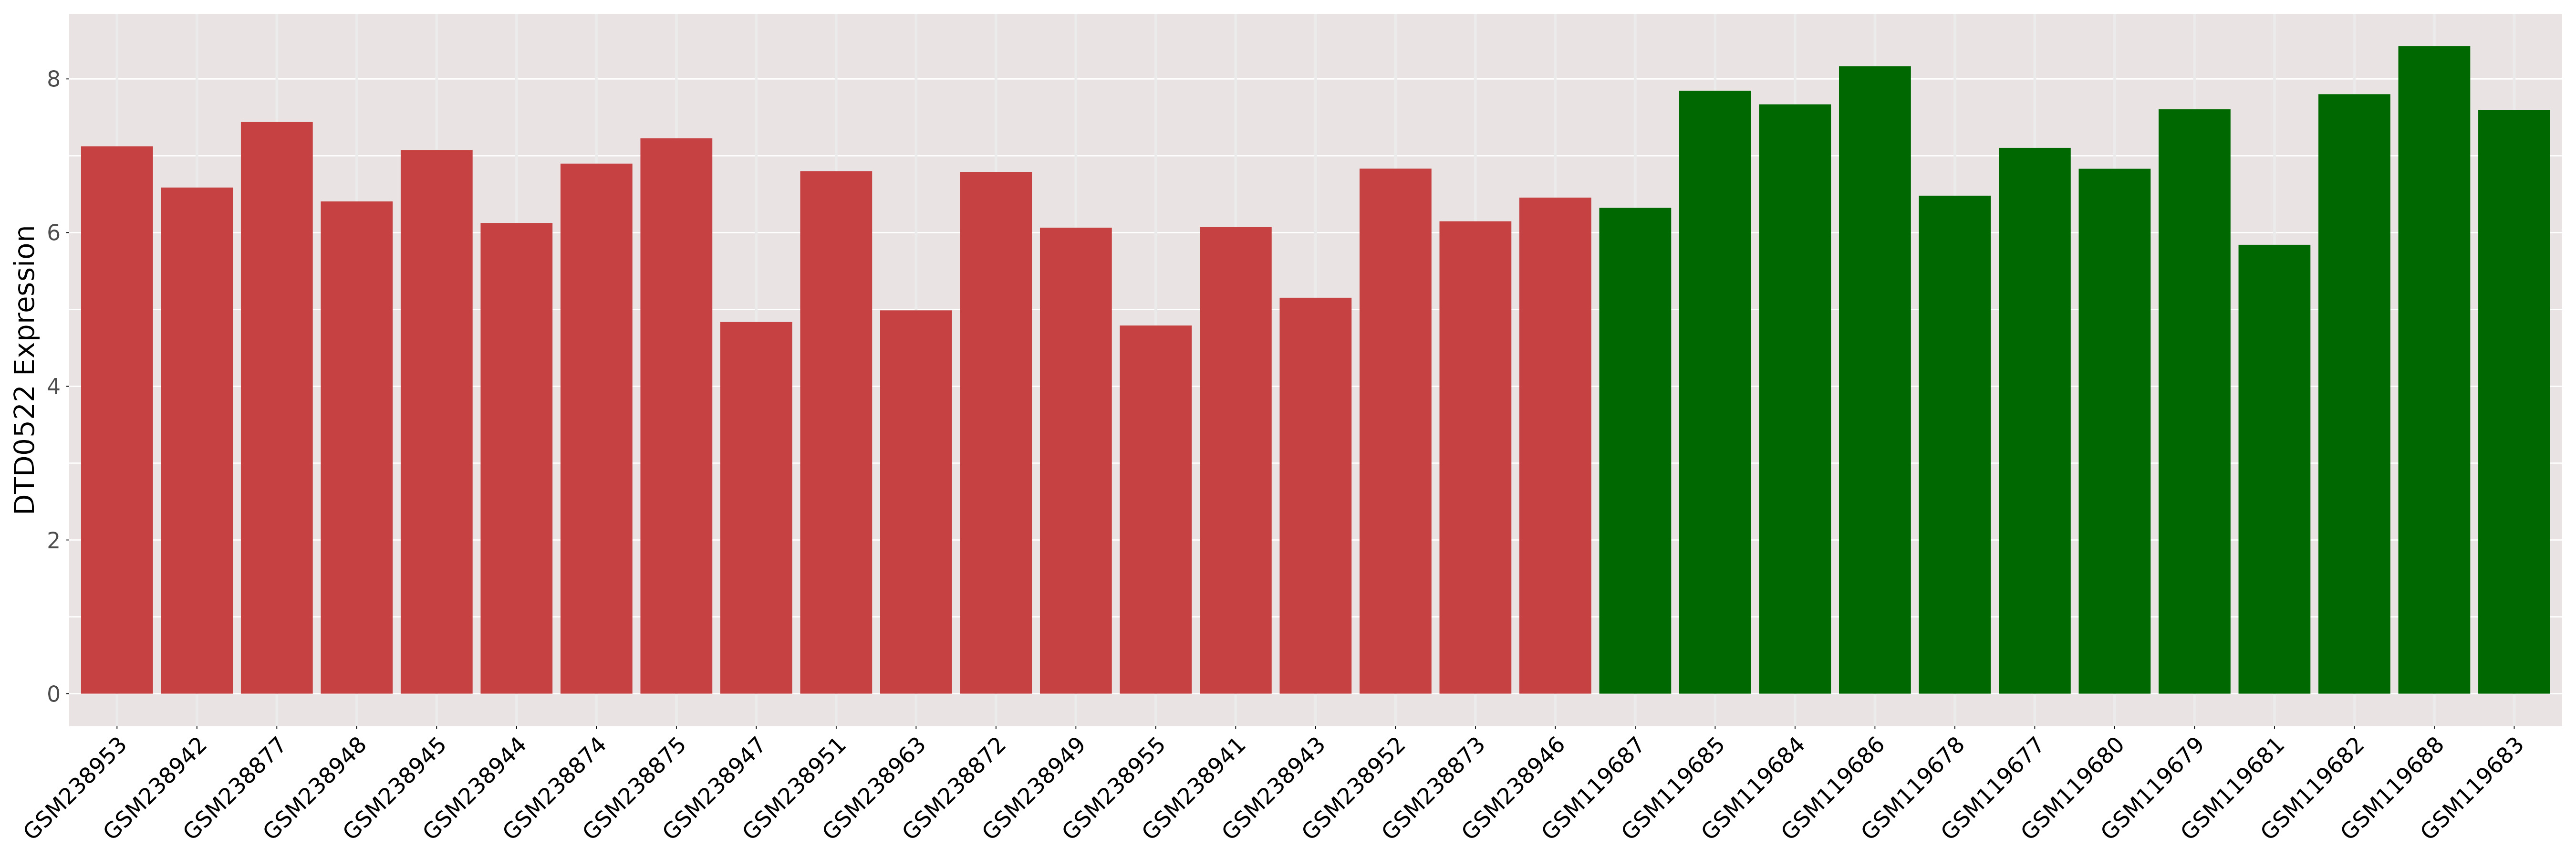
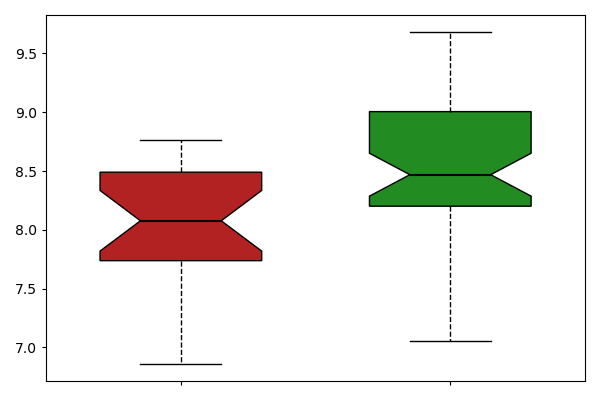
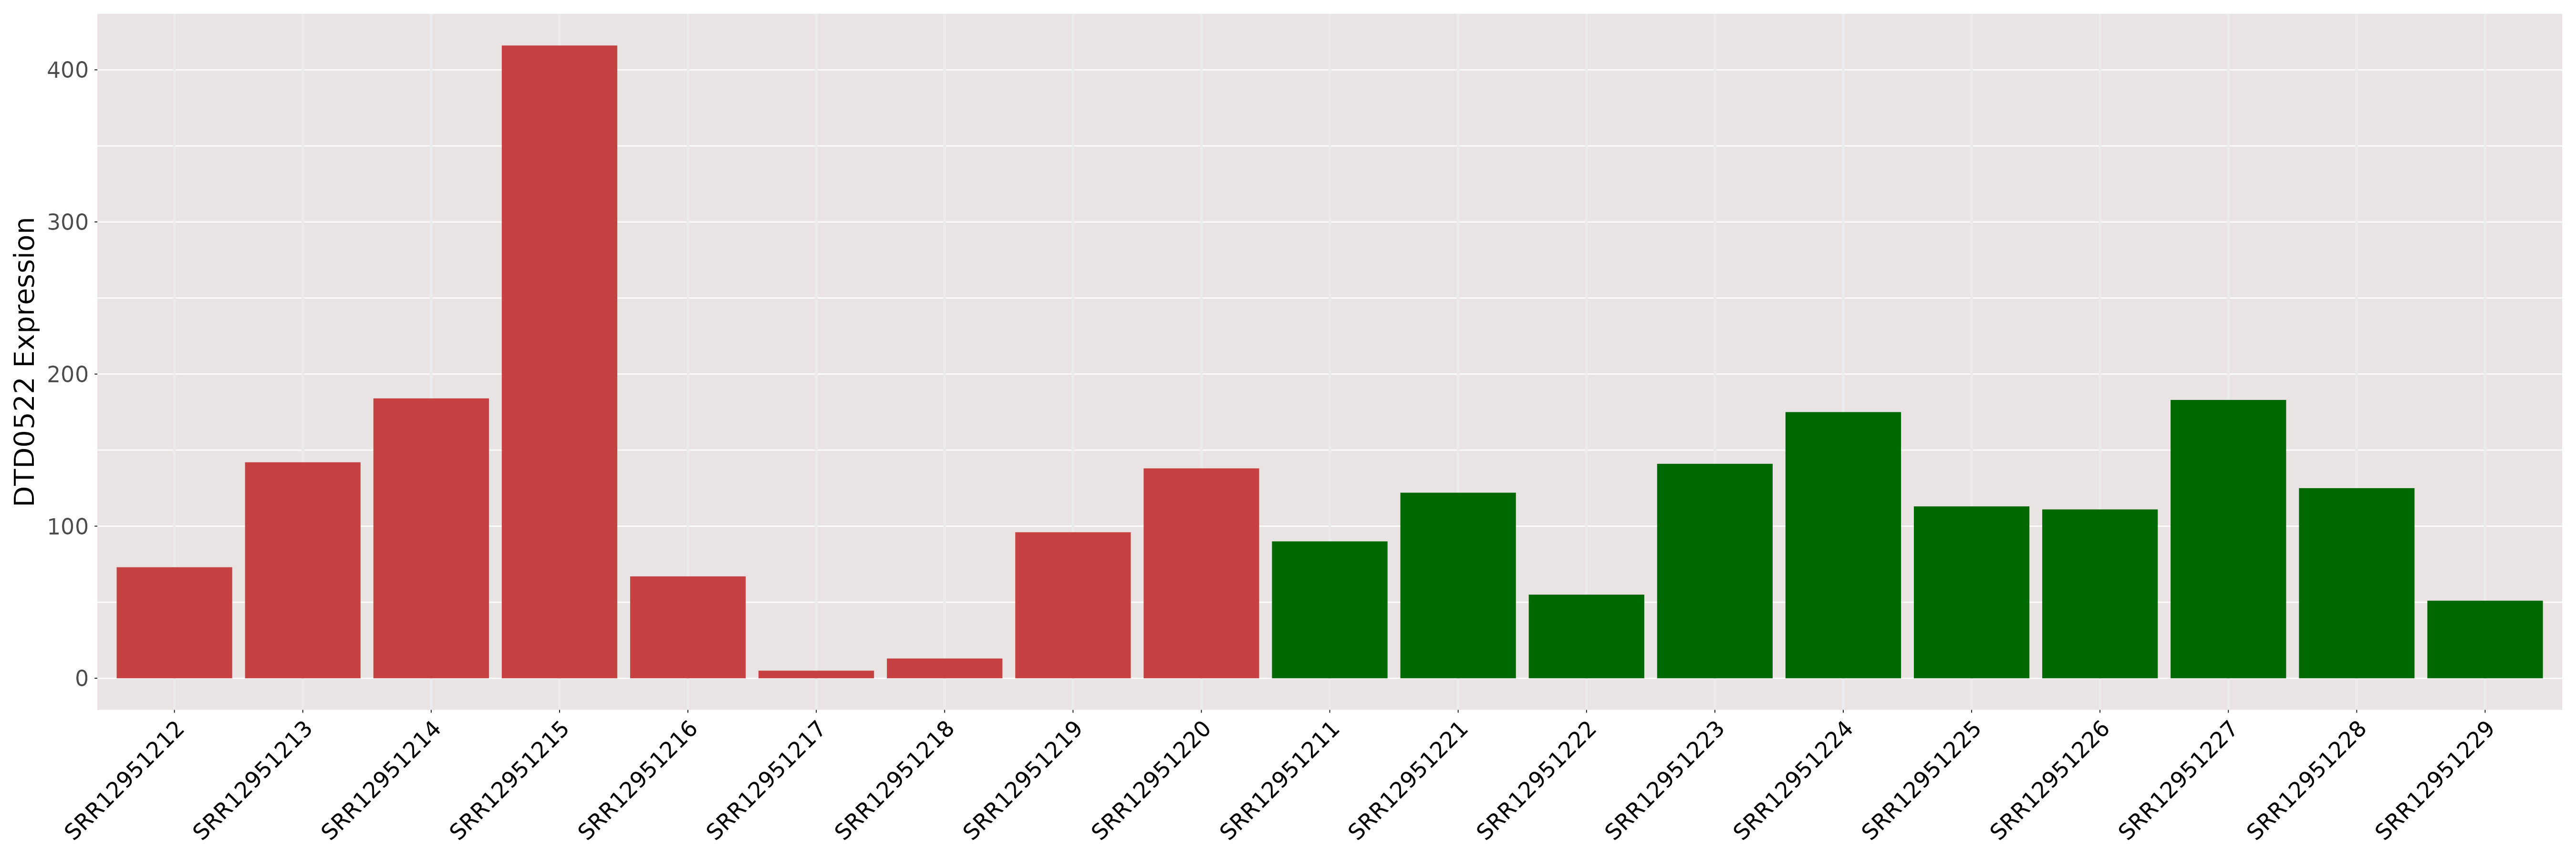
| [+] ICD-11: 1G50.0 Plasmodium falciparum malaria | Click to Show/Hide the Full List | ||||
| The Studied Tissue | Blood | ||||
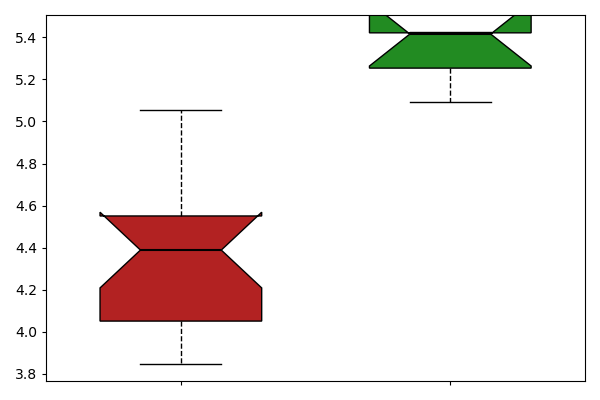
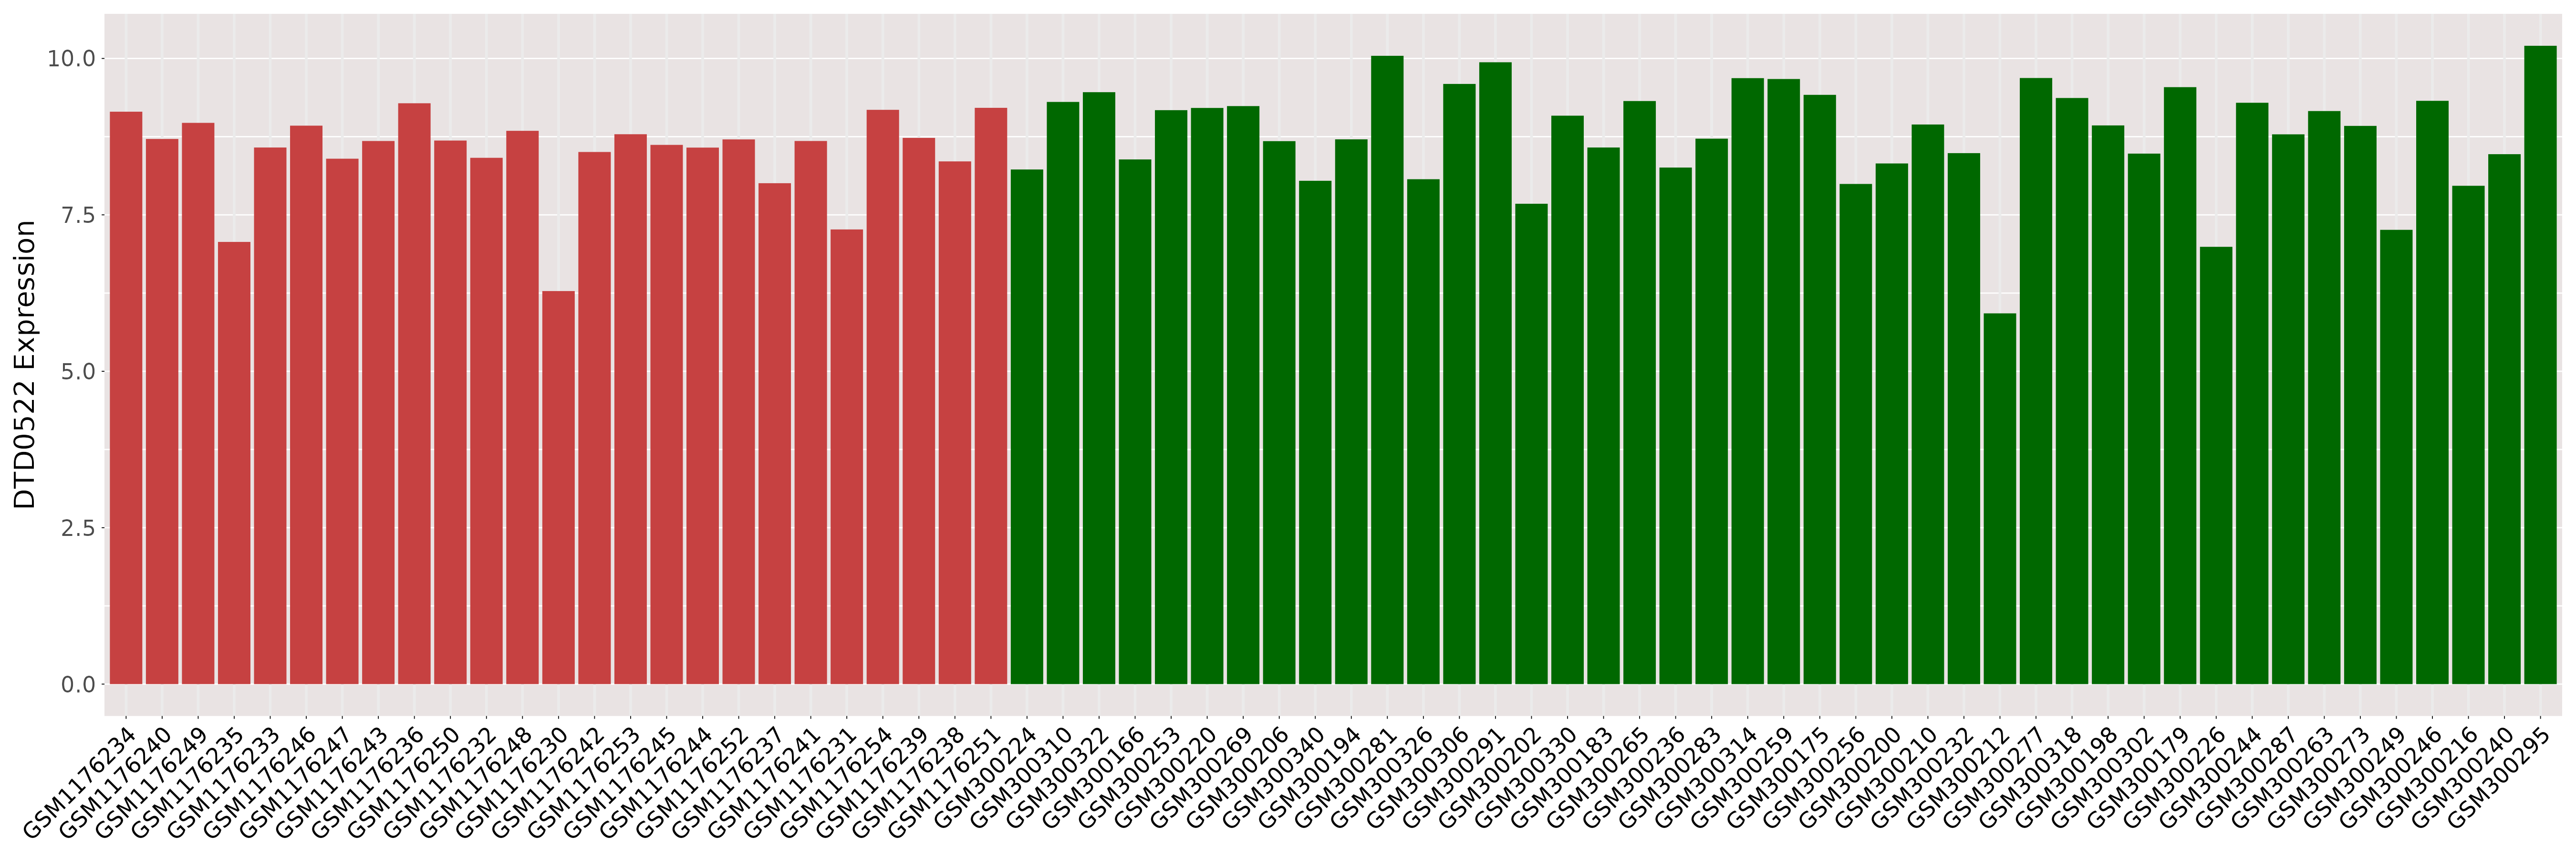
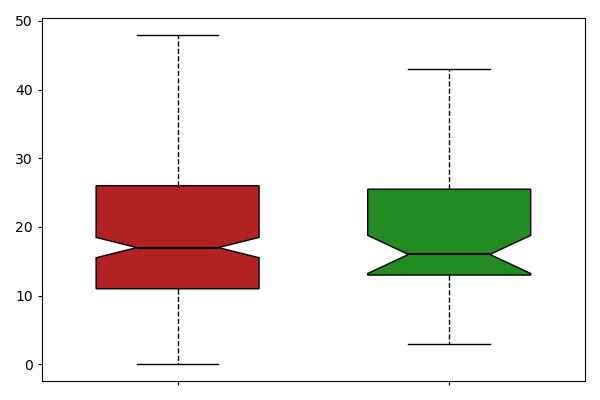
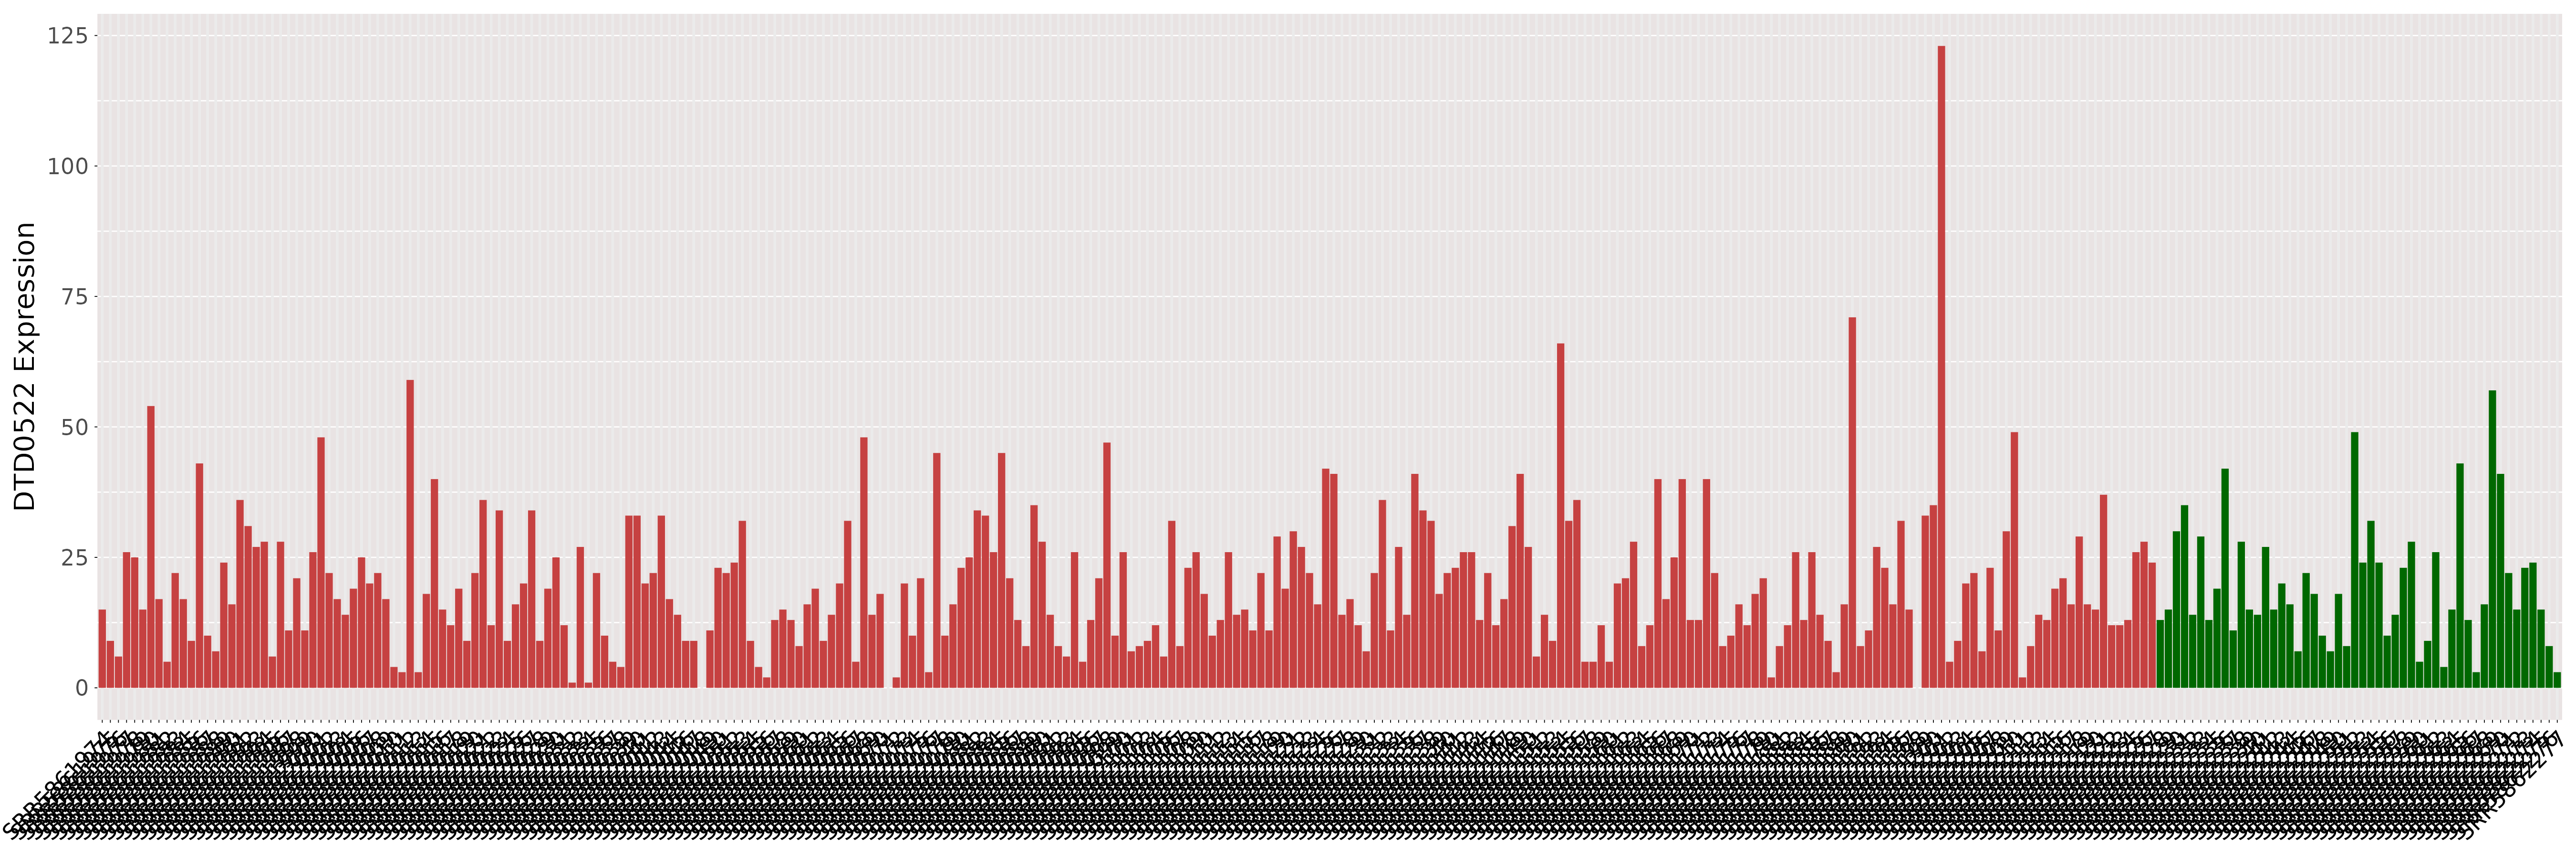
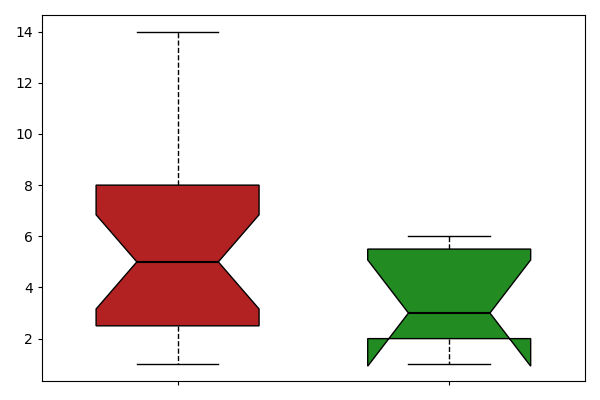
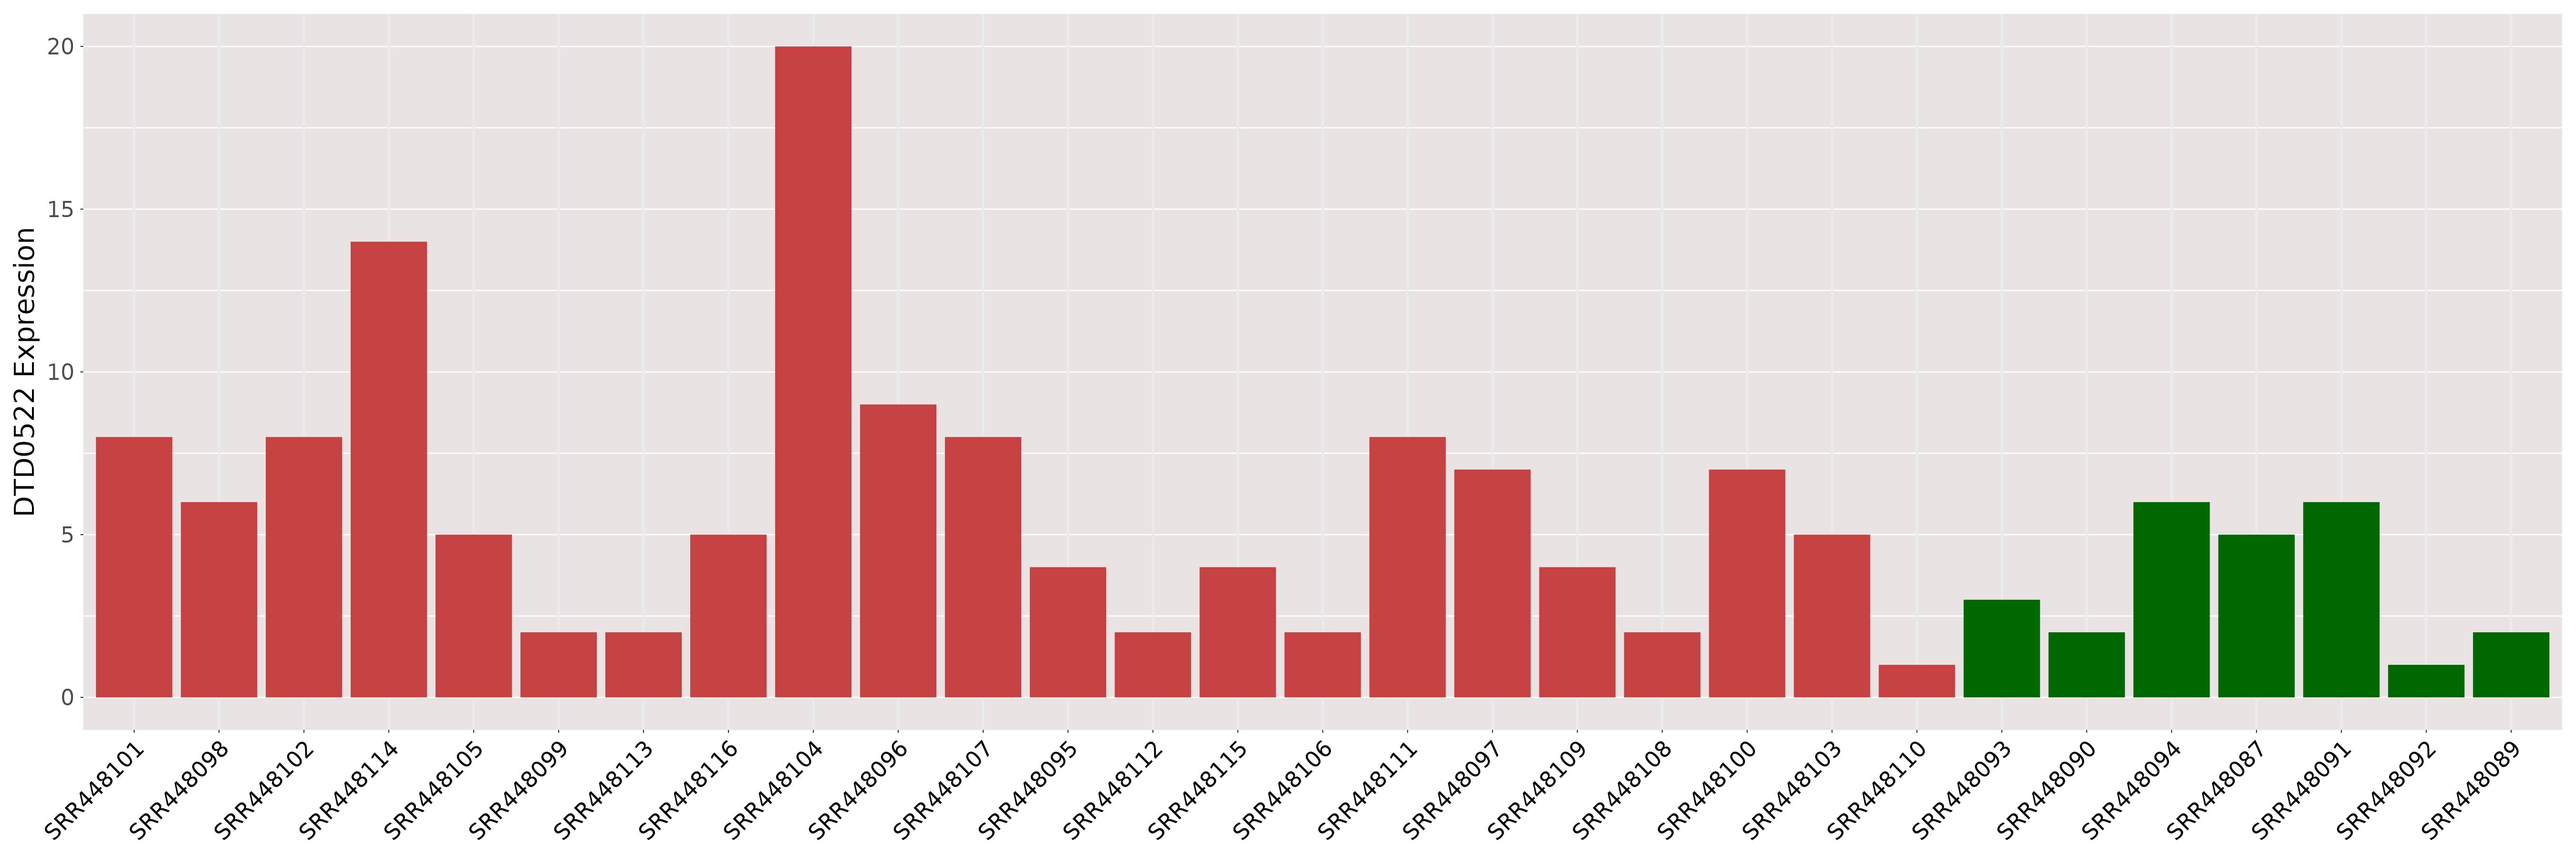
| The Specified Disease | Plasmodium falciparum malaria [ICD-11:1G50.0] | ||||
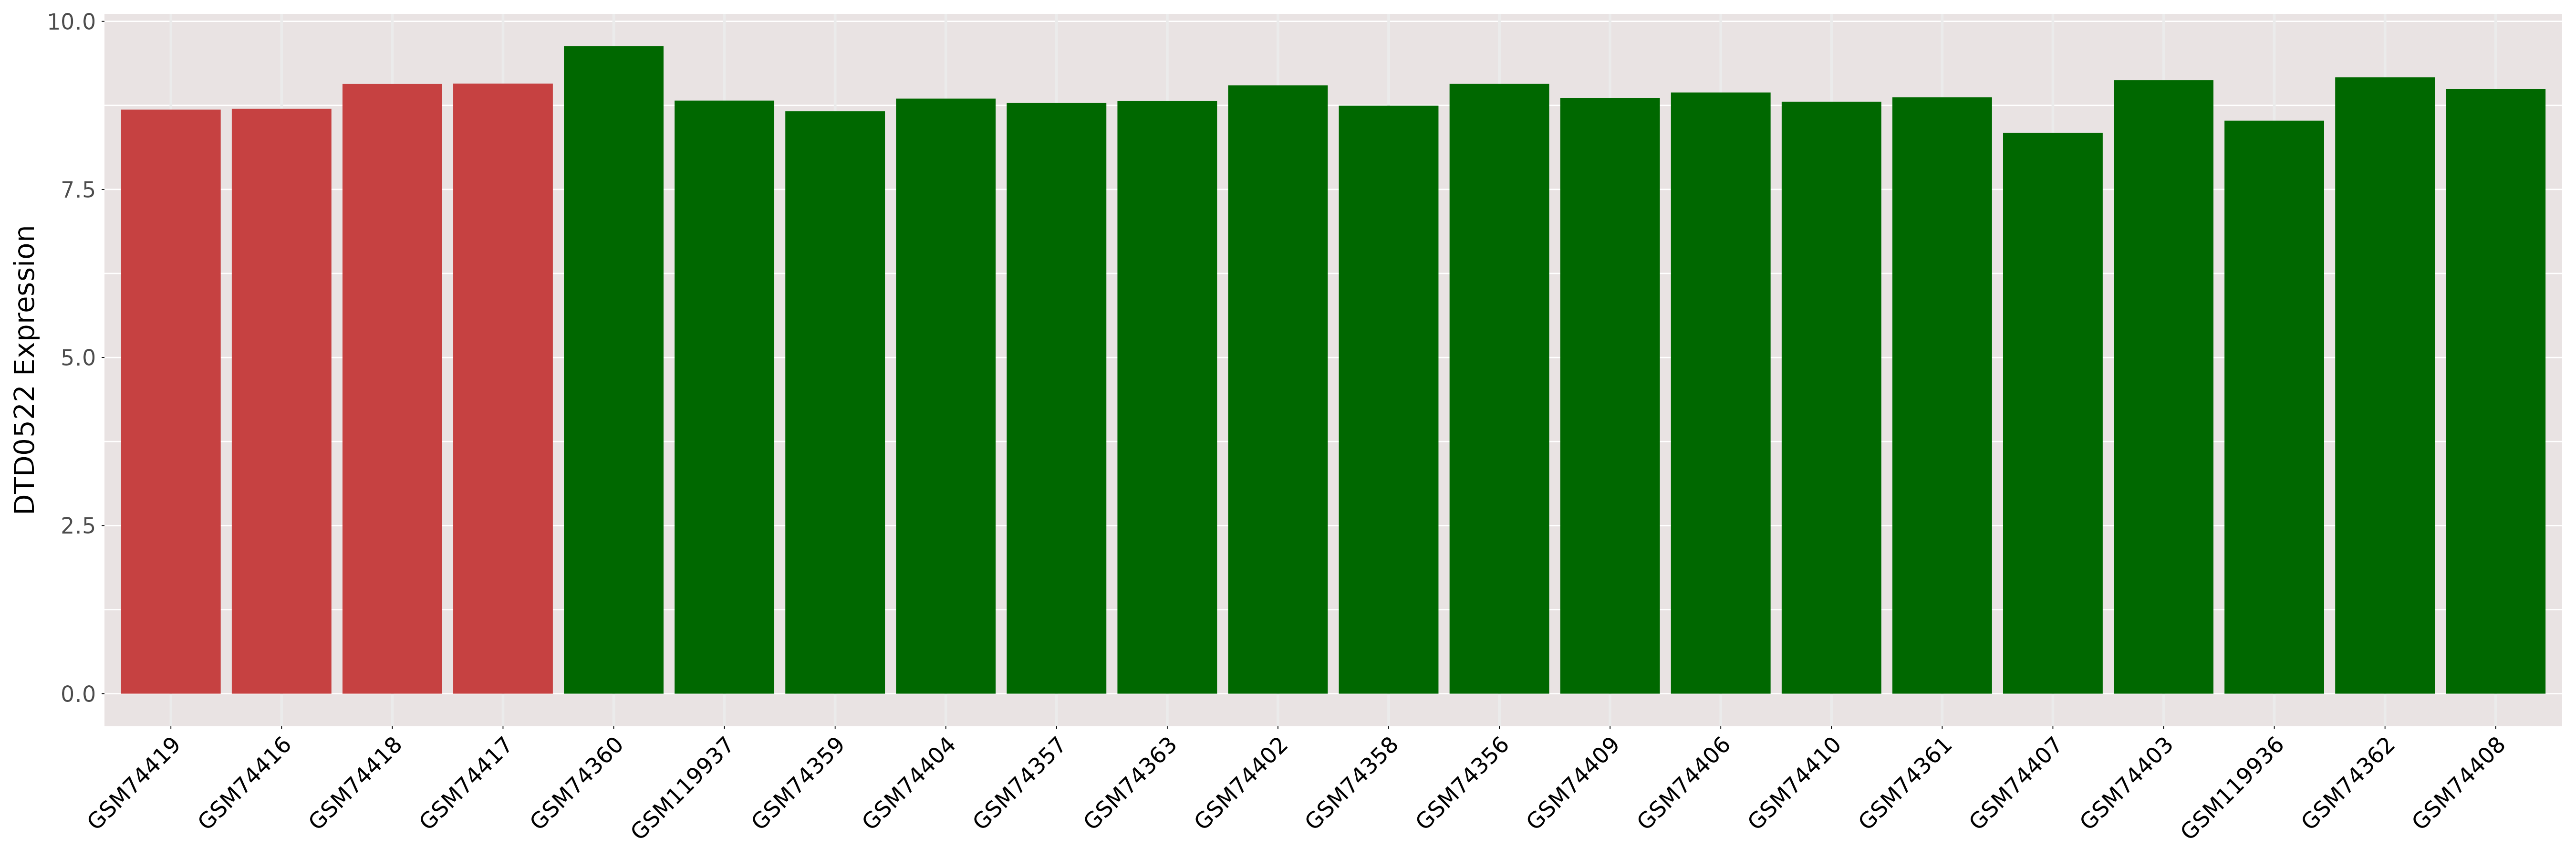
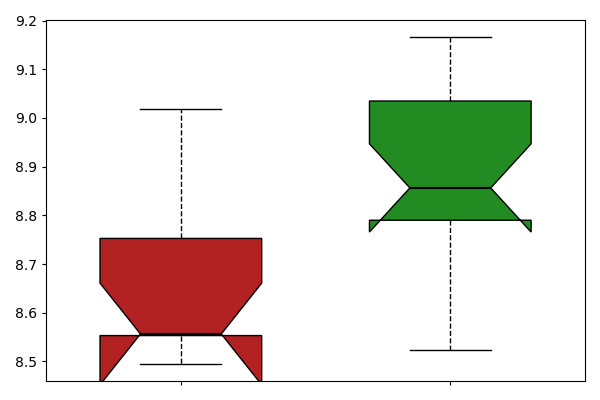
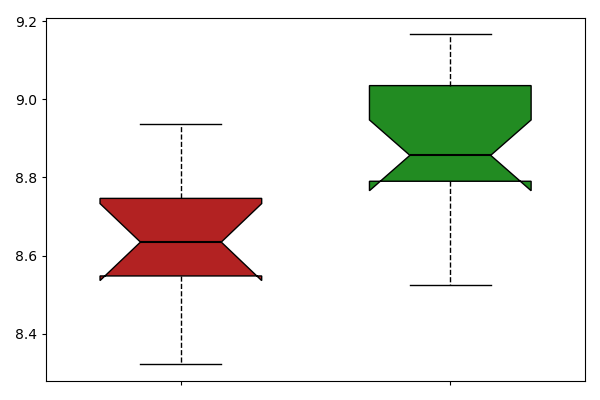
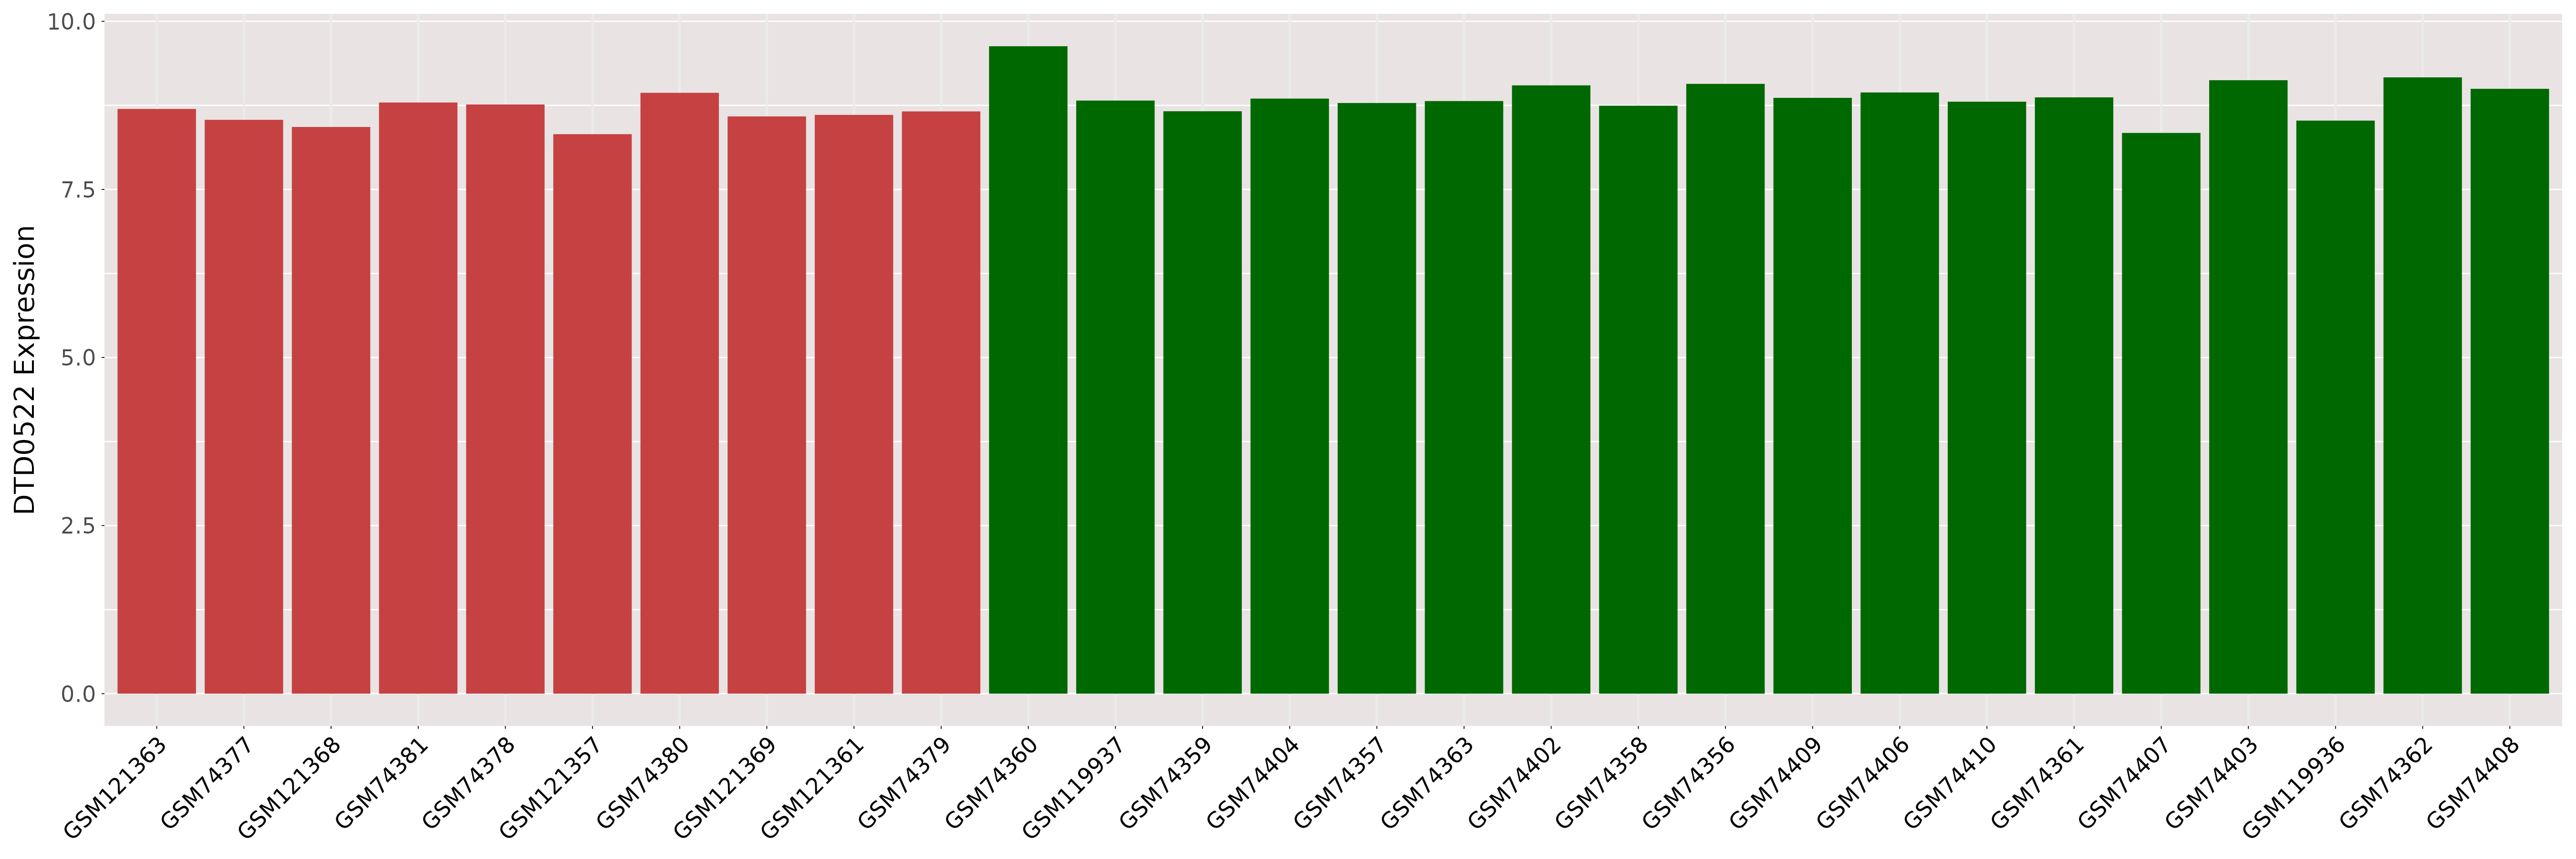
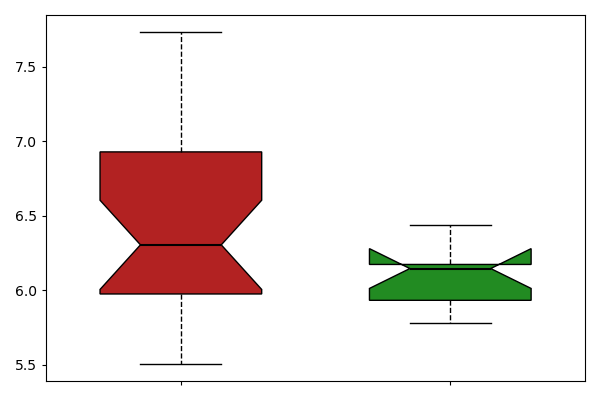
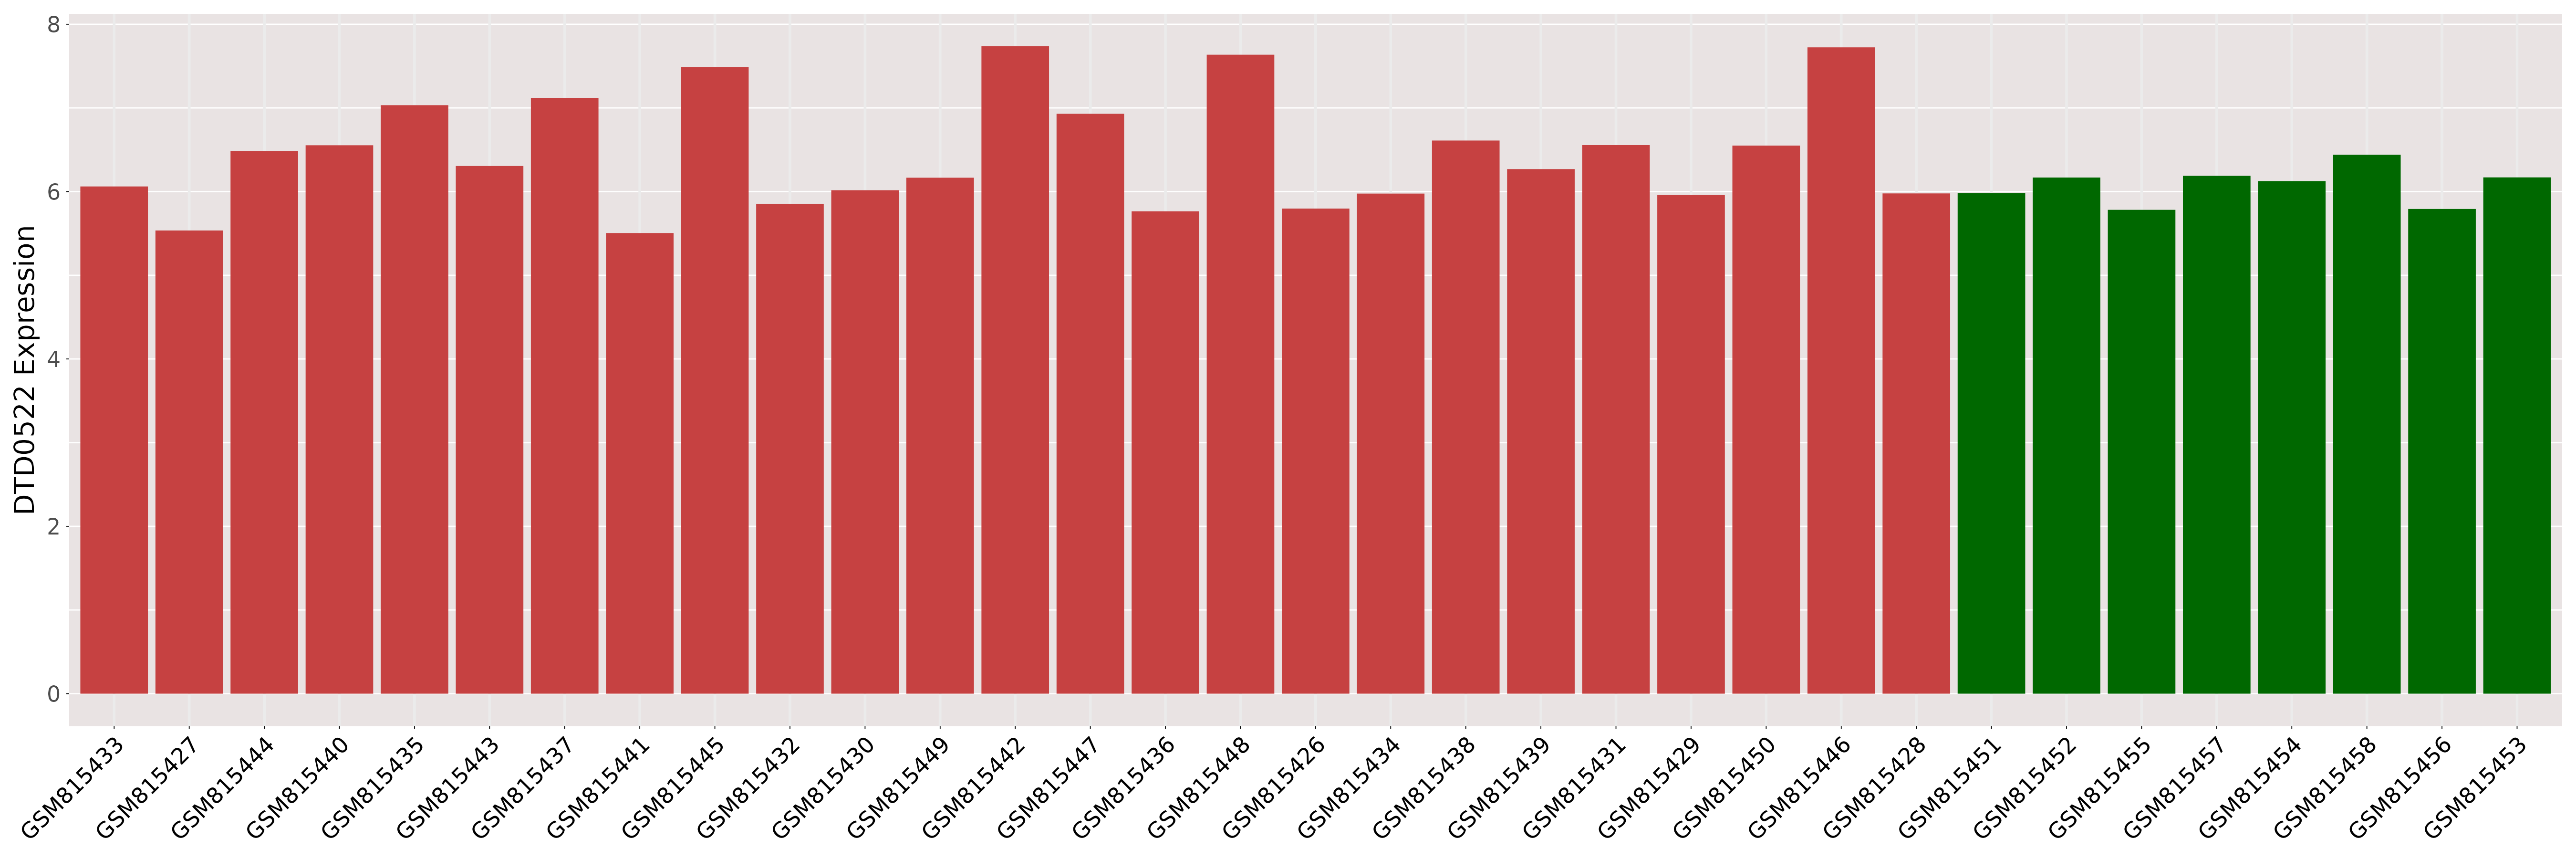
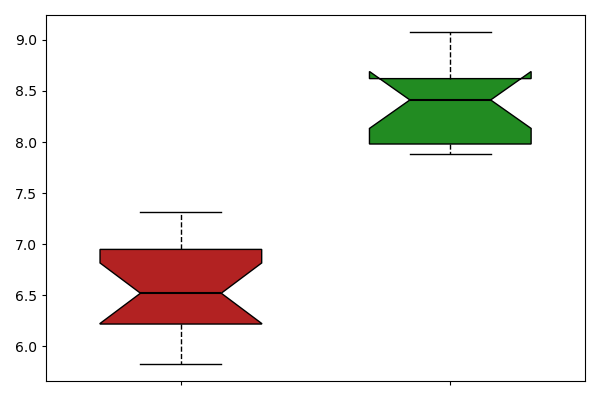
| The Expression Level of Disease Section Compare with the Healthy Individual Tissue | p-value:5.24842788739744e-06; Fold-change:0.9323728257371362; Z-score:-0.948056433 | ||||
| DT expression in the diseased tissue of patients
DT expression in the normal tissue of healthy individuals
|
|||||
|
 Please Click the above Thumbnail to View/Download
the Expression Barchart for All Samples Please Click the above Thumbnail to View/Download
the Expression Barchart for All Samples
|
||||
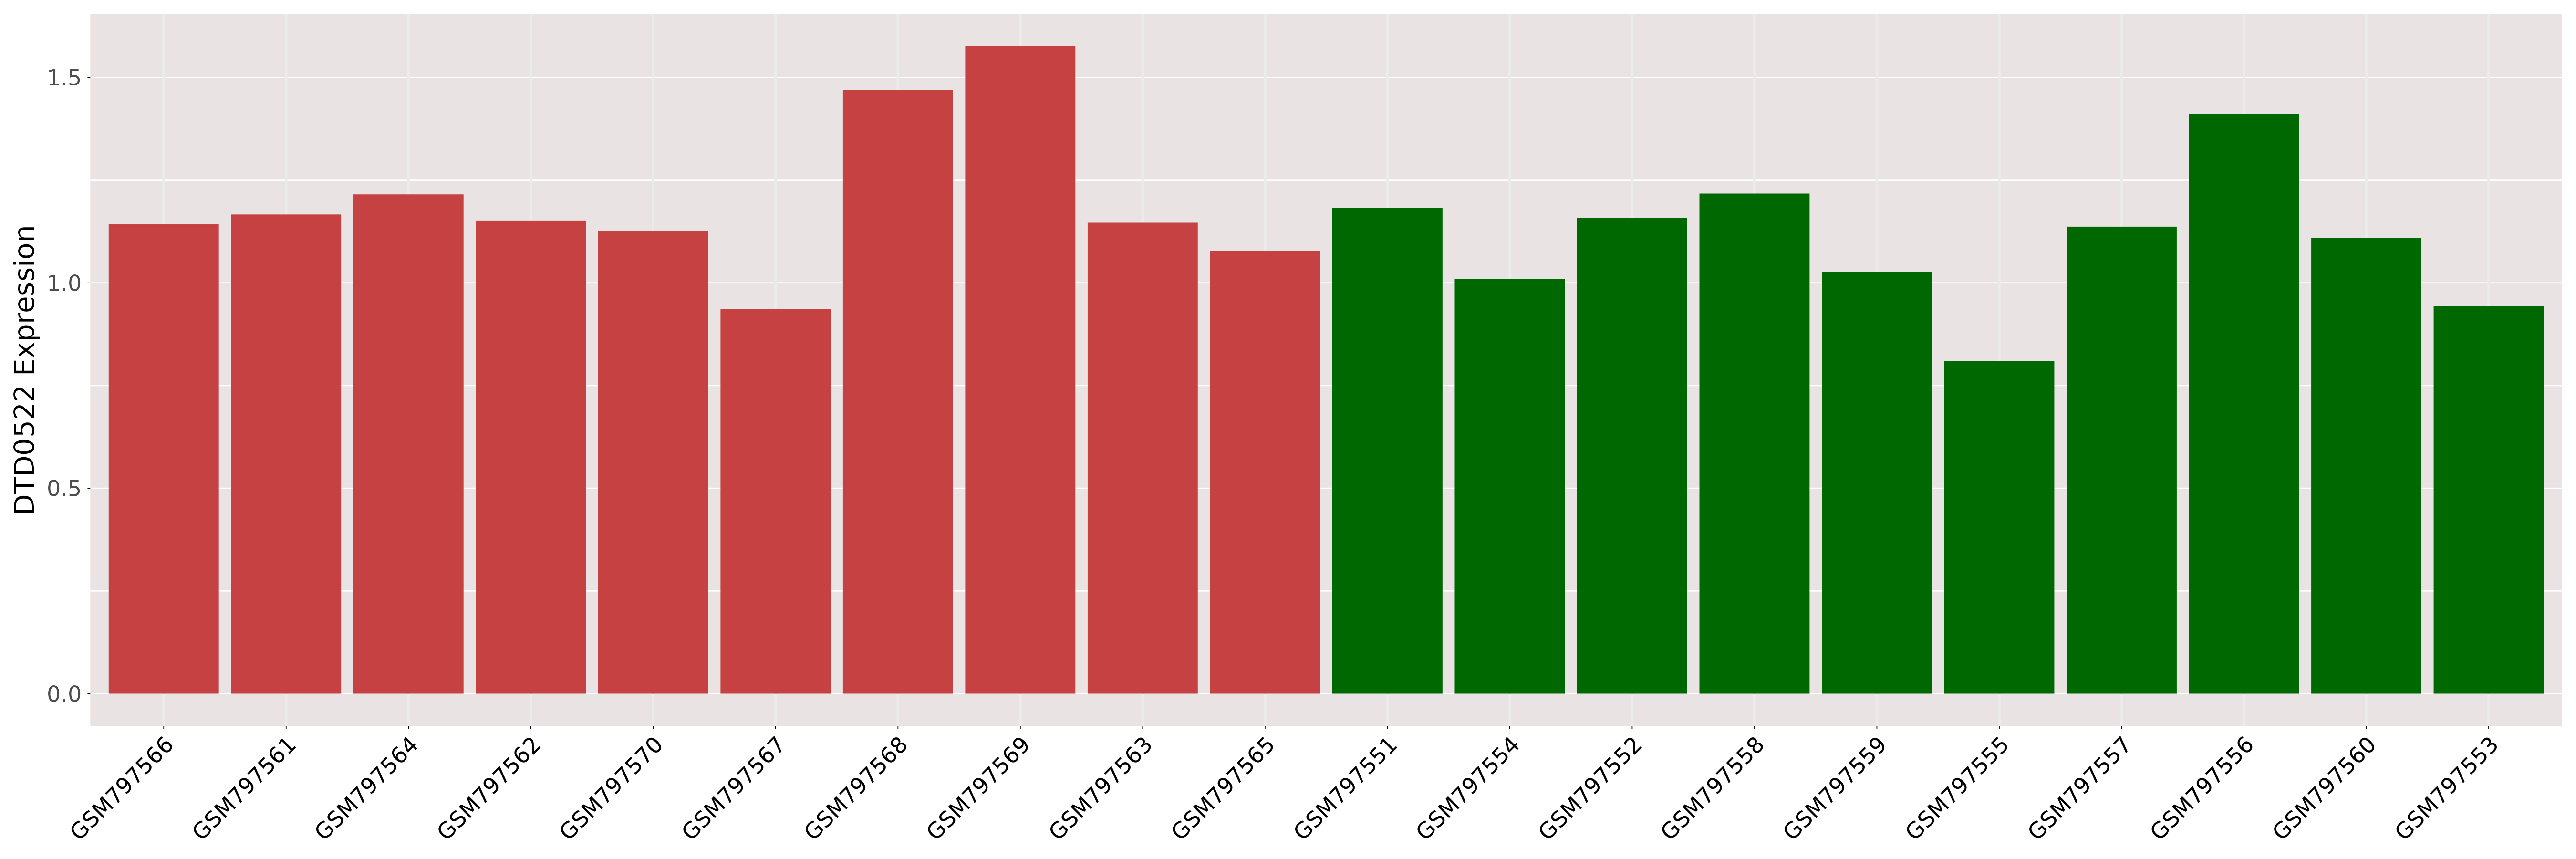
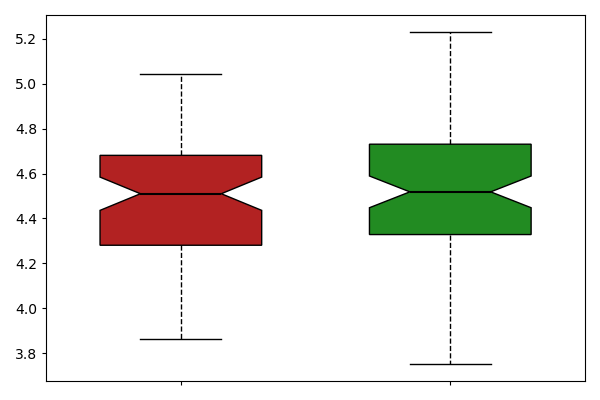
| ICD-11: 02 Neoplasm | |||||
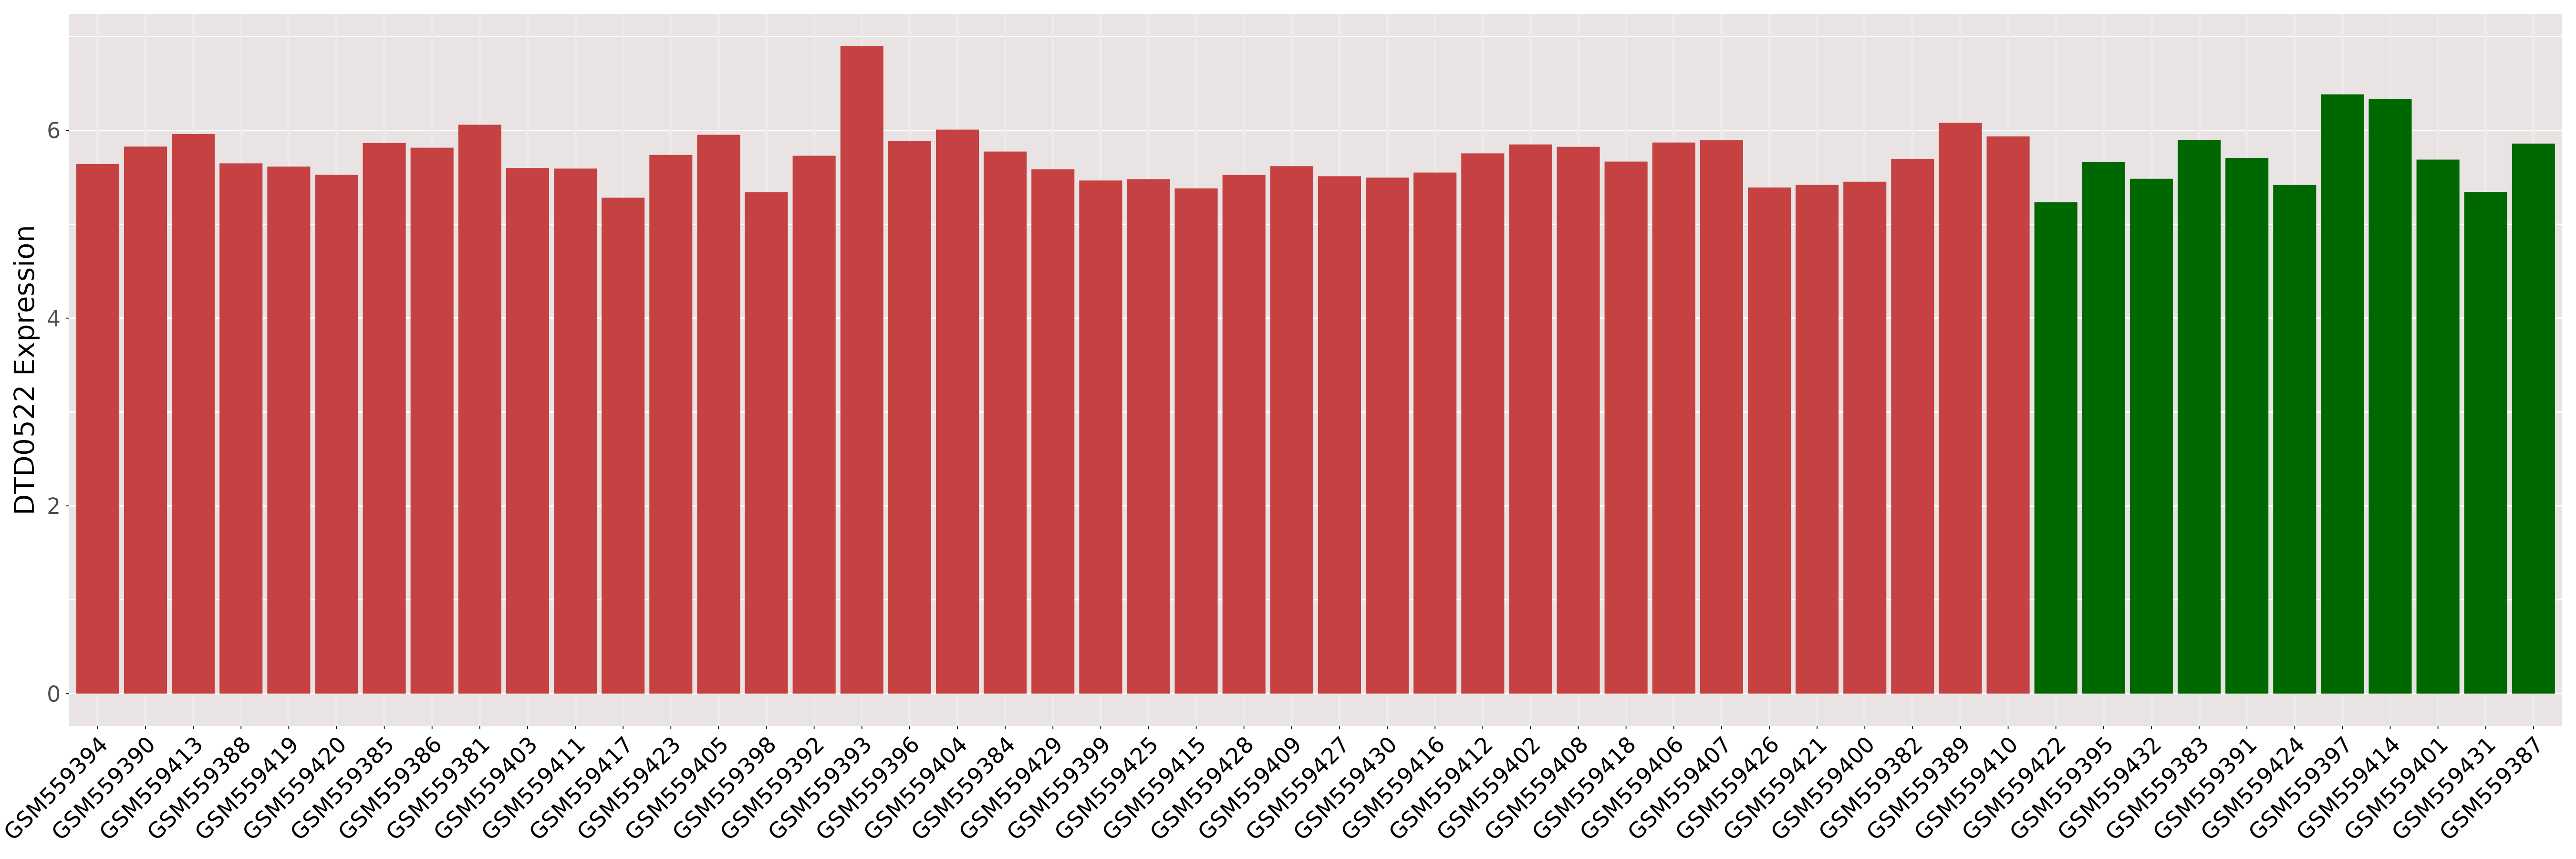
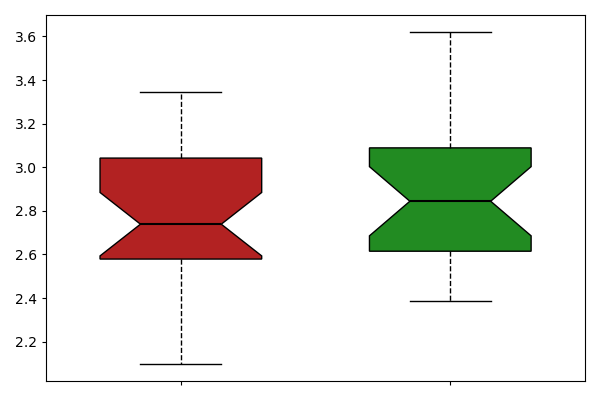
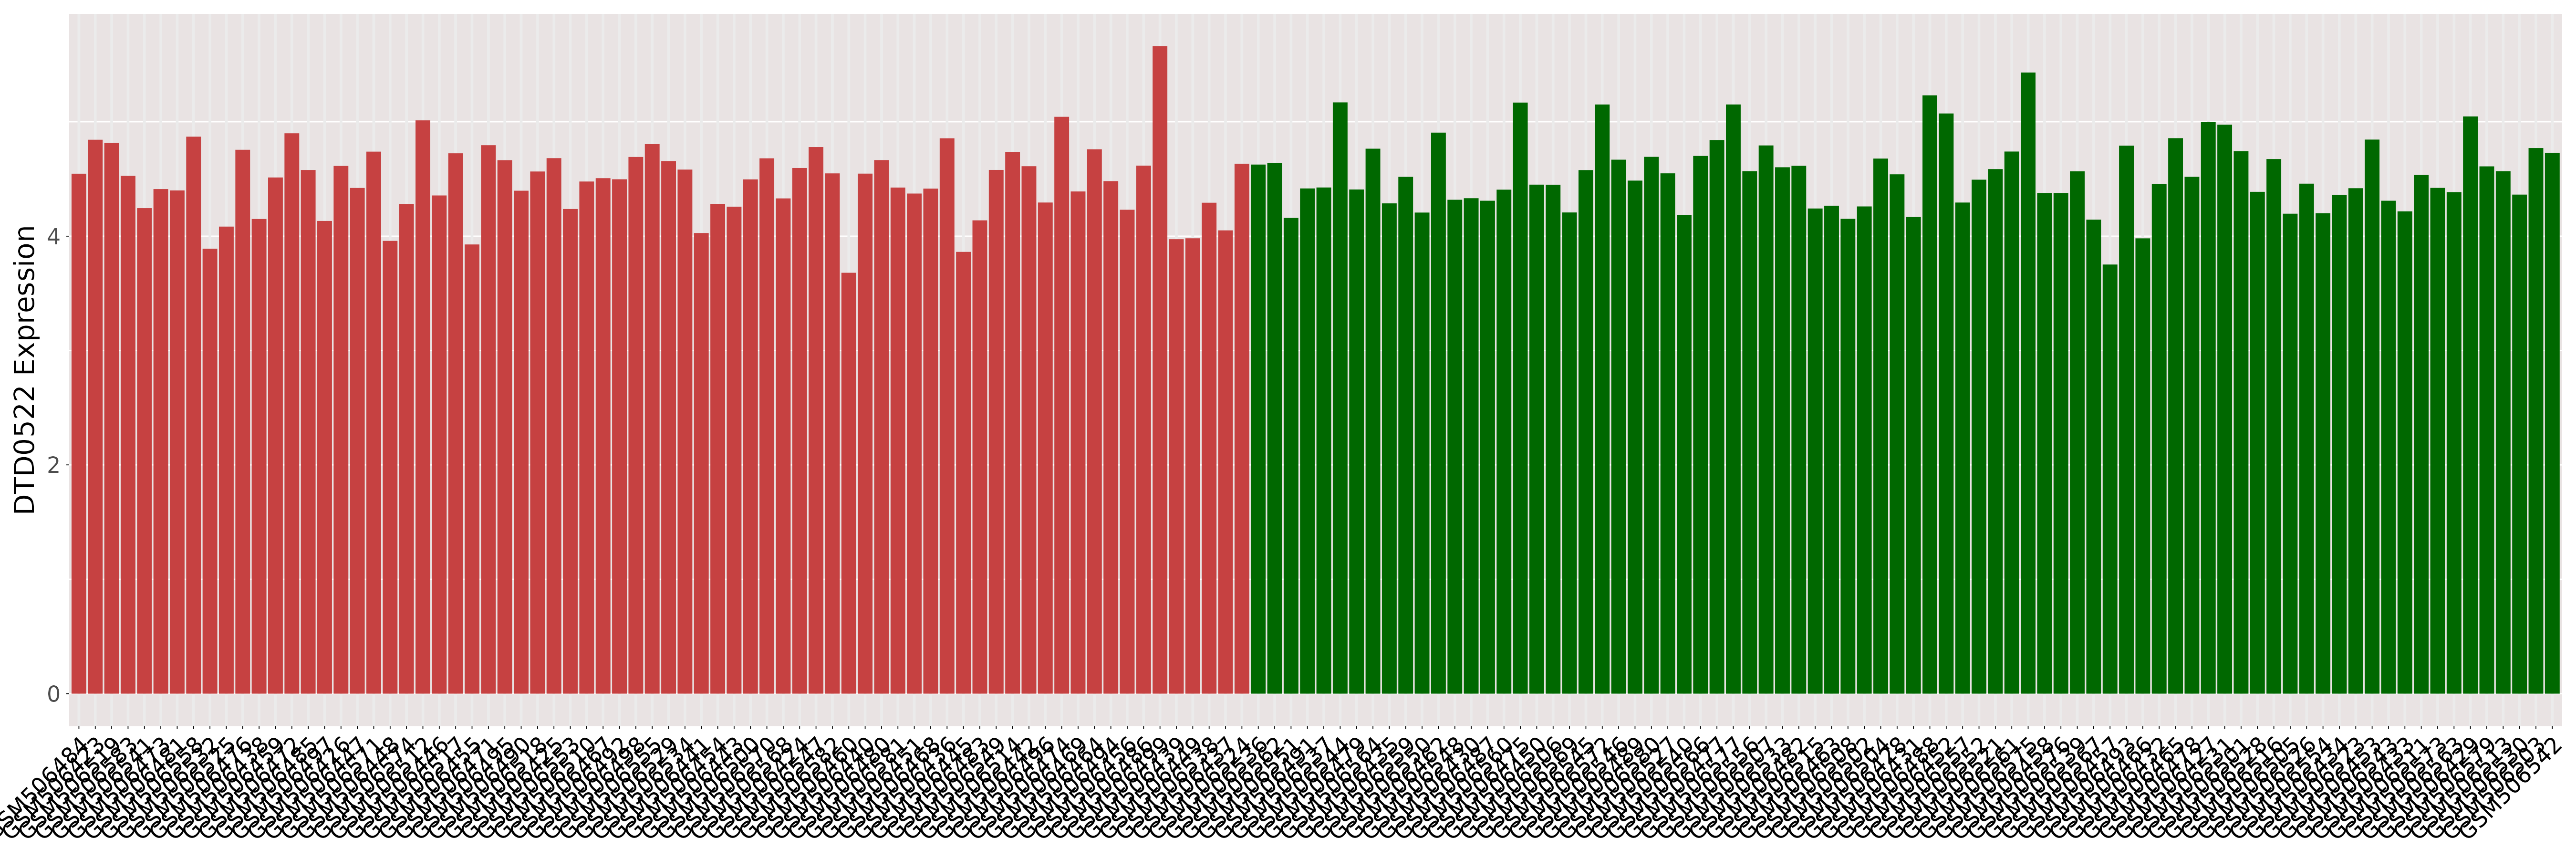
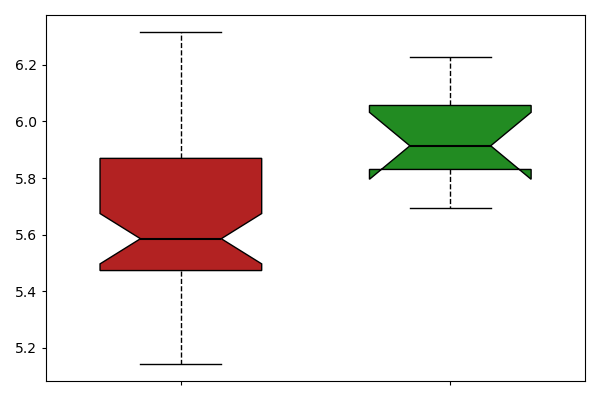
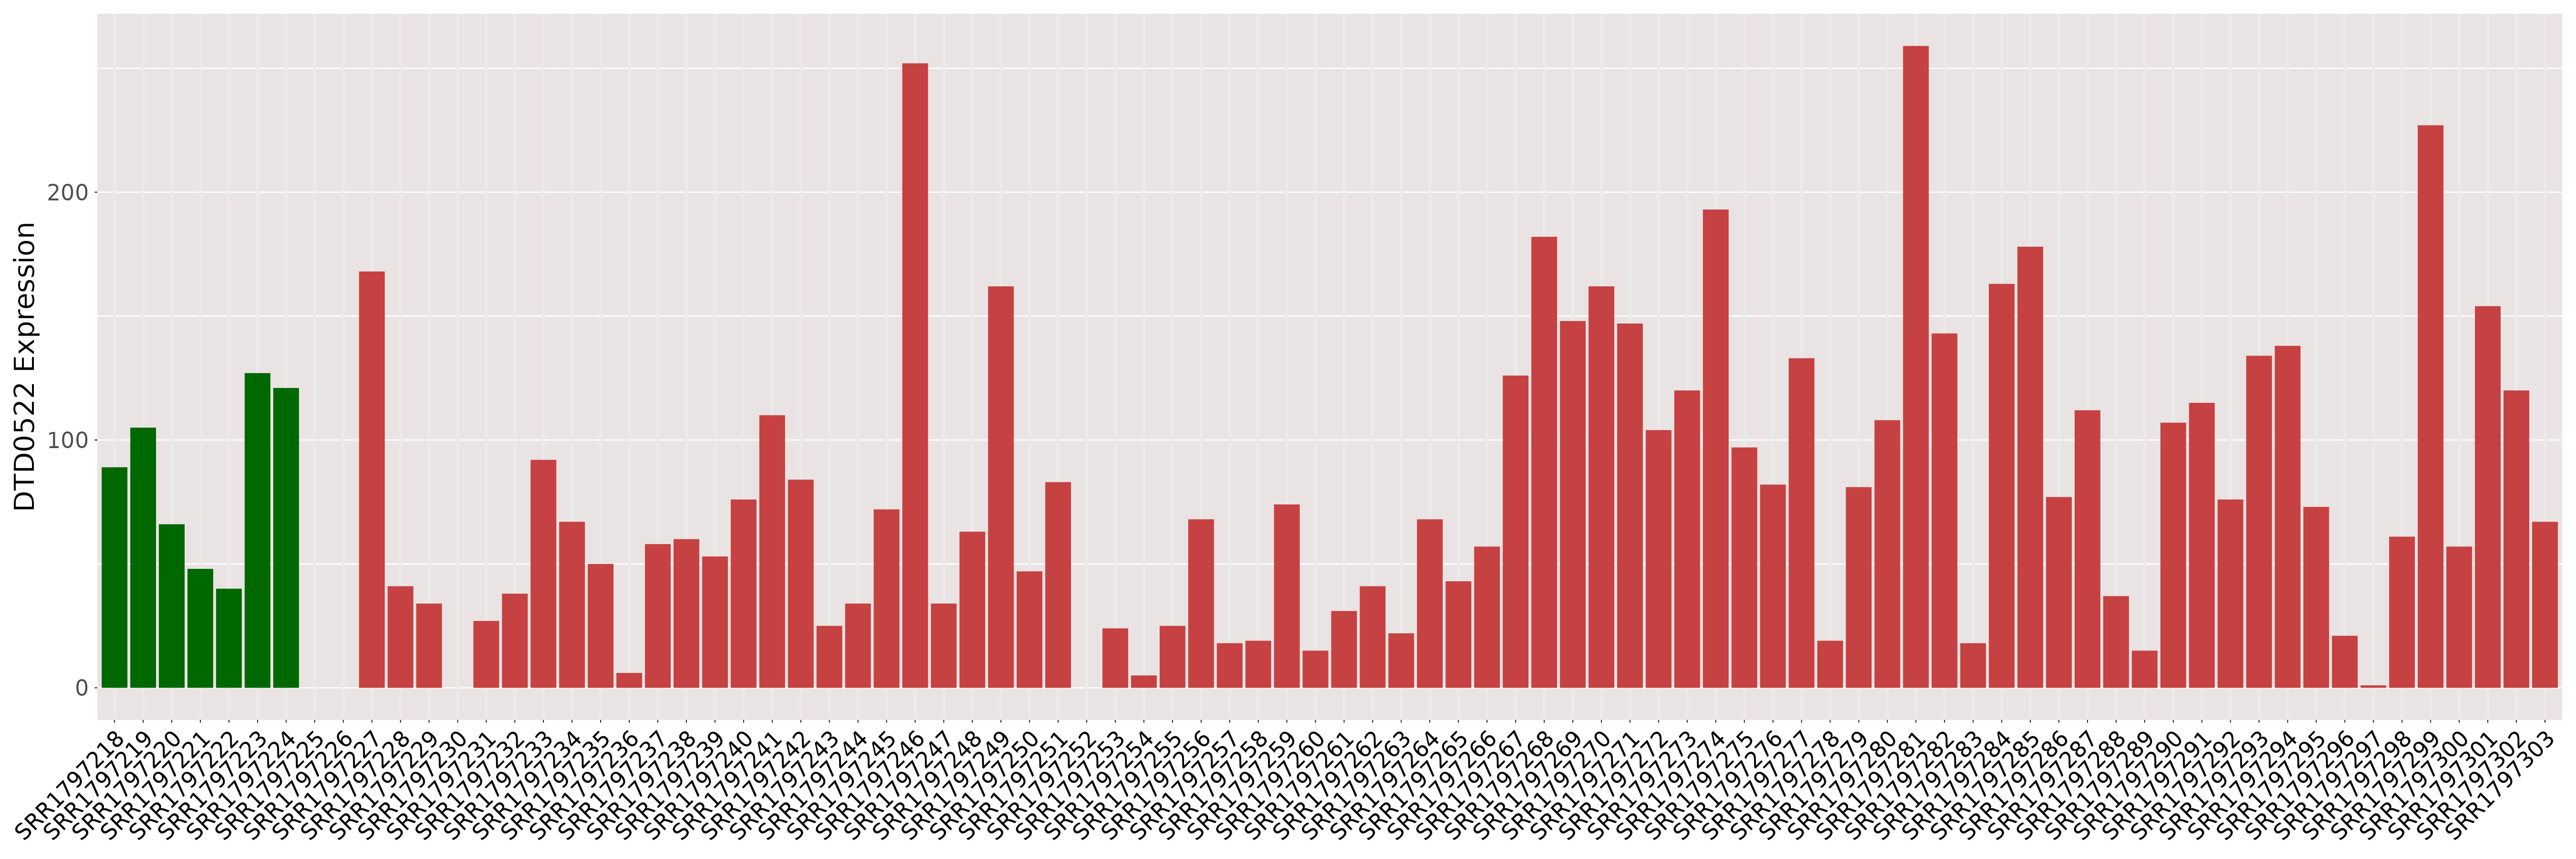
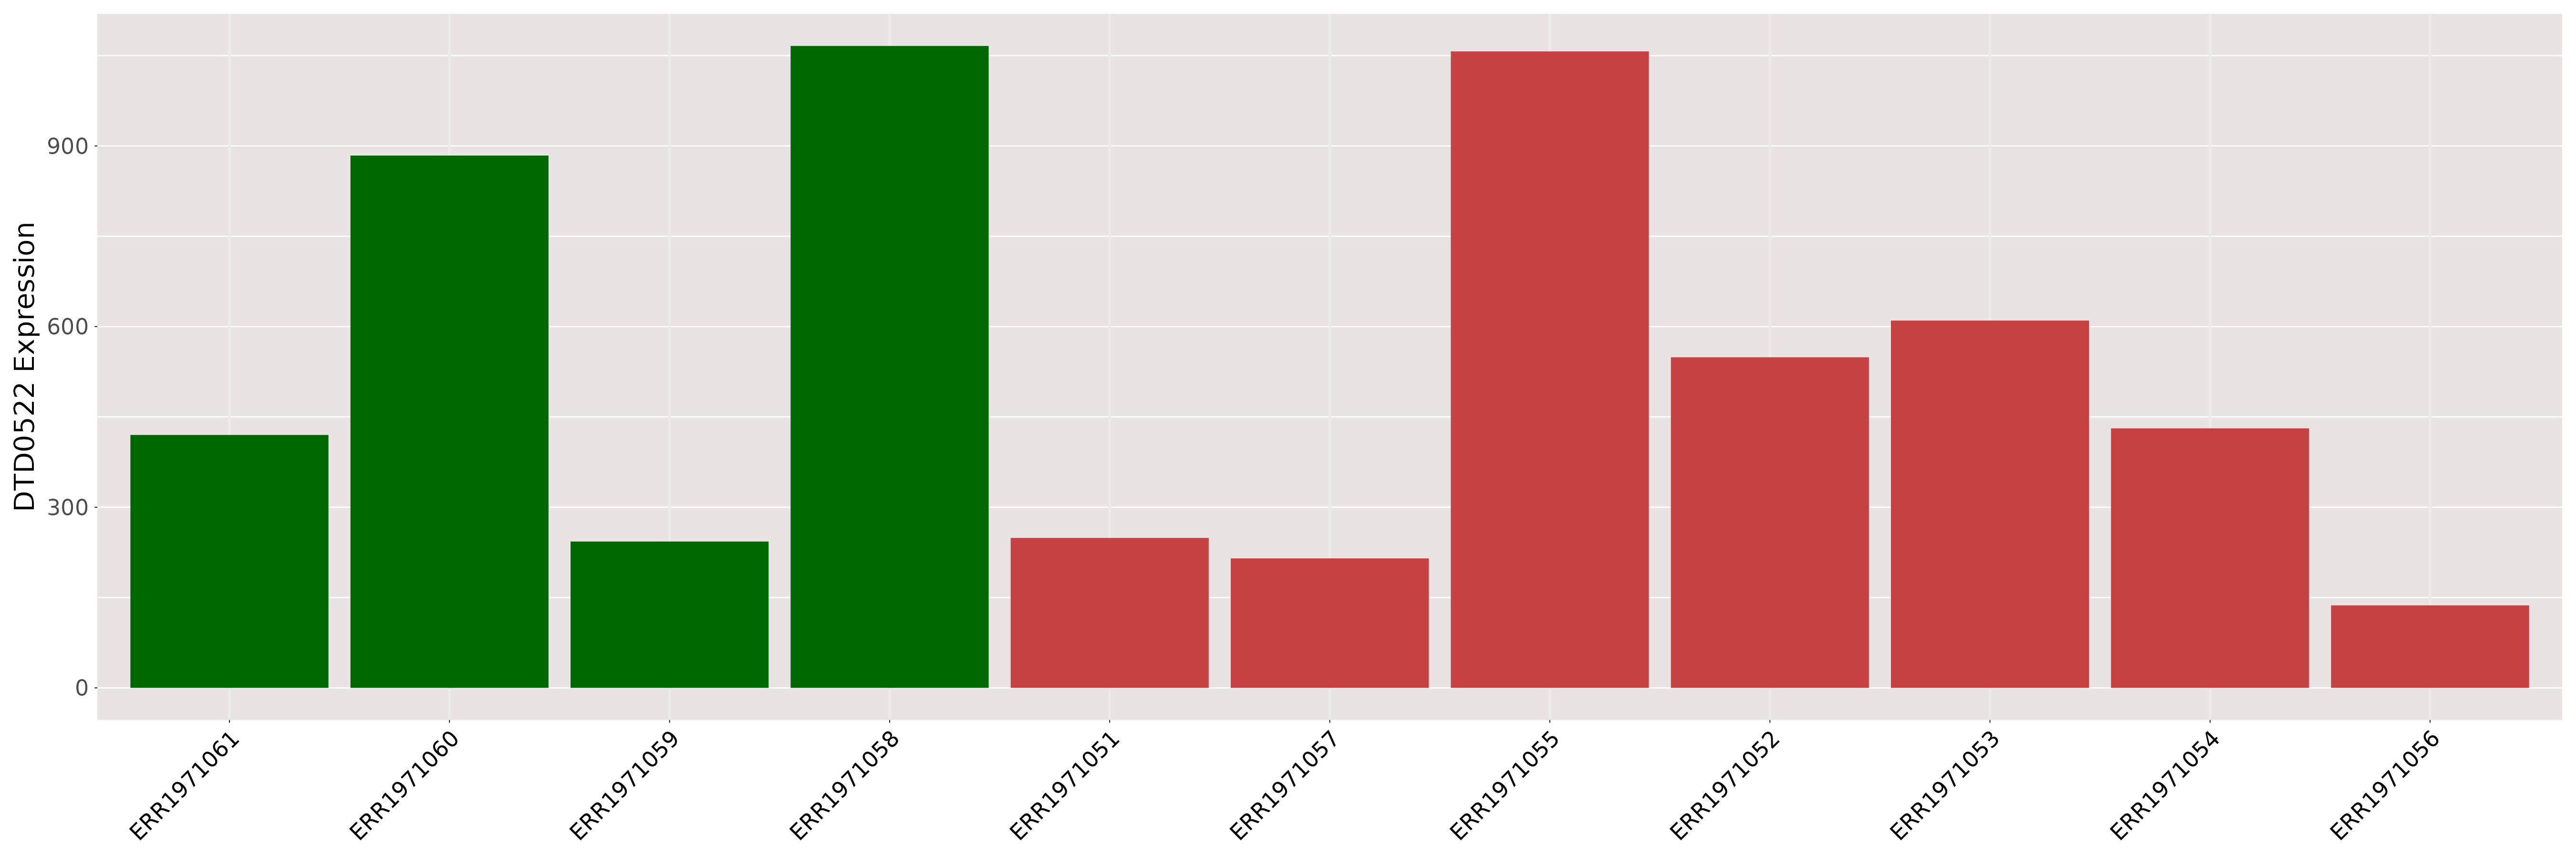
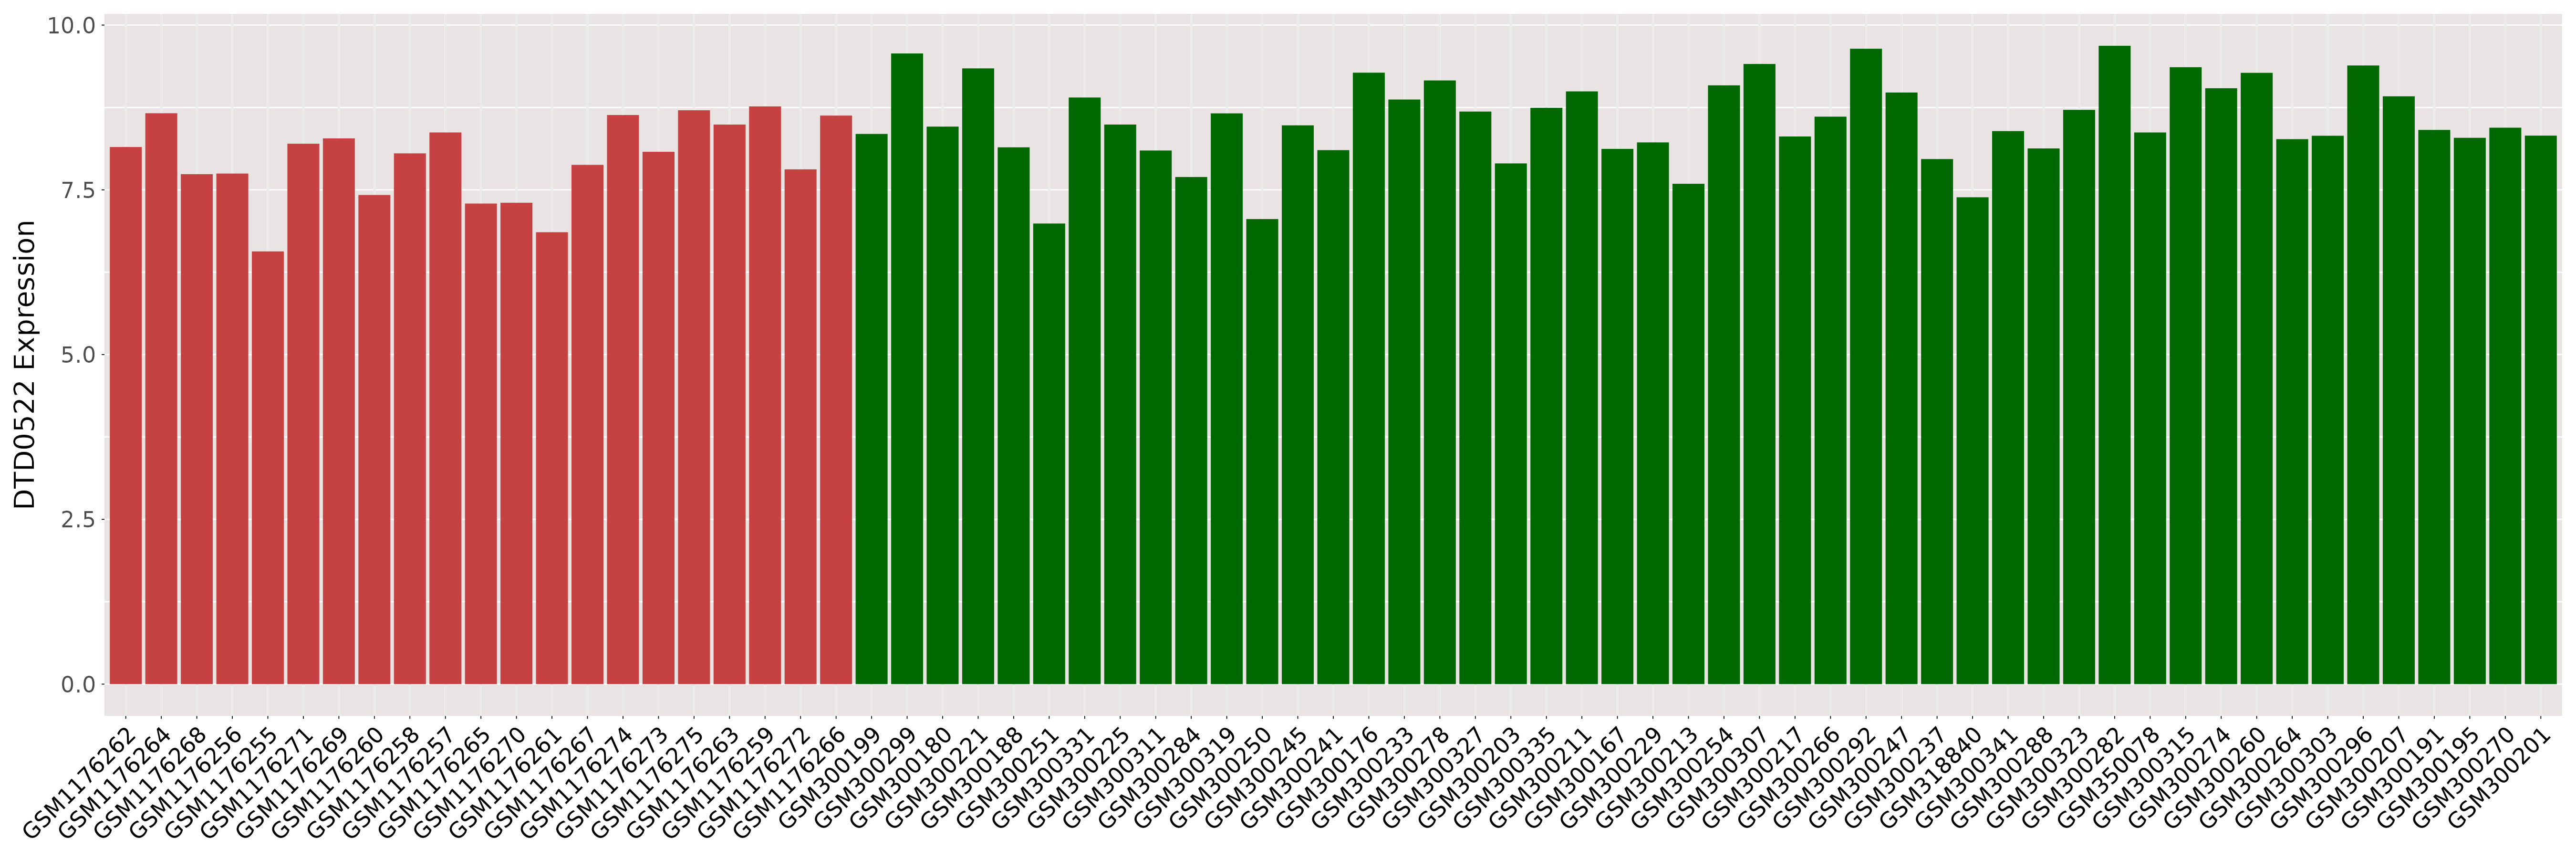
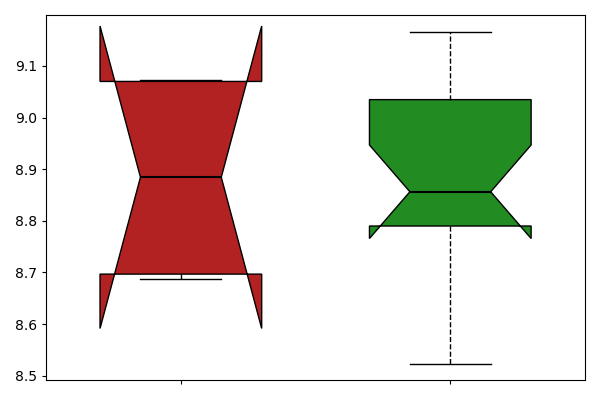
| [+] ICD-11: 2A00.0Y Ependymoma (other specified primary brain neoplasm) | Click to Show/Hide the Full List | ||||
| The Studied Tissue | Brain | ||||
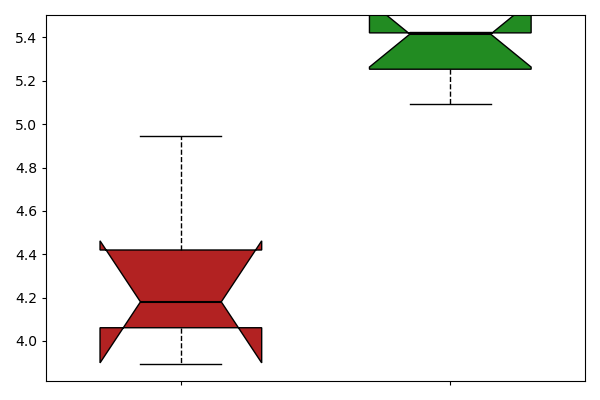
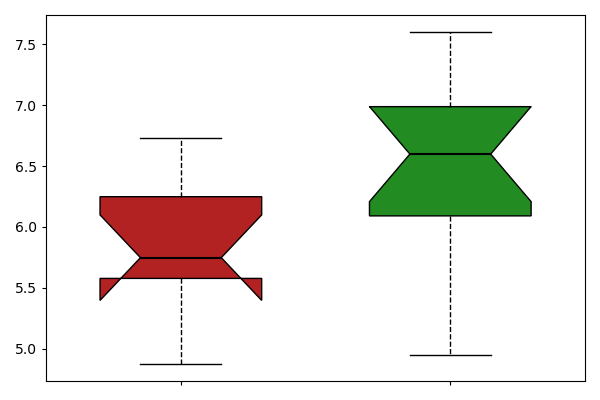
| The Specified Disease | Ependymoma [ICD-11:2A00.0Y] | ||||
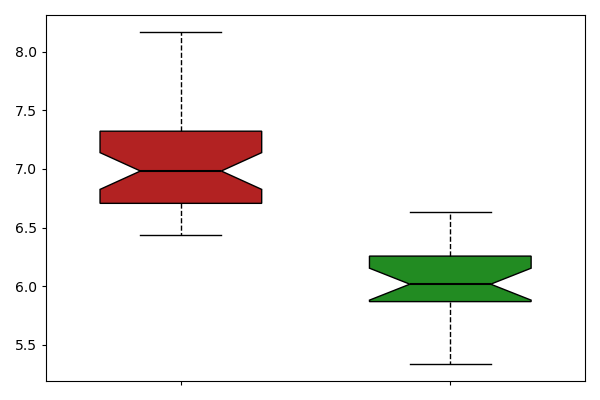
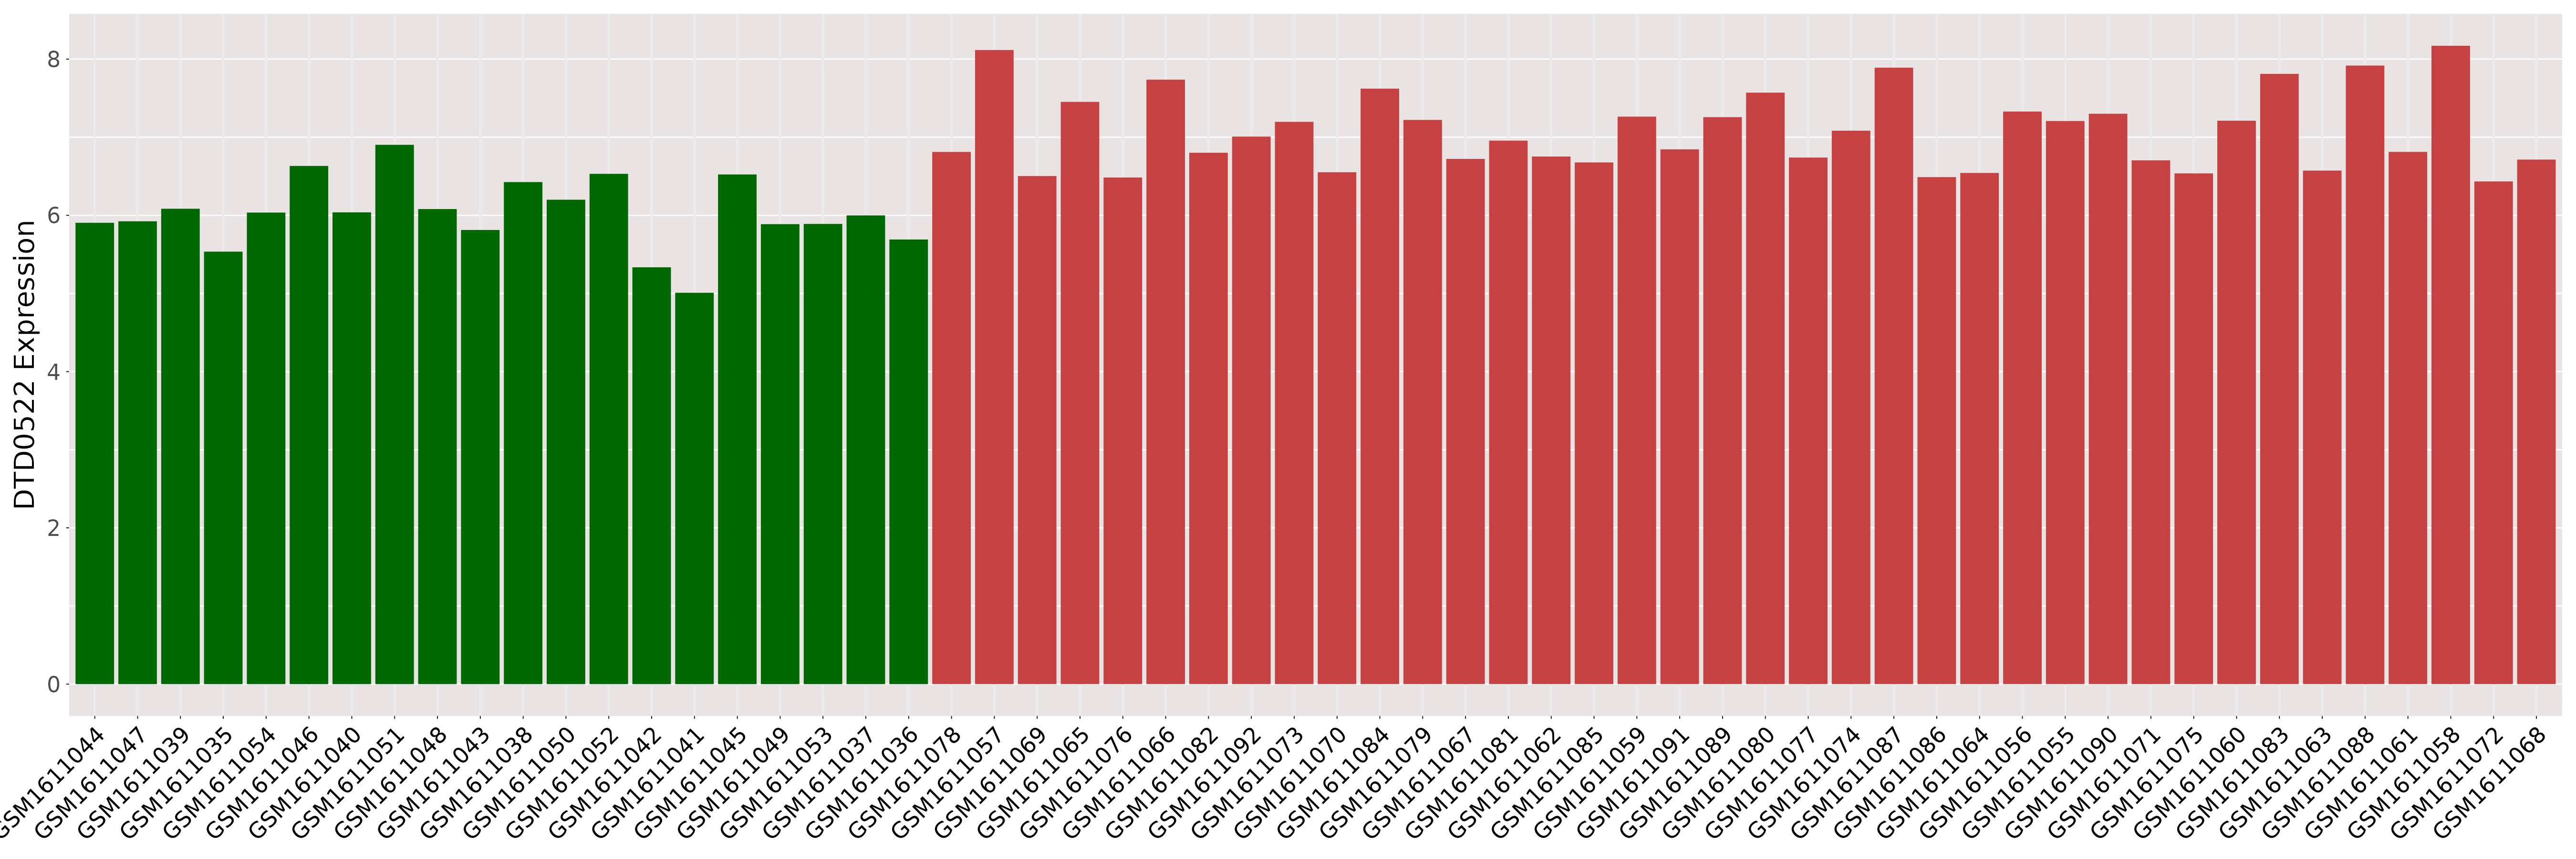
| The Expression Level of Disease Section Compare with the Healthy Individual Tissue | p-value:3.823968953476269e-16; Fold-change:0.746969337311627; Z-score:-3.744077269 | ||||
| DT expression in the diseased tissue of patients
DT expression in the normal tissue of healthy individuals
|
|||||
|
 Please Click the above Thumbnail to View/Download
the Expression Barchart for All Samples Please Click the above Thumbnail to View/Download
the Expression Barchart for All Samples
|
||||
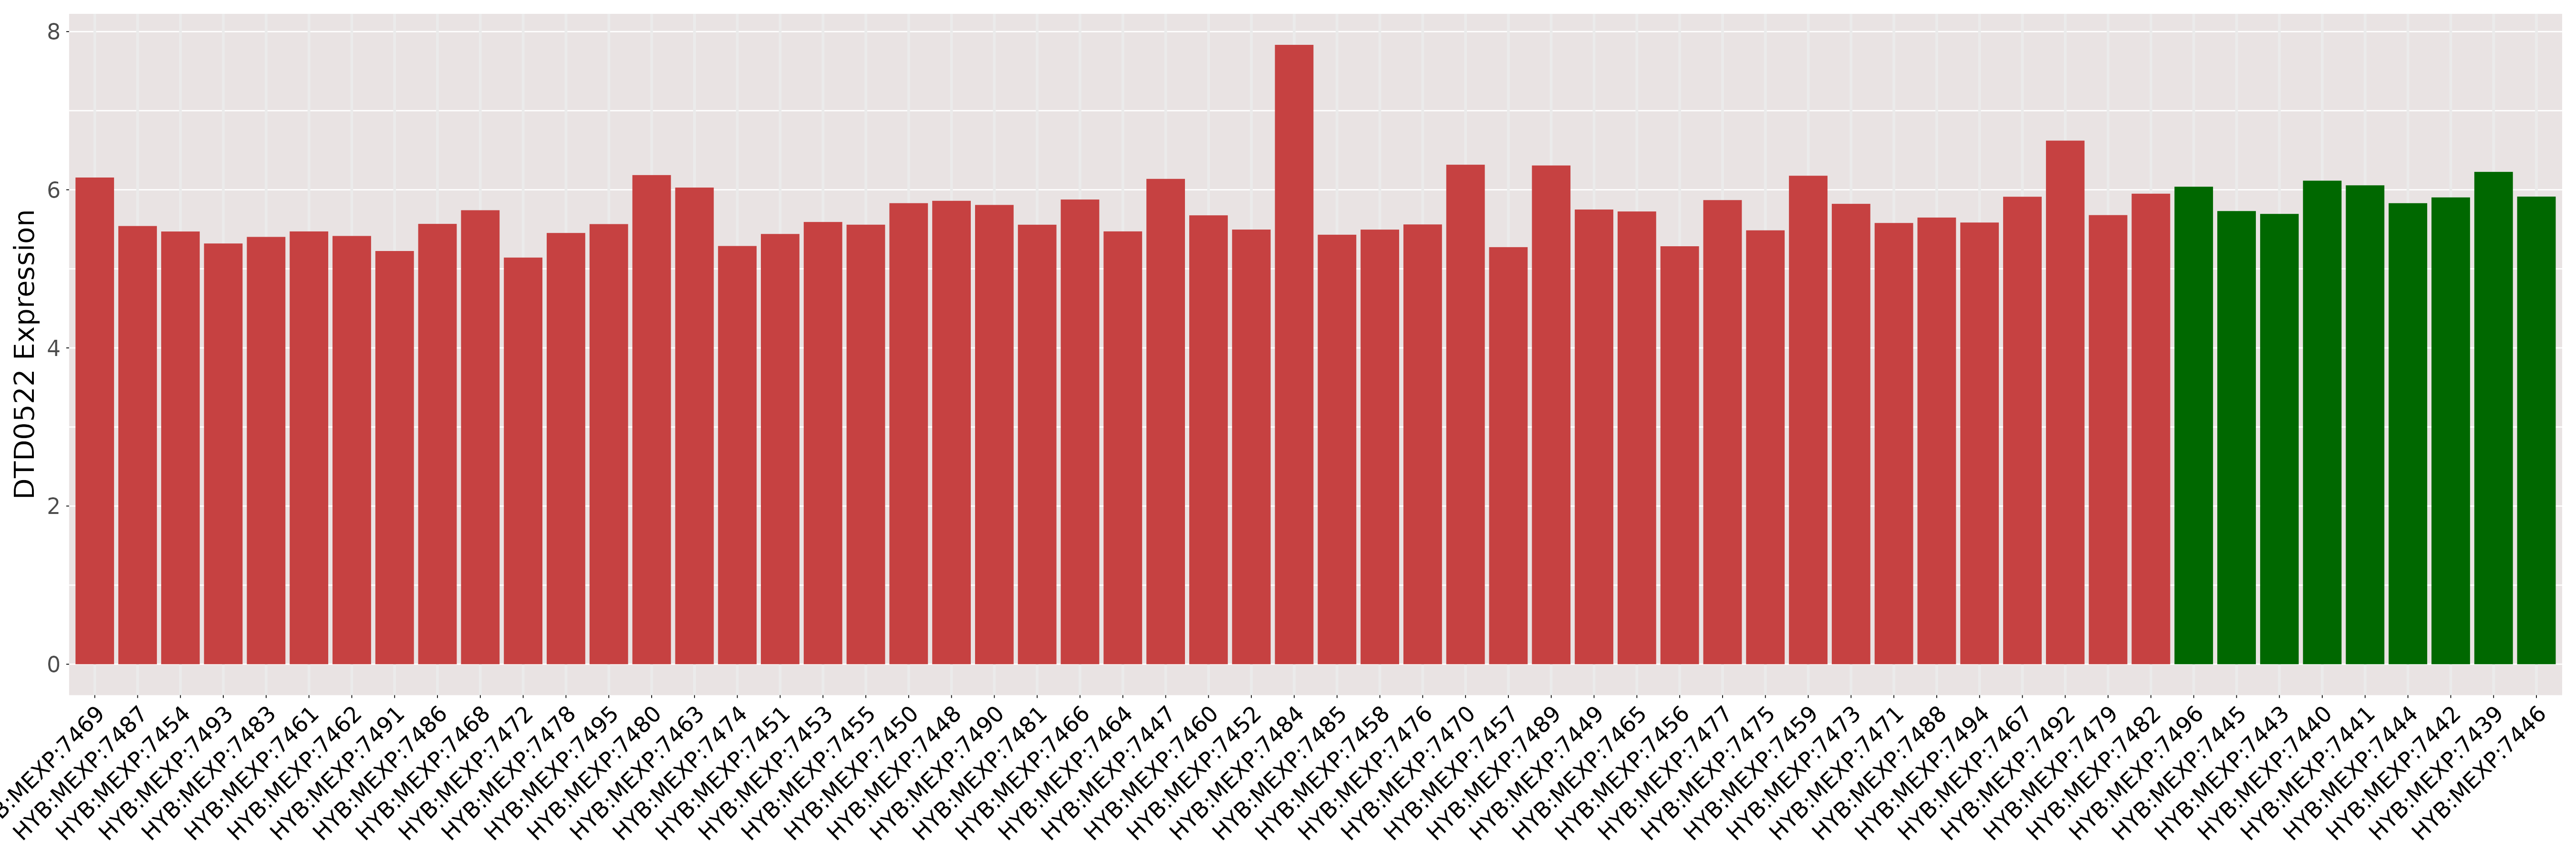
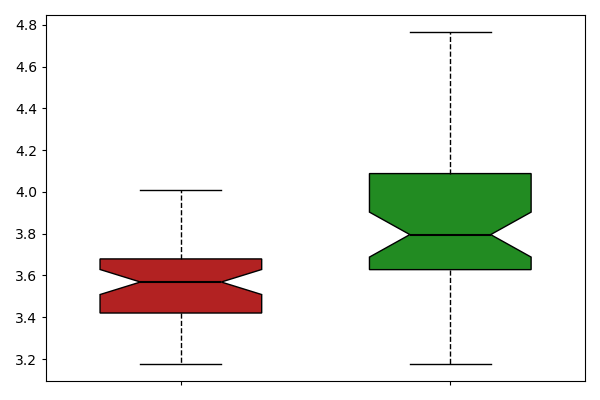
| [+] ICD-11: 2A00.10 Medulloblastoma | Click to Show/Hide the Full List | ||||
| The Studied Tissue | Brain | ||||
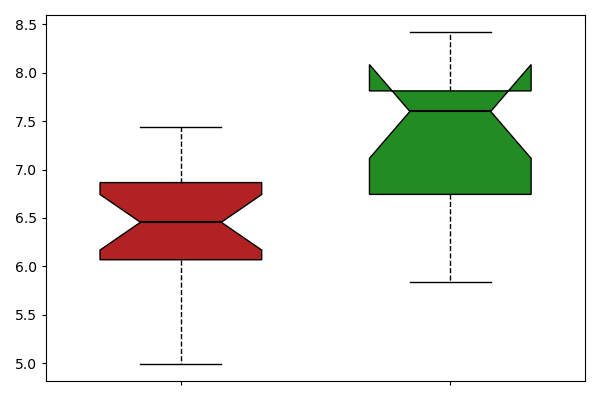
| The Specified Disease | Medulloblastoma [ICD-11:2A00.10] | ||||
| The Expression Level of Disease Section Compare with the Healthy Individual Tissue | p-value:5.329219189032895e-12; Fold-change:0.6902639091556341; Z-score:-9.996797578 | ||||
| DT expression in the diseased tissue of patients
DT expression in the normal tissue of healthy individuals
|
|||||
|
 Please Click the above Thumbnail to View/Download
the Expression Barchart for All Samples Please Click the above Thumbnail to View/Download
the Expression Barchart for All Samples
|
||||
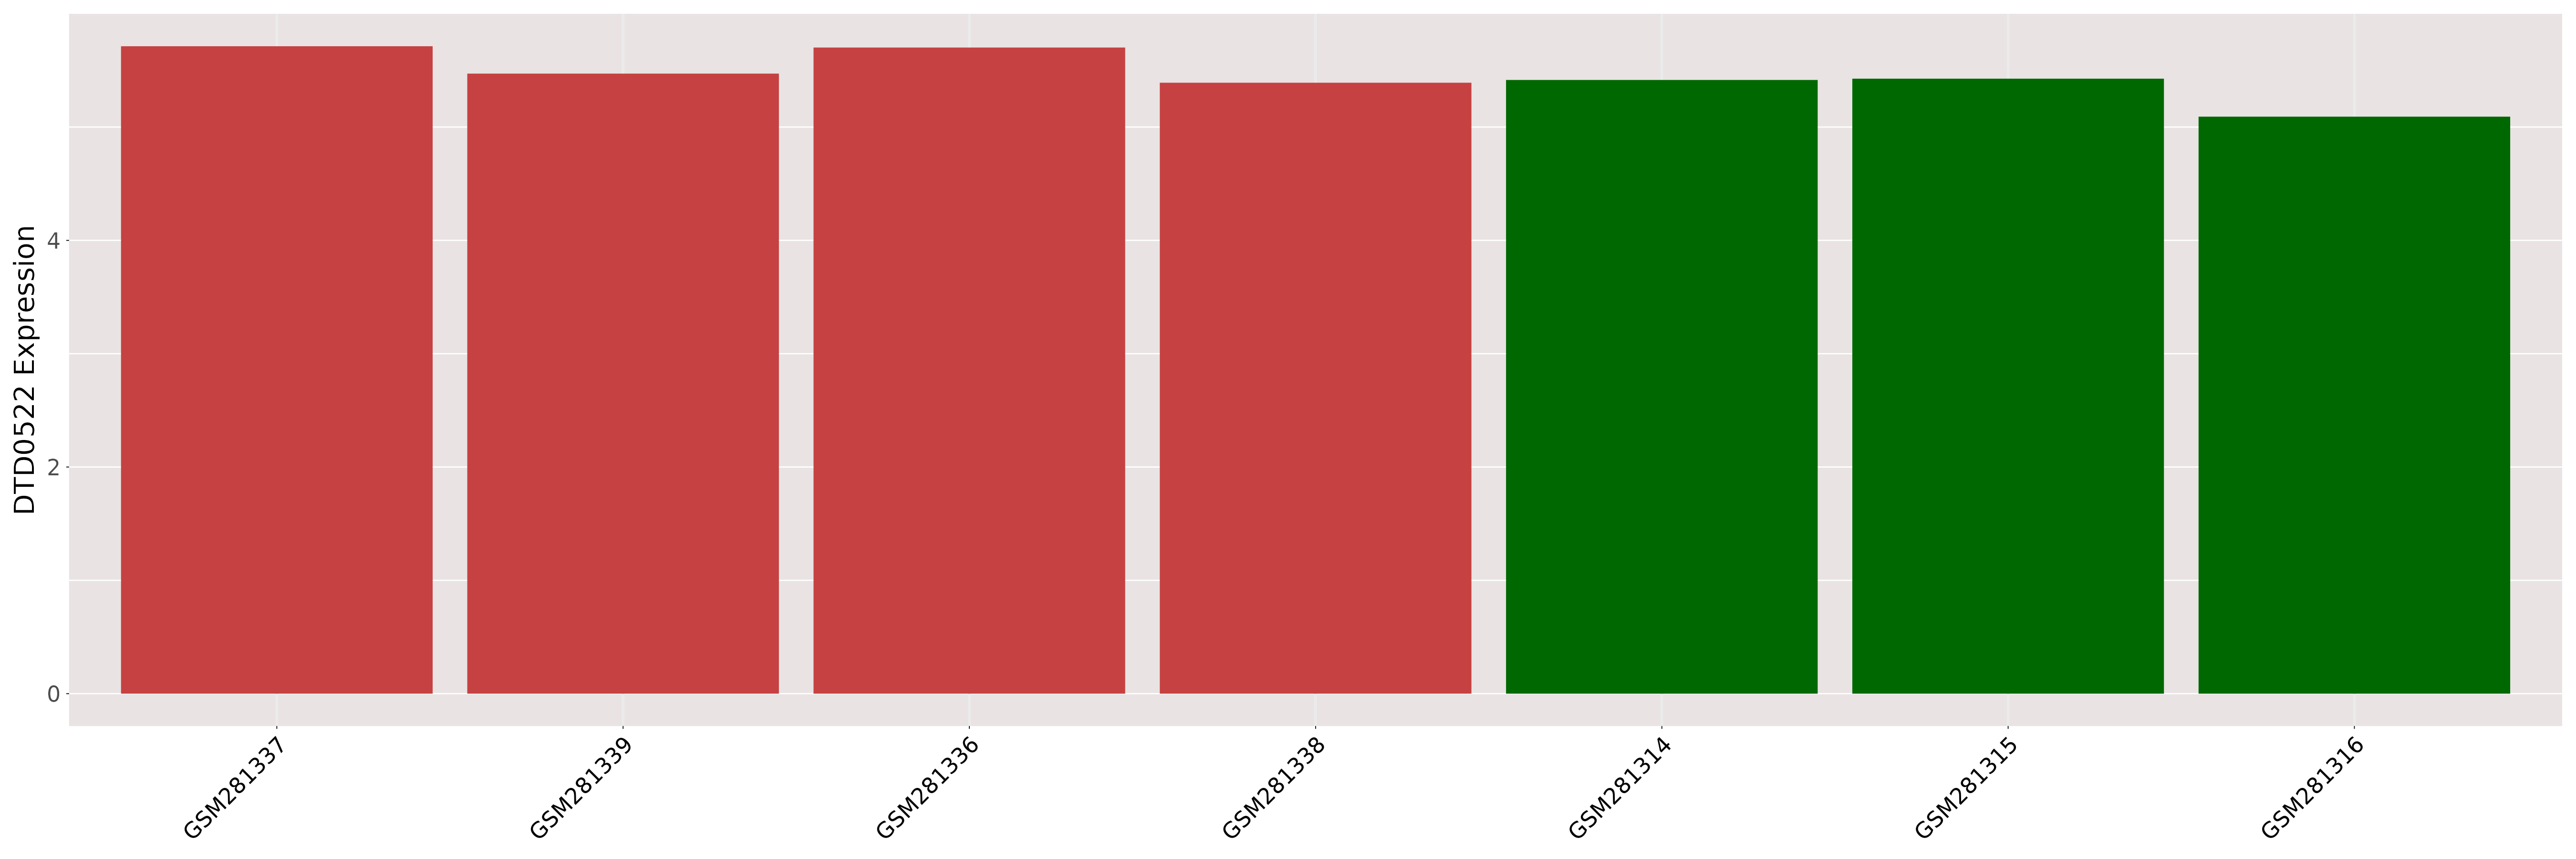
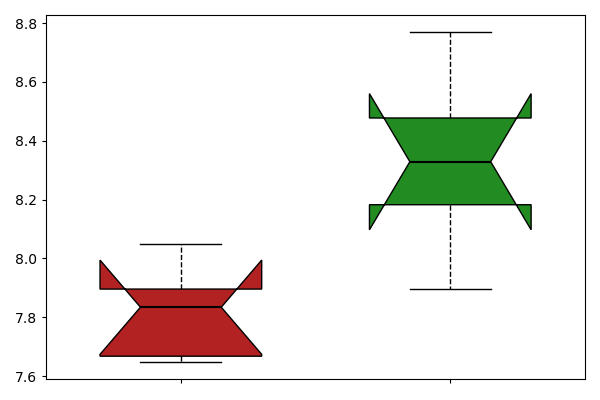
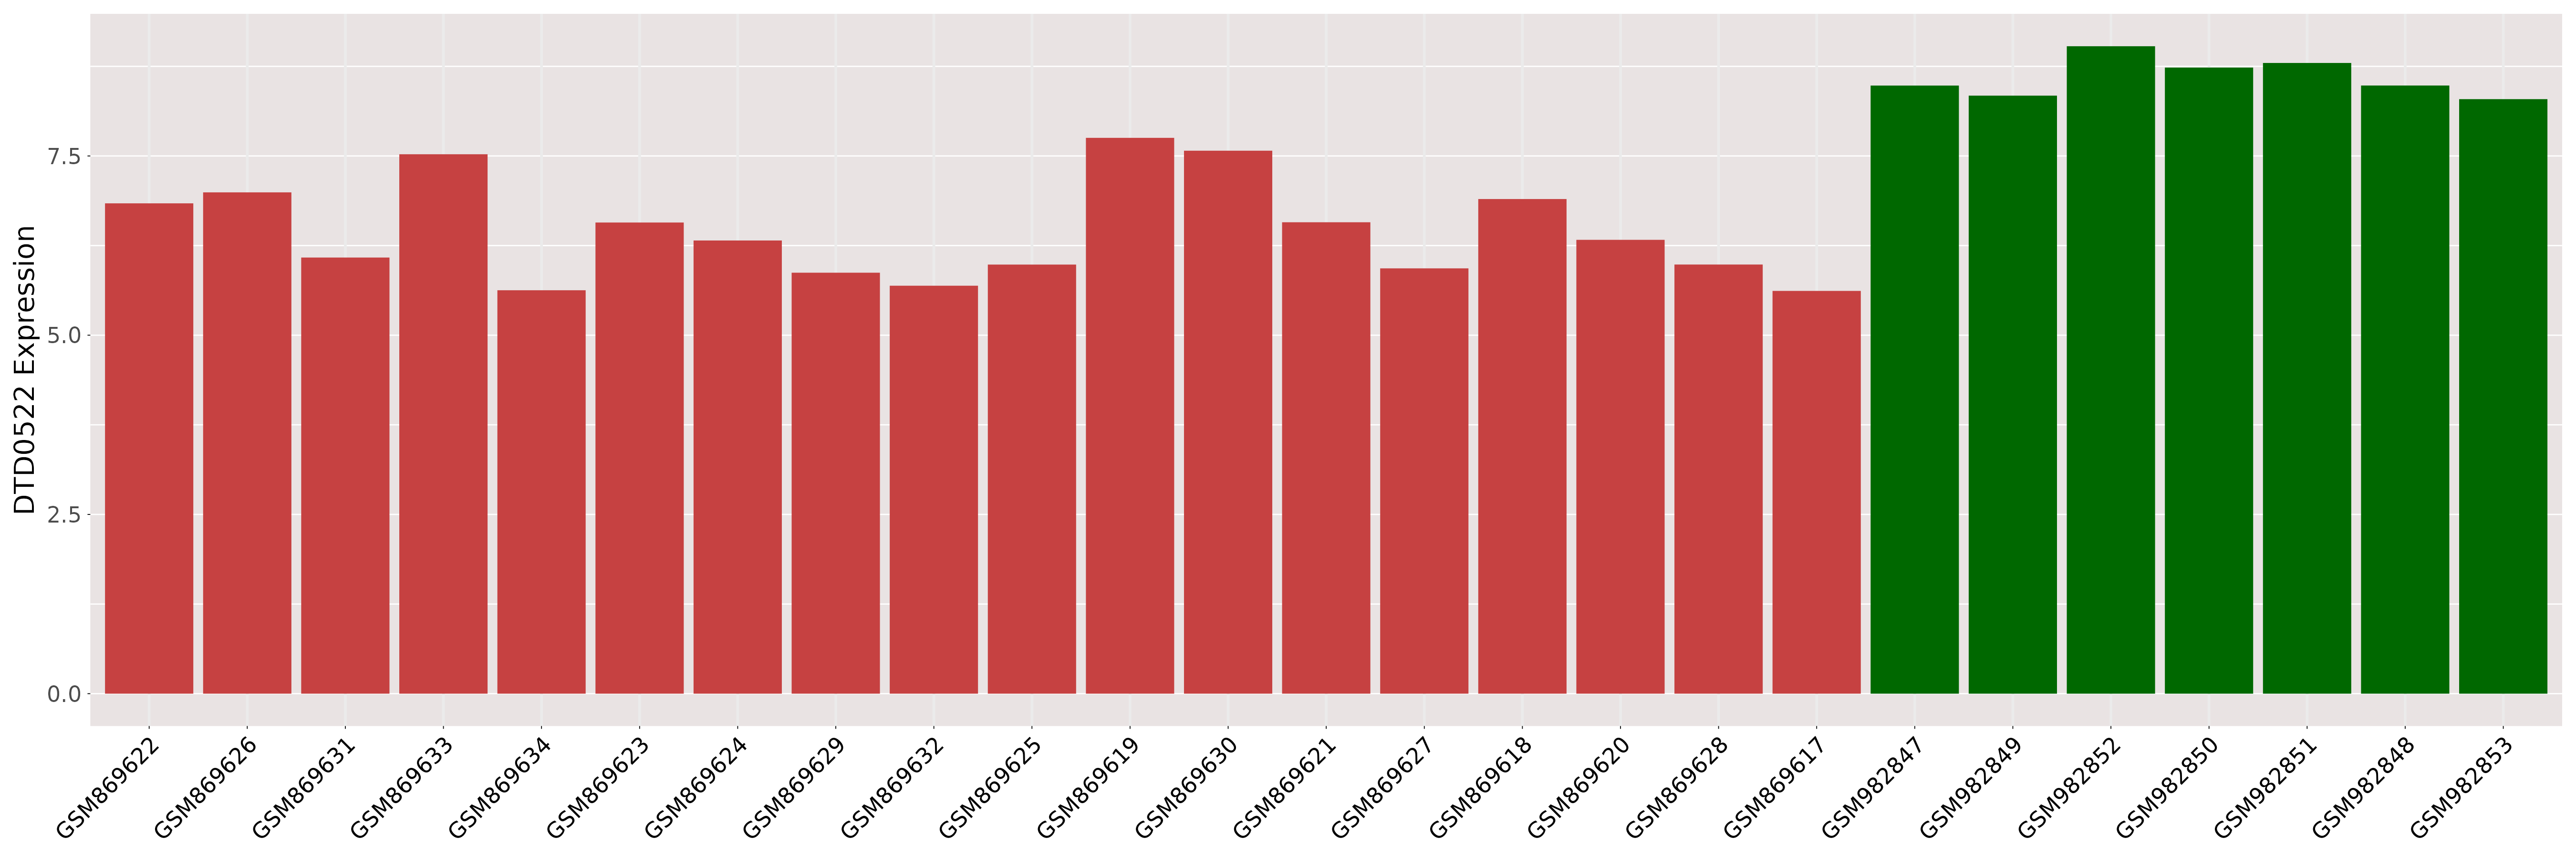
| [+] ICD-11: 2A00.1Y Glioblastoma (other specified malignant neoplasm of brain) | Click to Show/Hide the Full List | ||||
| The Studied Tissue | Brain | ||||
| The Specified Disease | Glioblastoma [ICD-11:2A00.1Y] | ||||
| The Expression Level of Disease Section Compare with the Healthy Individual Tissue | p-value:4.075167658595424e-11; Fold-change:0.746151125749314; Z-score:-8.143072597 | ||||
| DT expression in the diseased tissue of patients
DT expression in the normal tissue of healthy individuals
|
|||||
|
 Please Click the above Thumbnail to View/Download
the Expression Barchart for All Samples Please Click the above Thumbnail to View/Download
the Expression Barchart for All Samples
|
||||
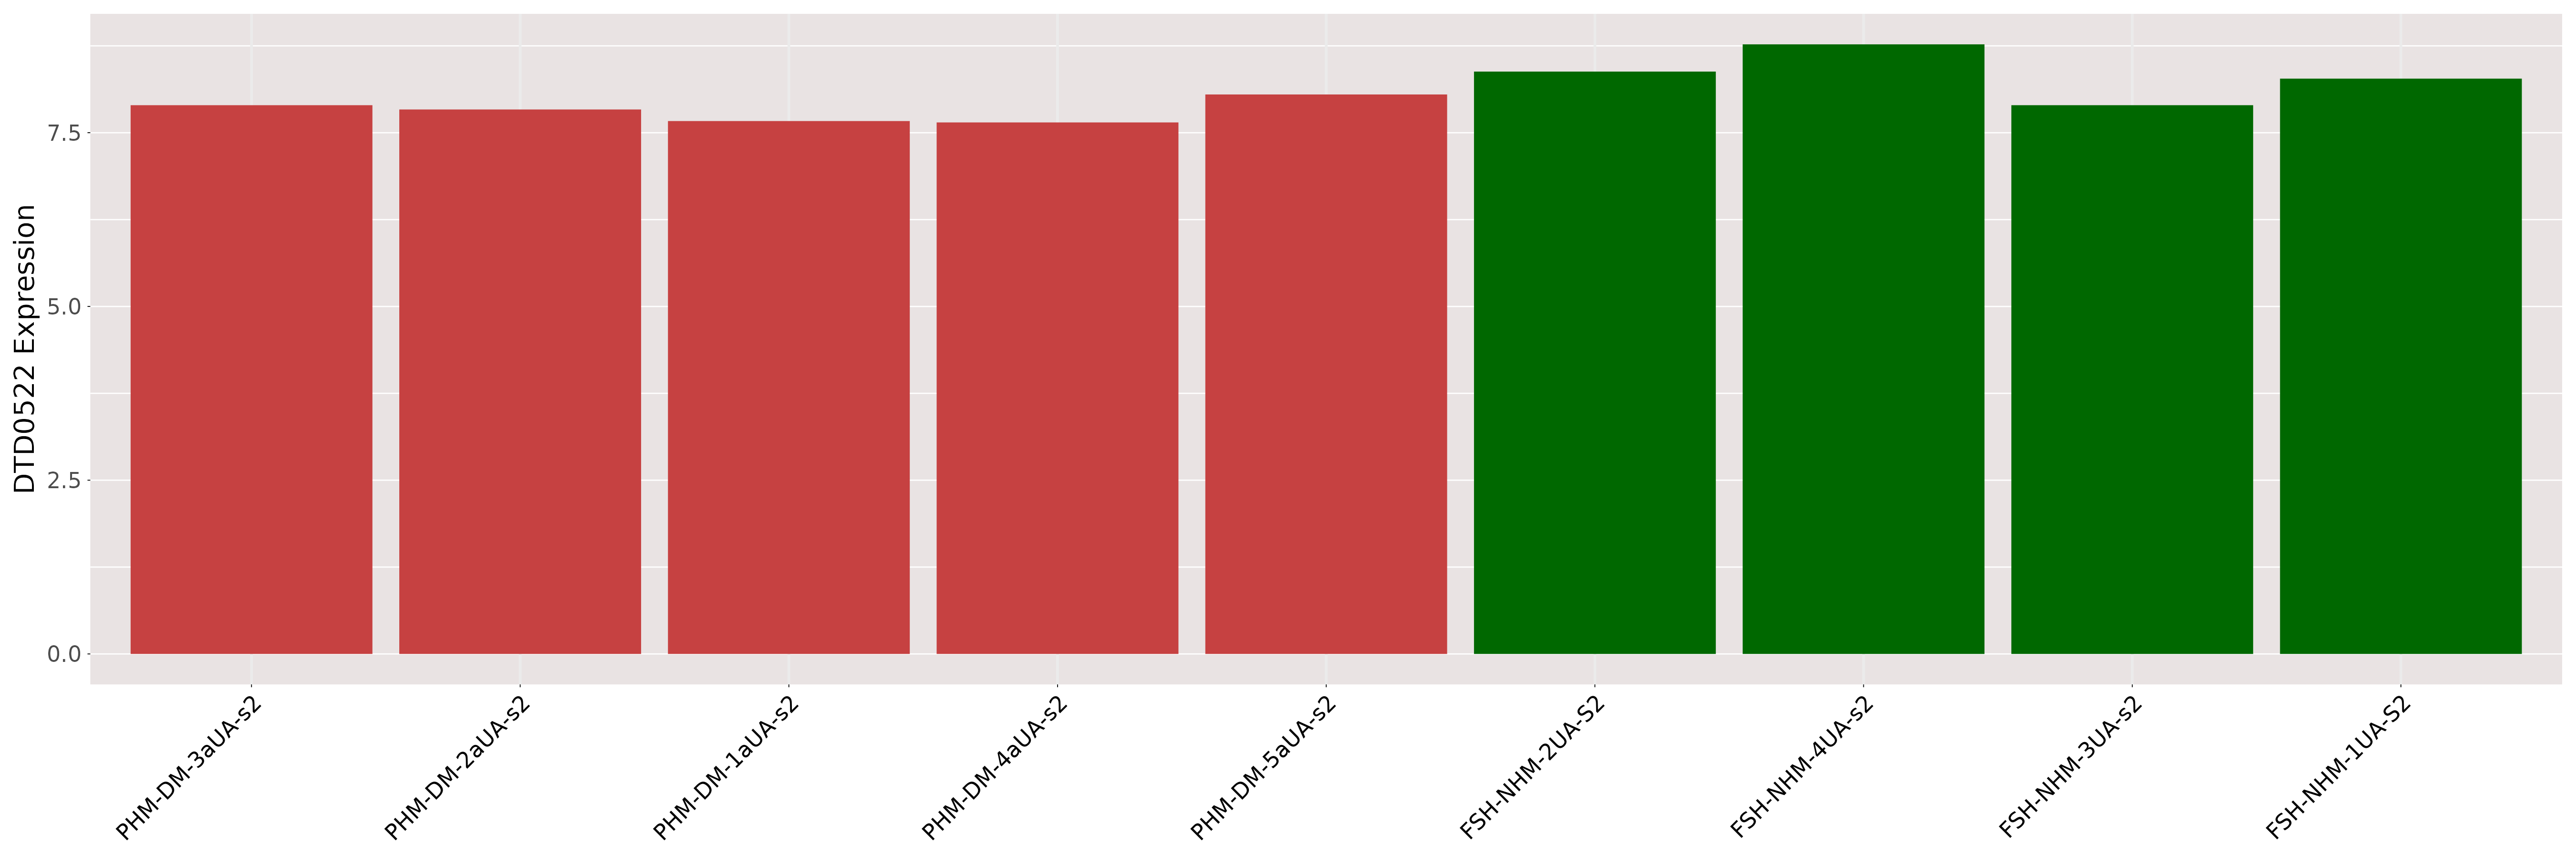
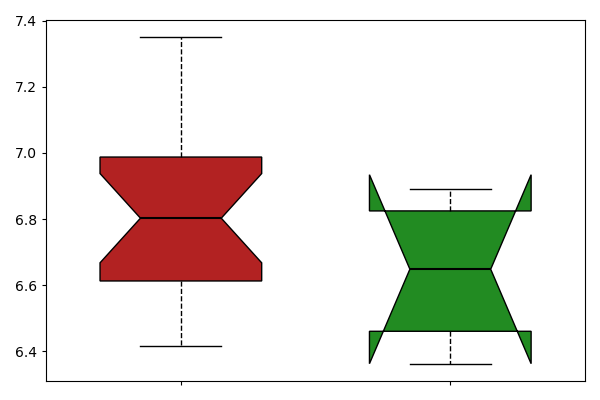
| [+] ICD-11: 2A00.1Y Large-cell medulloblastoma | Click to Show/Hide the Full List | ||||
| The Studied Tissue | Brain | ||||
| The Specified Disease | Medulloblastoma, large cell [ICD-11:2A00.10] | ||||
| The Expression Level of Disease Section Compare with the Healthy Individual Tissue | p-value:8.358674221465055e-06; Fold-change:0.7730389988123916; Z-score:-7.858093008 | ||||
| DT expression in the diseased tissue of patients
DT expression in the normal tissue of healthy individuals
|
|||||
|
 Please Click the above Thumbnail to View/Download
the Expression Barchart for All Samples Please Click the above Thumbnail to View/Download
the Expression Barchart for All Samples
|
||||
| [+] ICD-11: 2A00.1Y Primitive neuroectodermal tumor (PNET) | Click to Show/Hide the Full List | ||||
| The Studied Tissue | Brain | ||||
| The Specified Disease | Primitive neuroectodermal tumor [ICD-11:2A00.Y] | ||||
| The Expression Level of Disease Section Compare with the Healthy Individual Tissue | p-value:2.696664576193841e-05; Fold-change:0.8072590415872327; Z-score:-6.880082393 | ||||
| DT expression in the diseased tissue of patients
DT expression in the normal tissue of healthy individuals
|
|||||
|
 Please Click the above Thumbnail to View/Download
the Expression Barchart for All Samples Please Click the above Thumbnail to View/Download
the Expression Barchart for All Samples
|
||||
| [+] ICD-11: 2A82.0 Chronic lymphocytic leukaemia of B-cell type | Click to Show/Hide the Full List | ||||
| The Studied Tissue | Blood | ||||
| The Specified Disease | Cll [ICD-11:2A82.00] | ||||
| The Expression Level of Disease Section Compare with the Healthy Individual Tissue | p-value:0.8786172769870207; Fold-change:0.9963119033287506; Z-score:-0.042072246 | ||||
| DT expression in the diseased tissue of patients
DT expression in the normal tissue of healthy individuals
|
|||||
|
 Please Click the above Thumbnail to View/Download
the Expression Barchart for All Samples Please Click the above Thumbnail to View/Download
the Expression Barchart for All Samples
|
||||
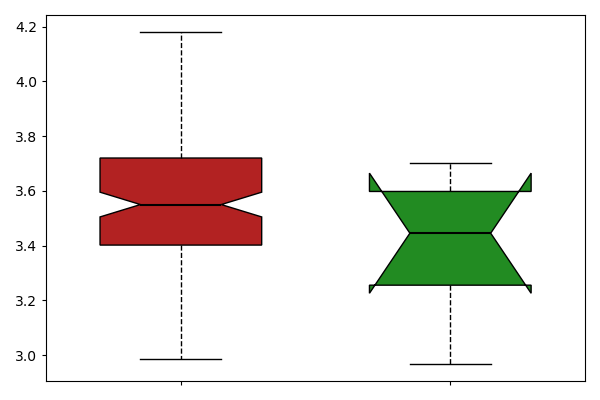
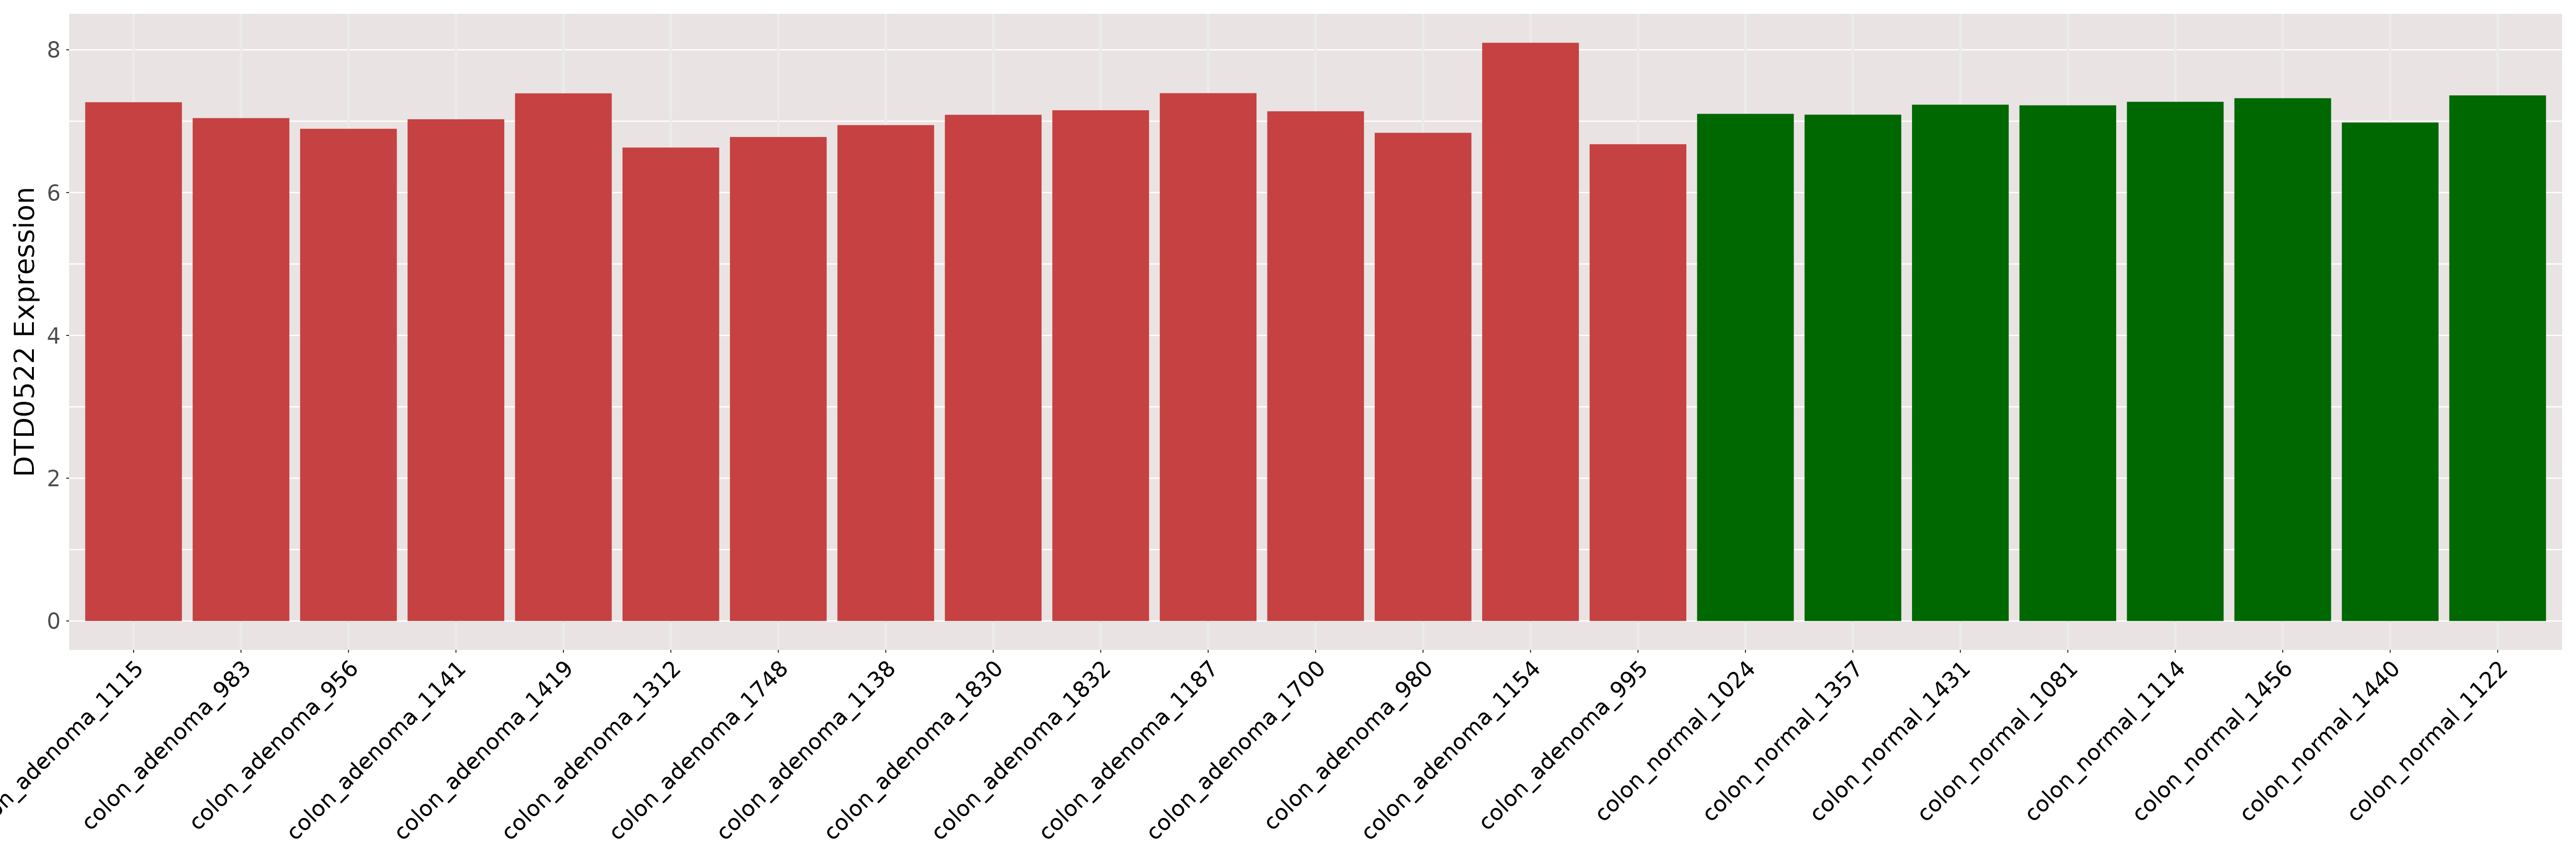
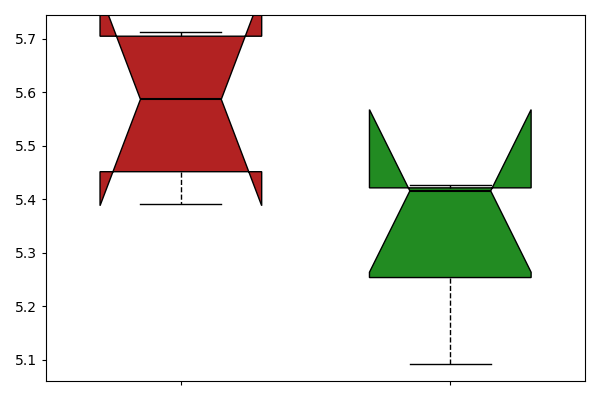
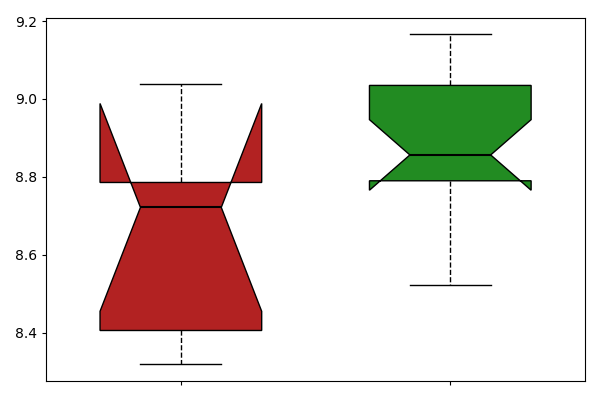
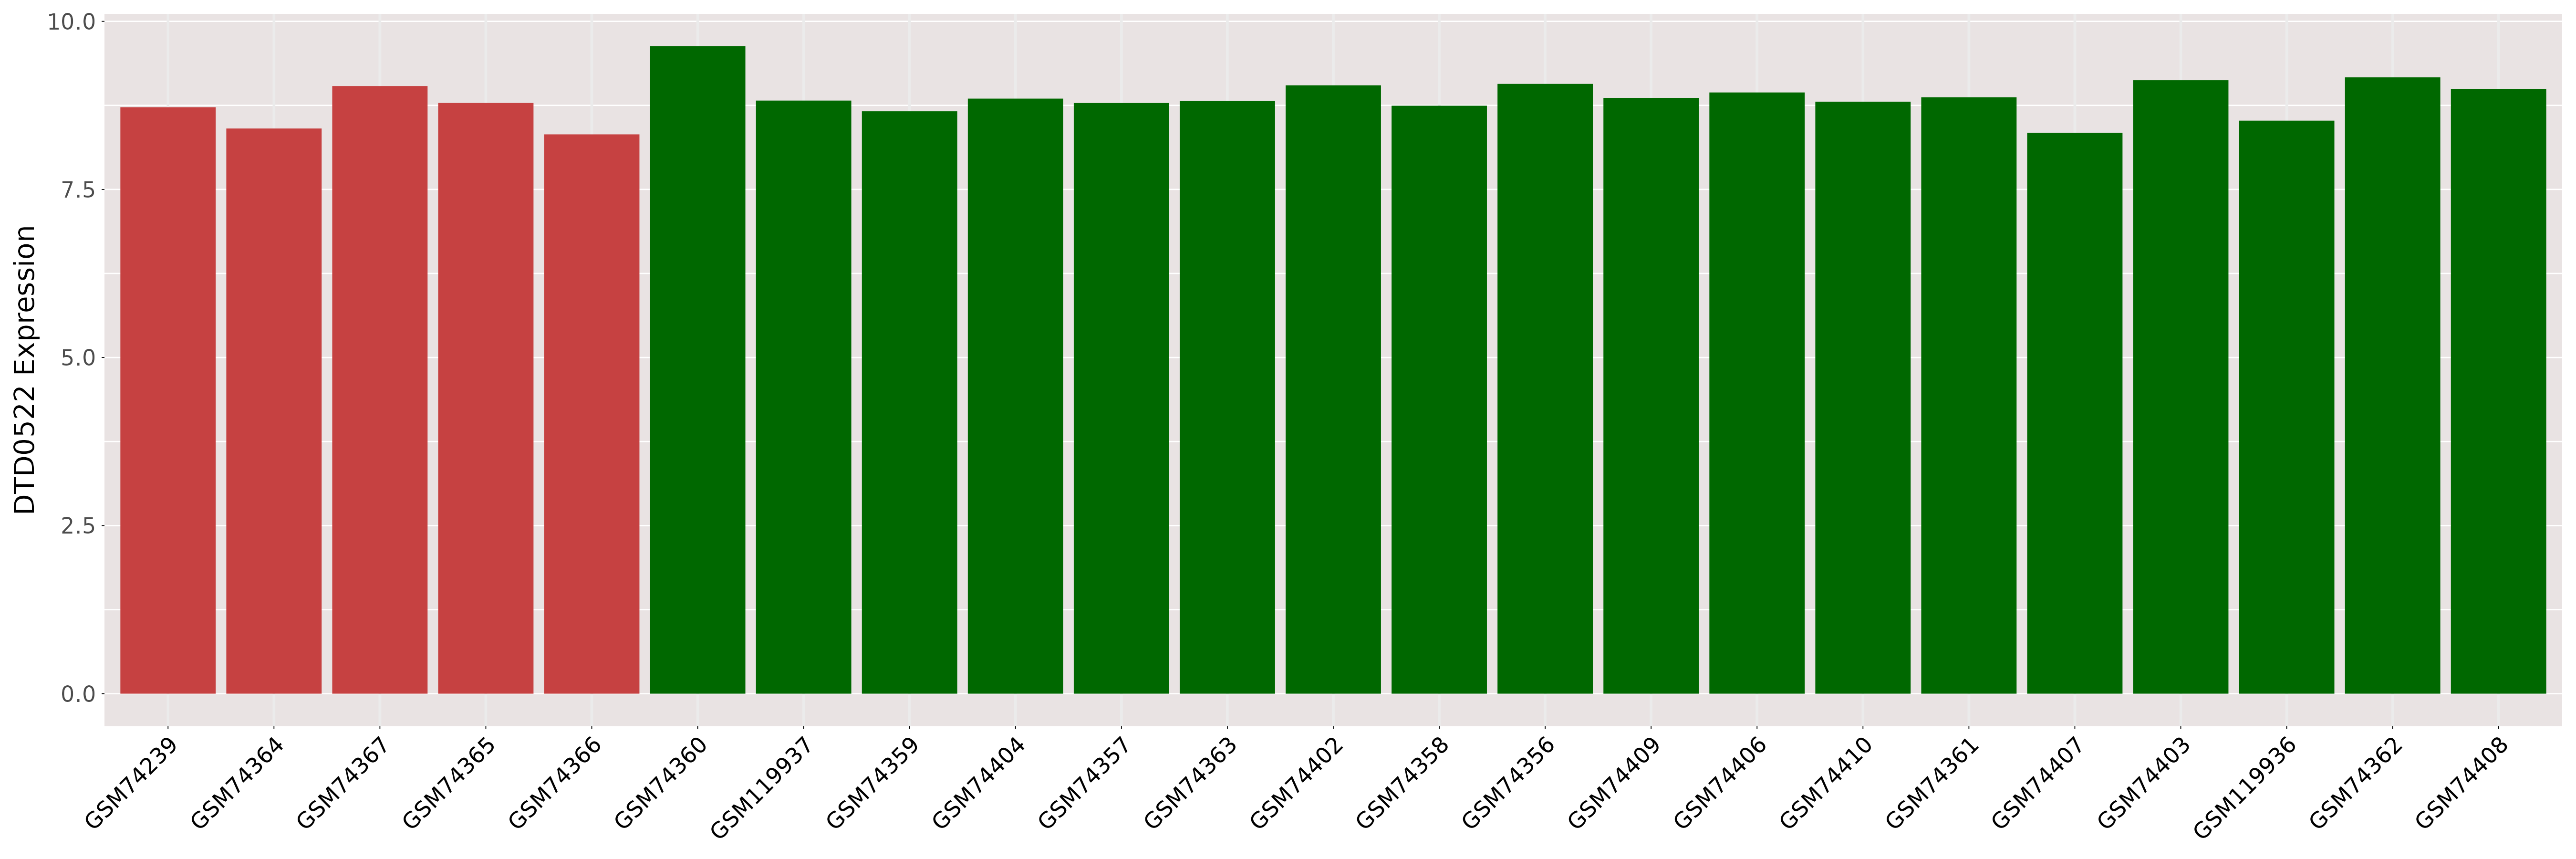
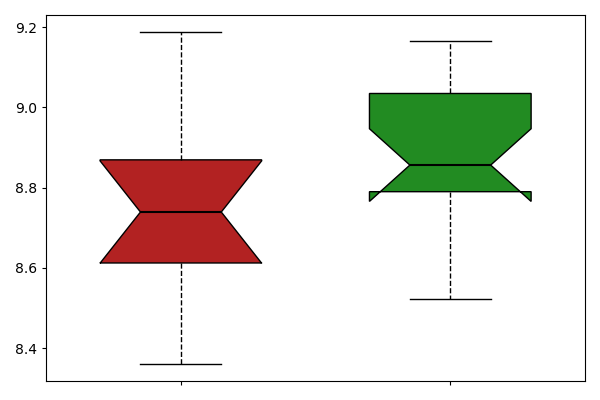
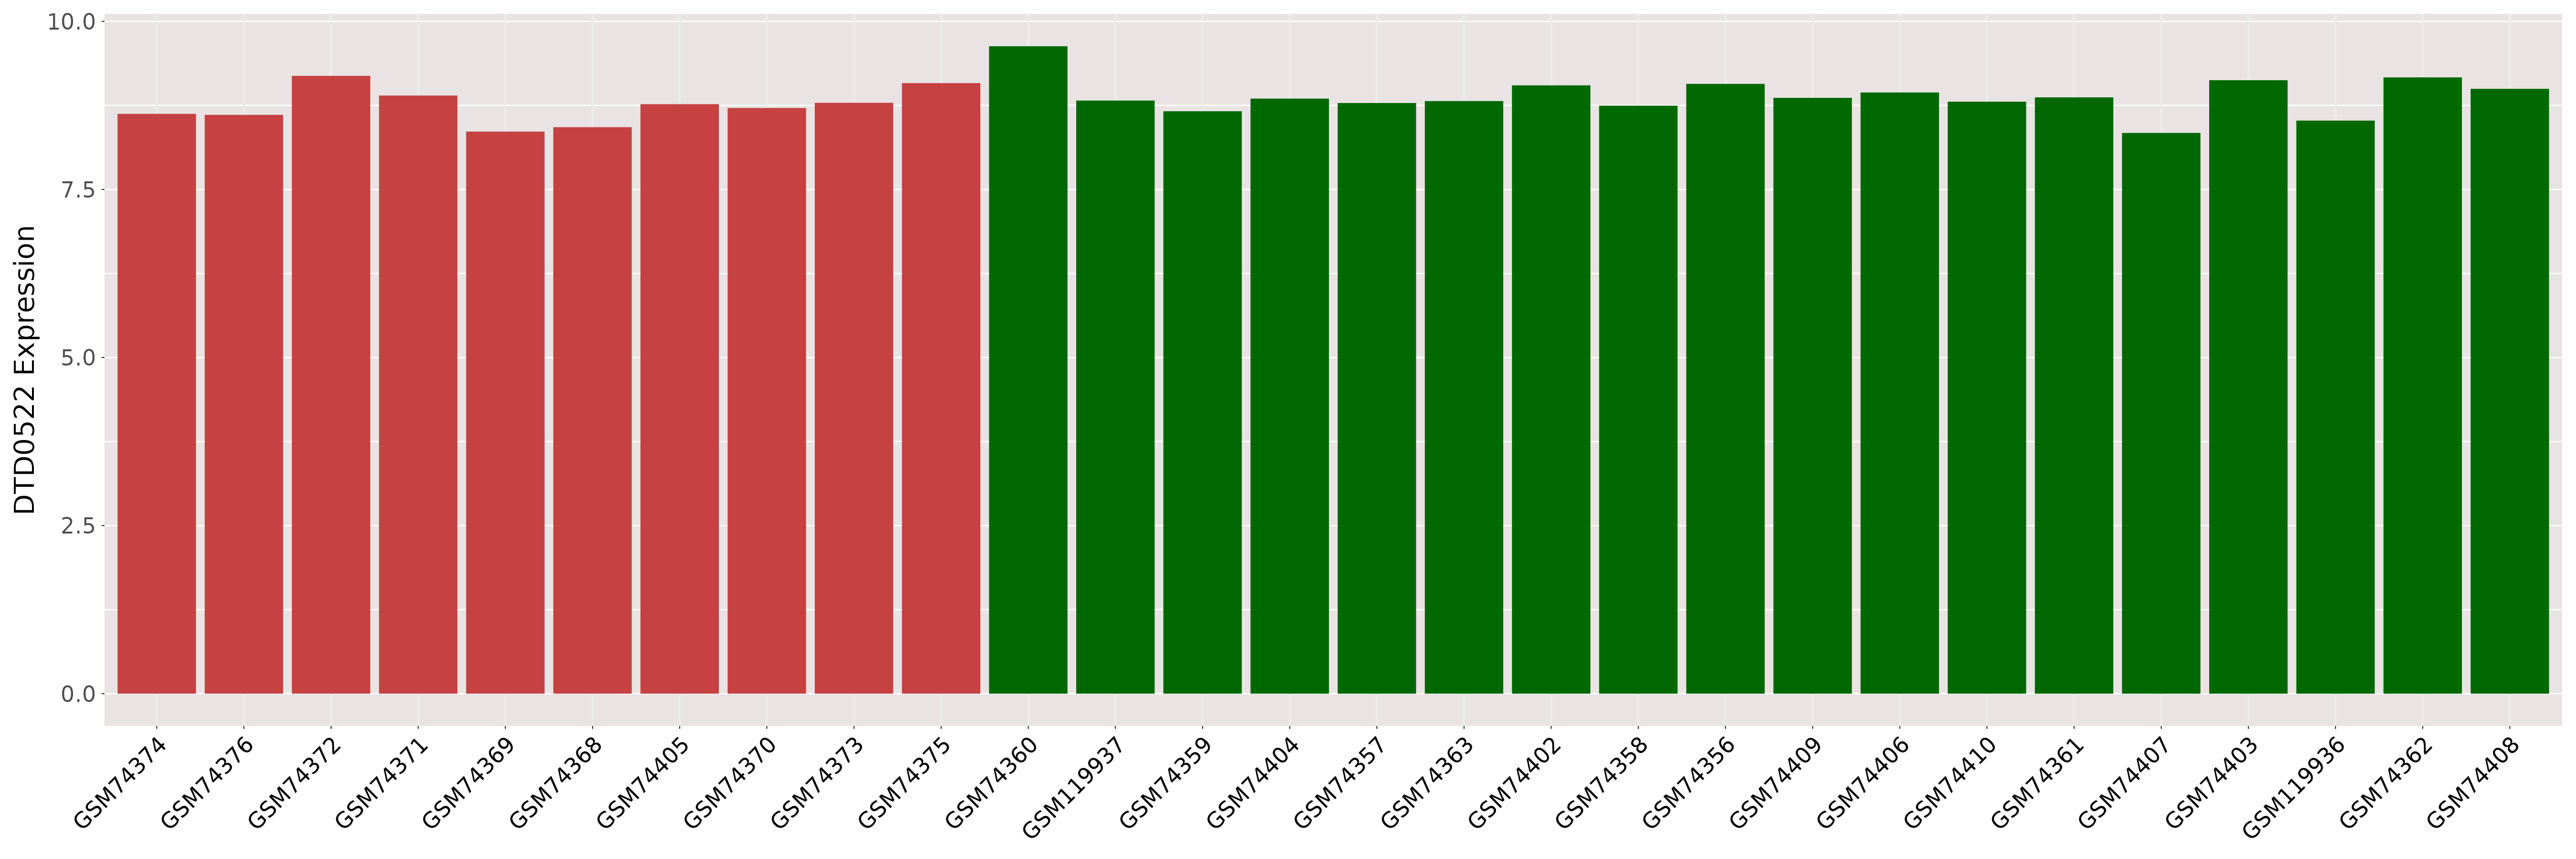
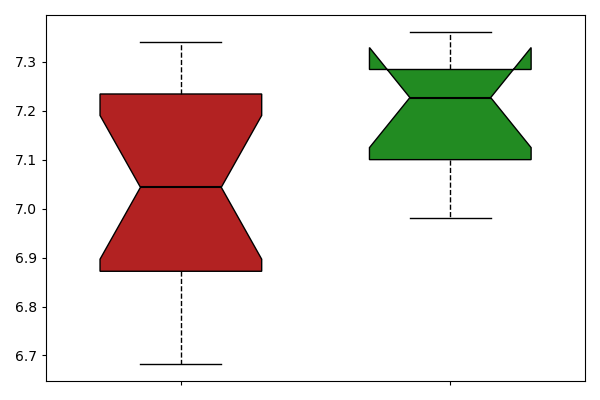
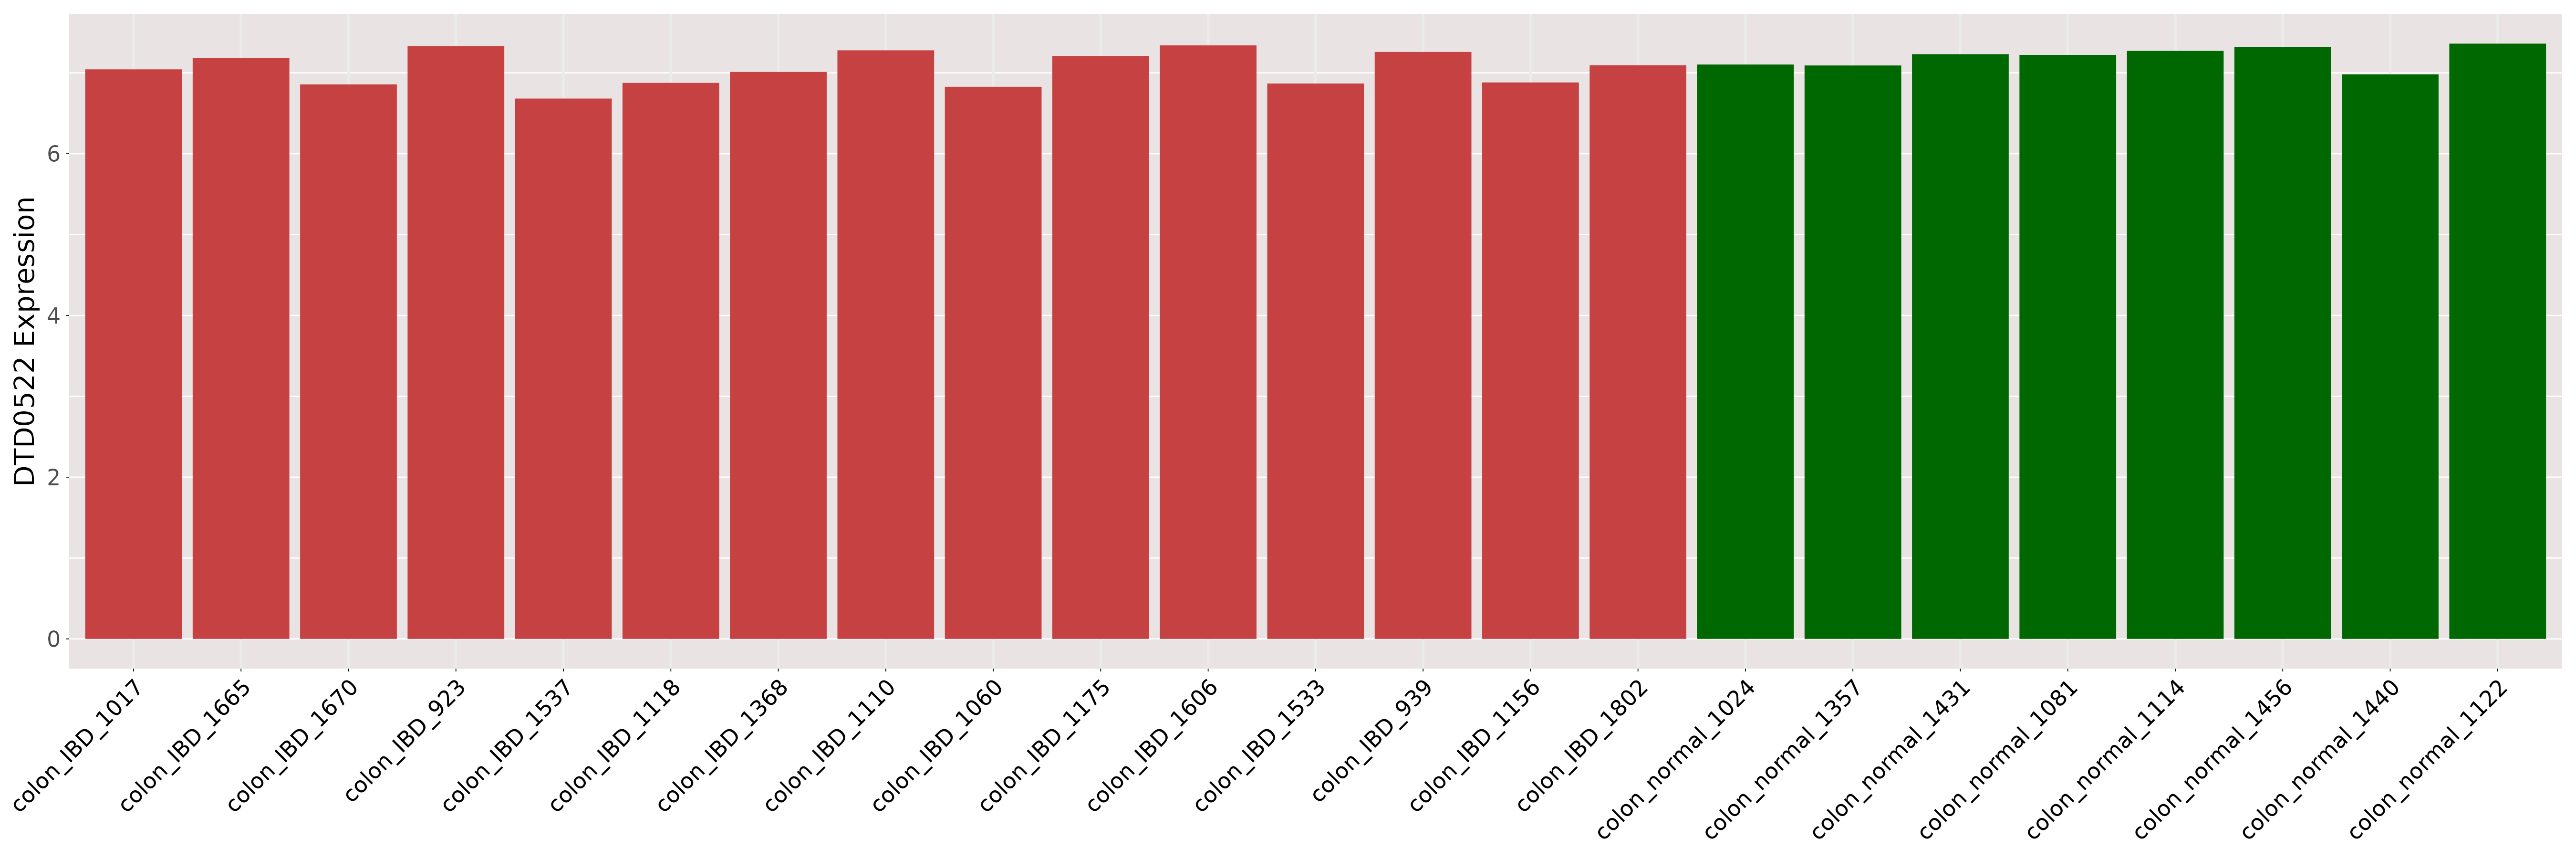
| [+] ICD-11: 2B91 Colorectal adenocarcinoma | Click to Show/Hide the Full List | ||||
| The Studied Tissue | Colon | ||||
| The Specified Disease | Colorectal adenocarcinoma [ICD-11:2B91] | ||||
| The Expression Level of Disease Section Compare with the Healthy Individual Tissue | p-value:0.616746494106609; Fold-change:0.9629917604506416; Z-score:-0.179015275 | ||||
| DT expression in the diseased tissue of patients
DT expression in the normal tissue of healthy individuals
|
|||||
|
 Please Click the above Thumbnail to View/Download
the Expression Barchart for All Samples Please Click the above Thumbnail to View/Download
the Expression Barchart for All Samples
|
||||
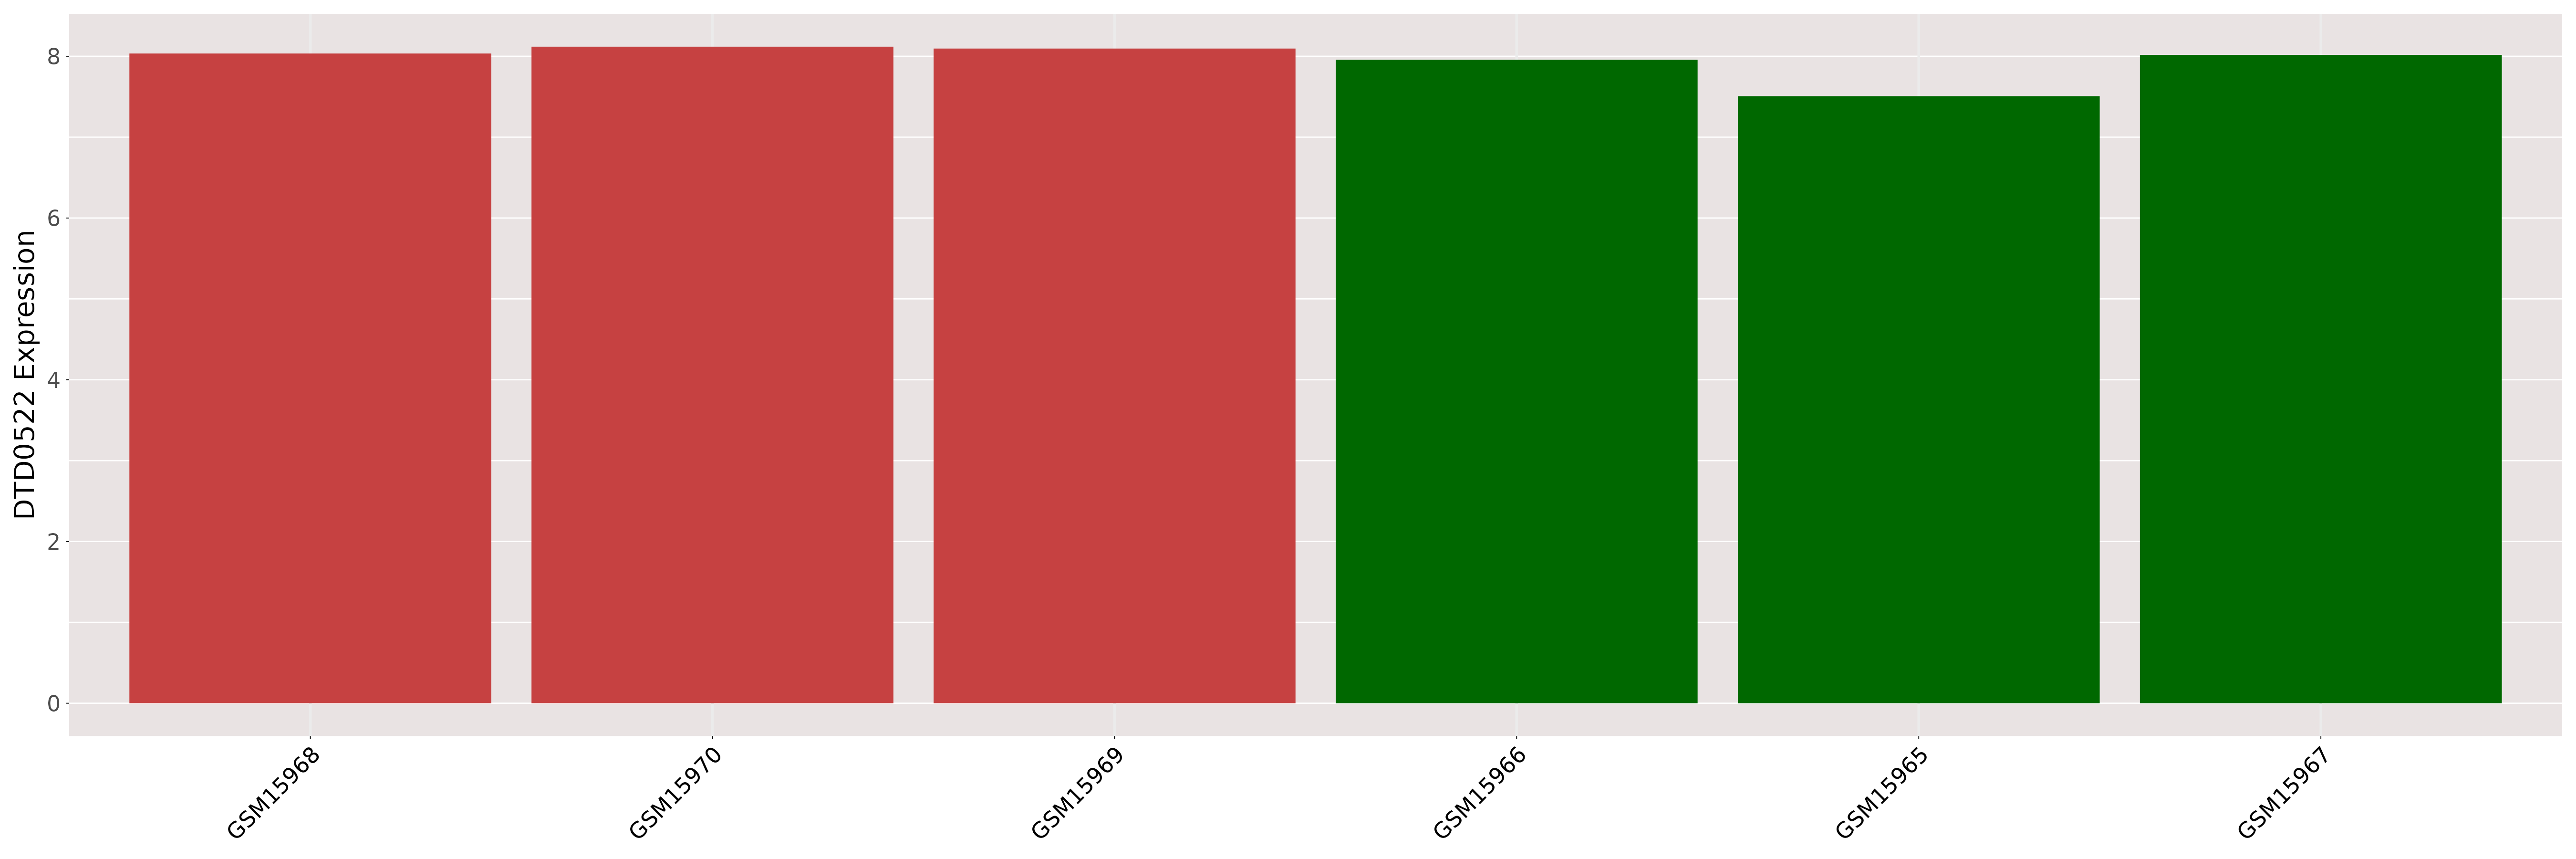
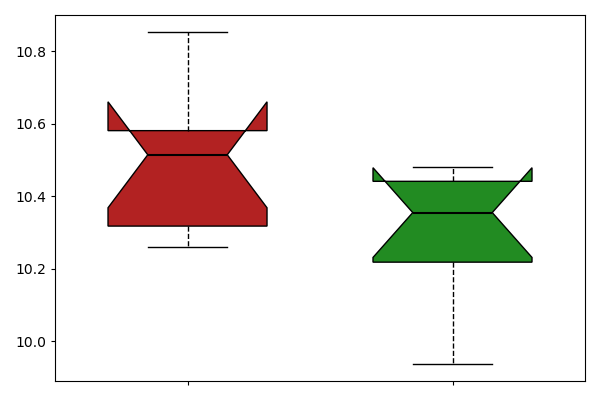
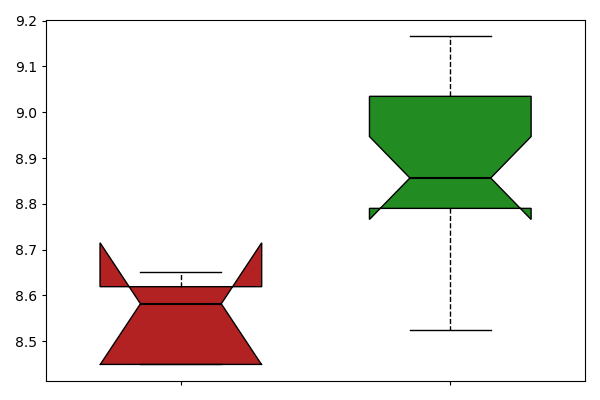
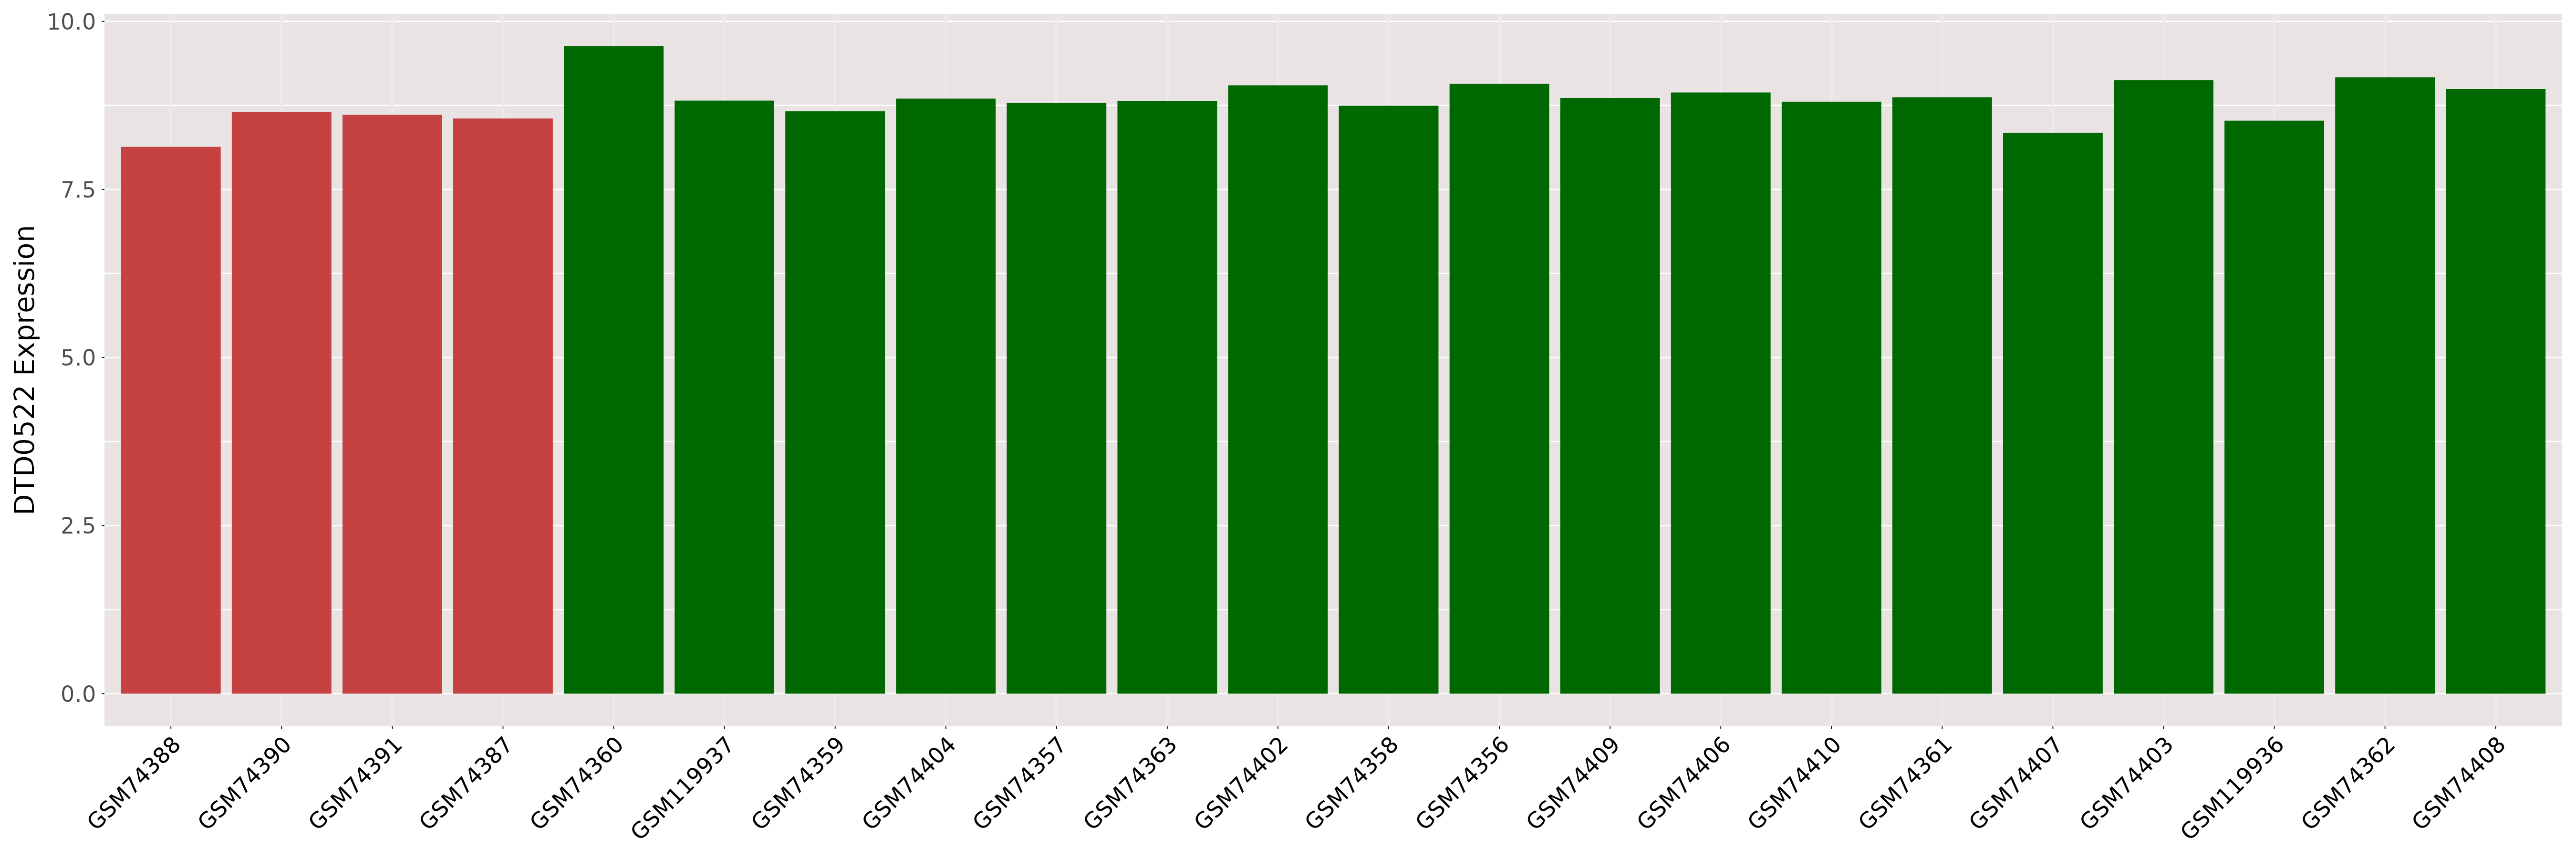
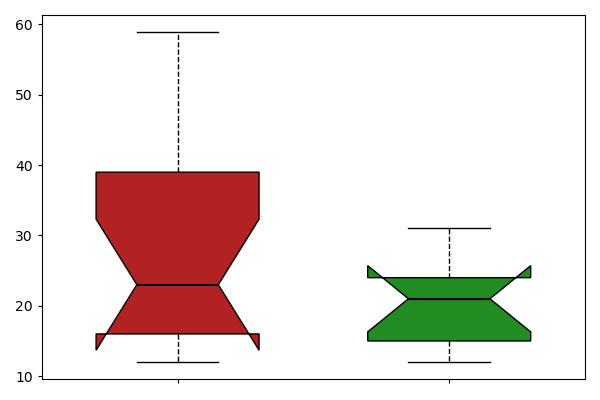
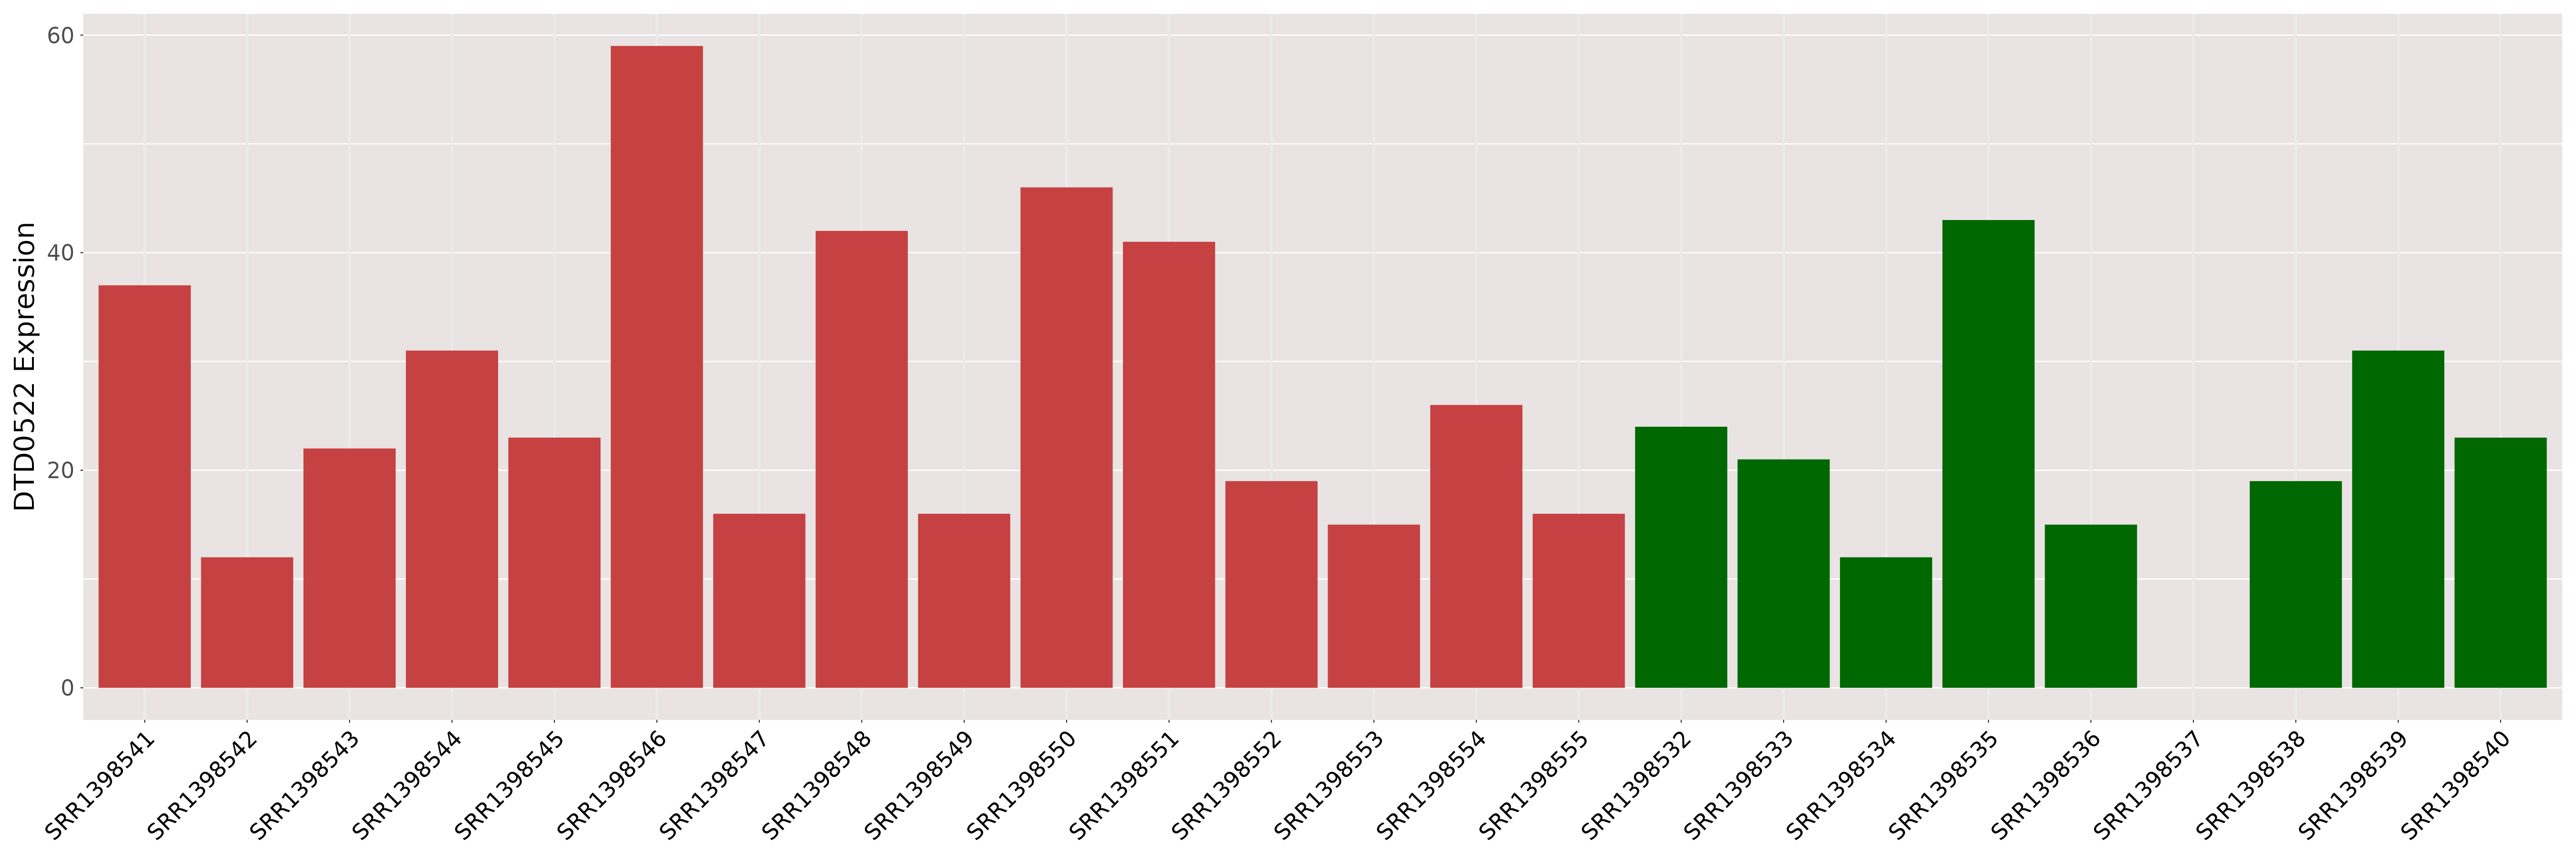
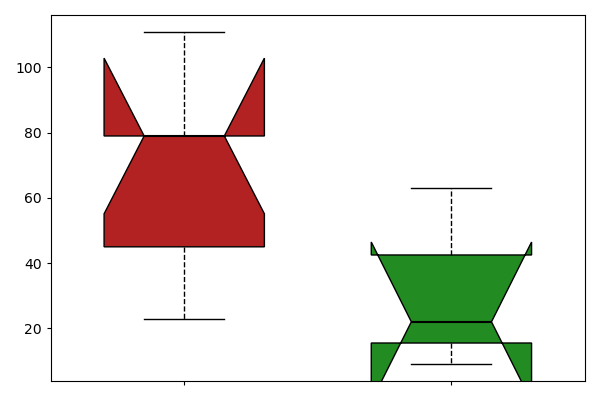
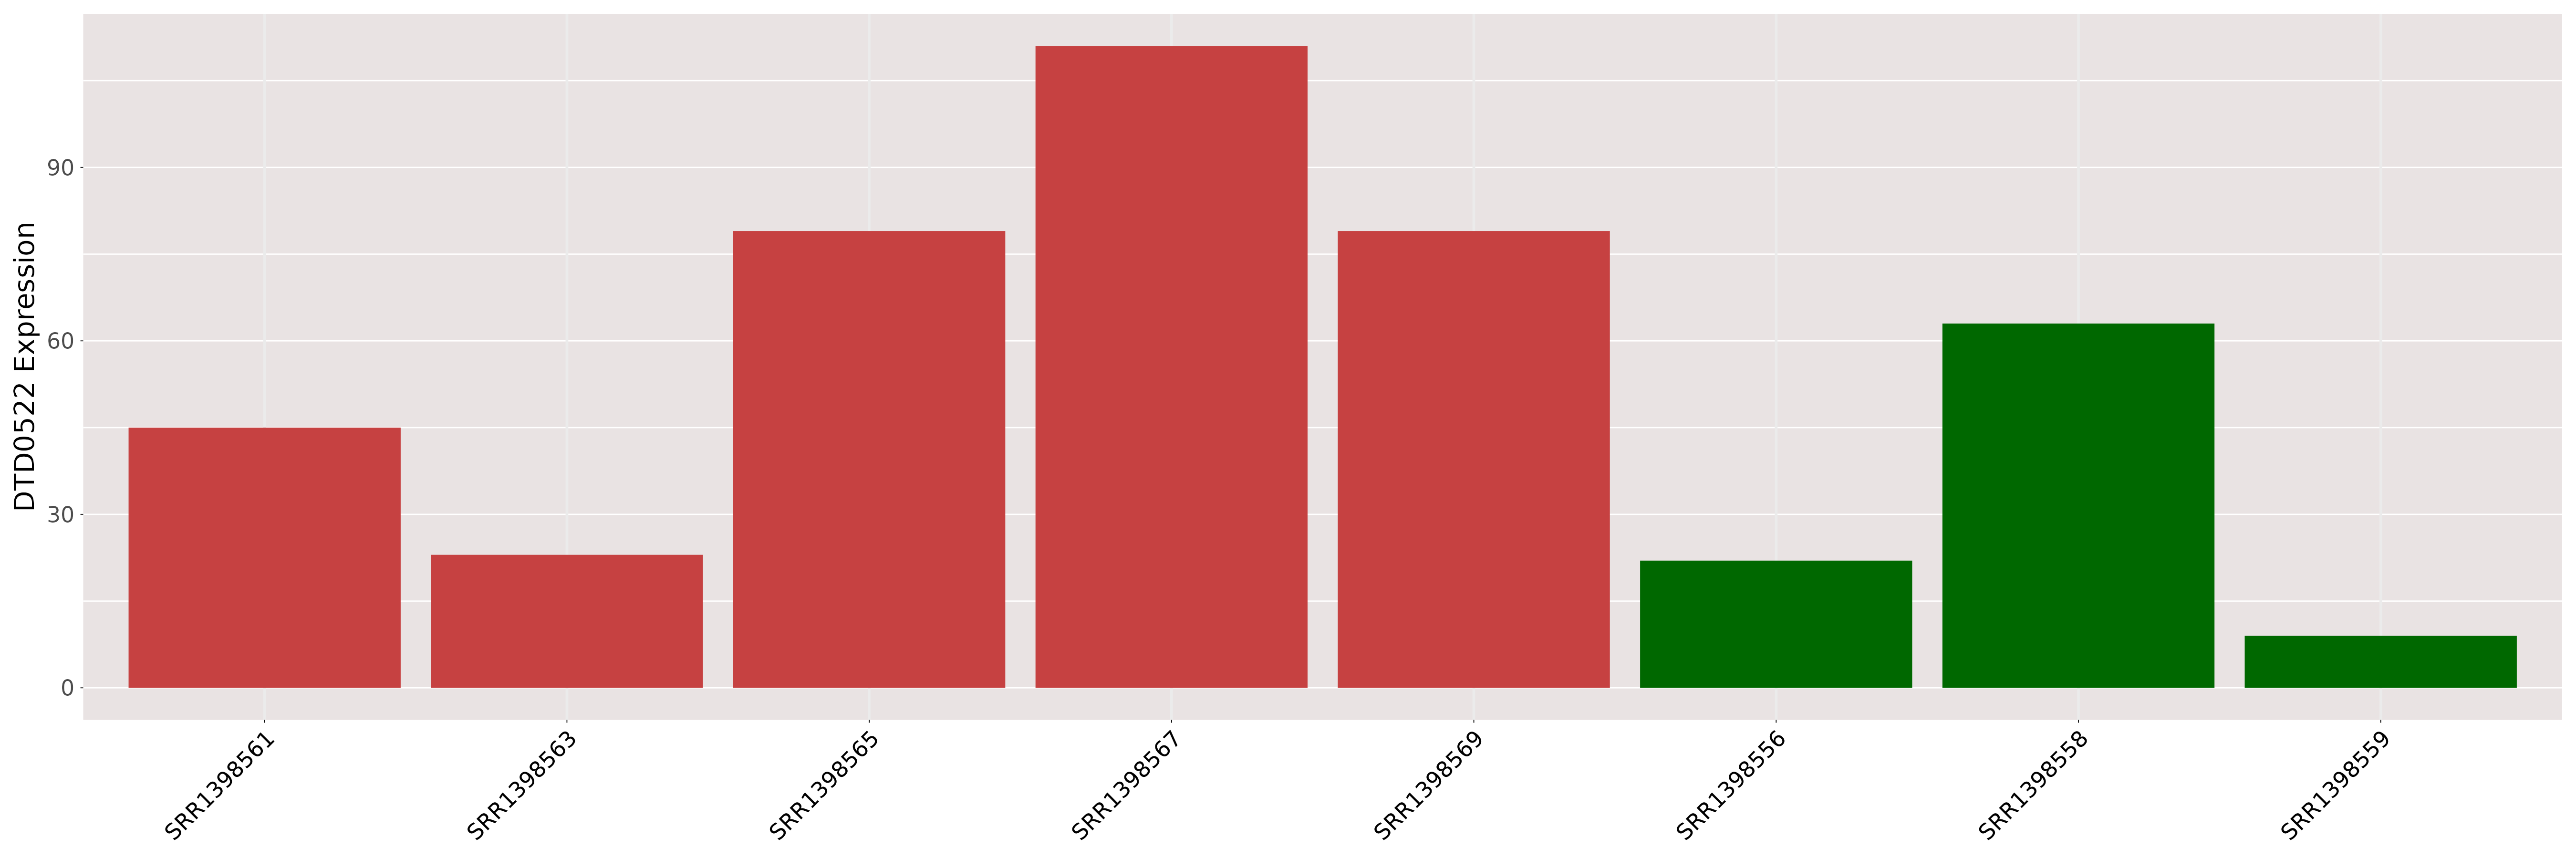
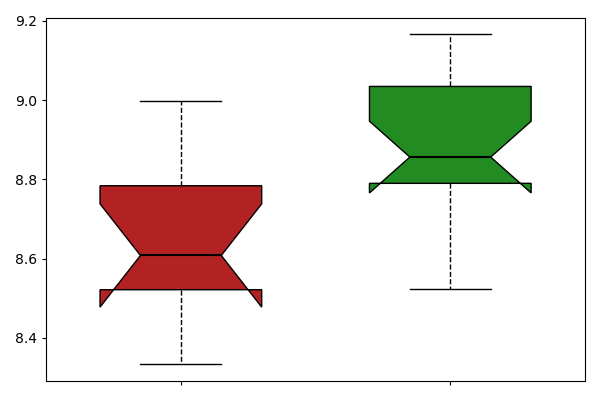
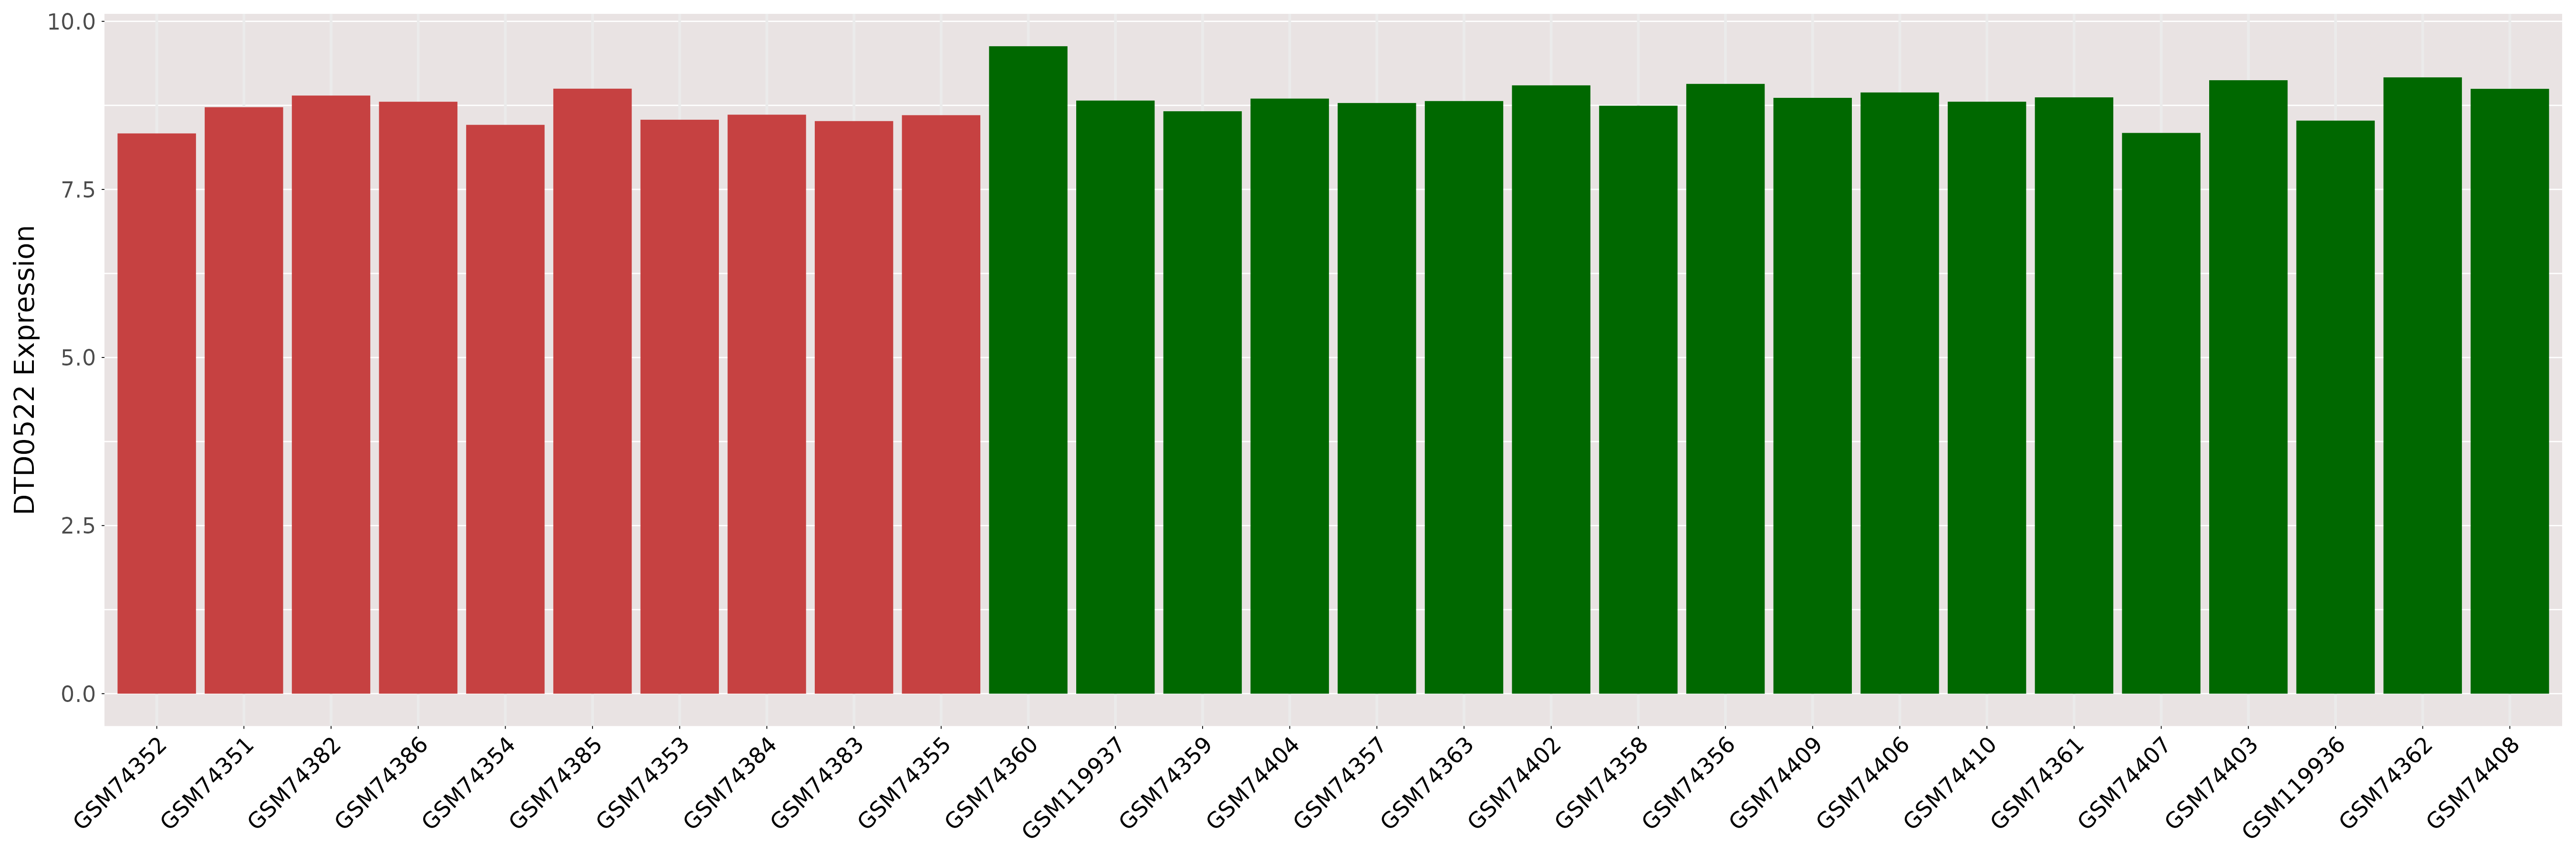
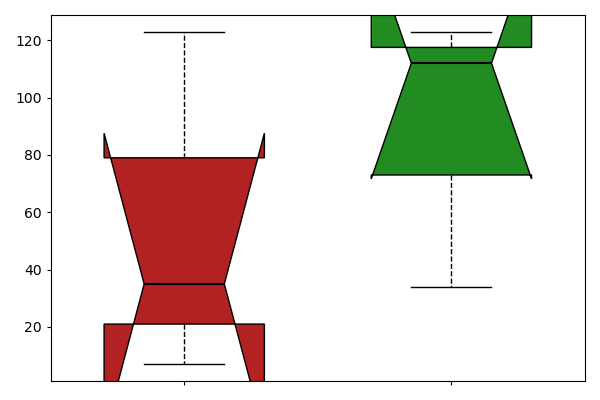
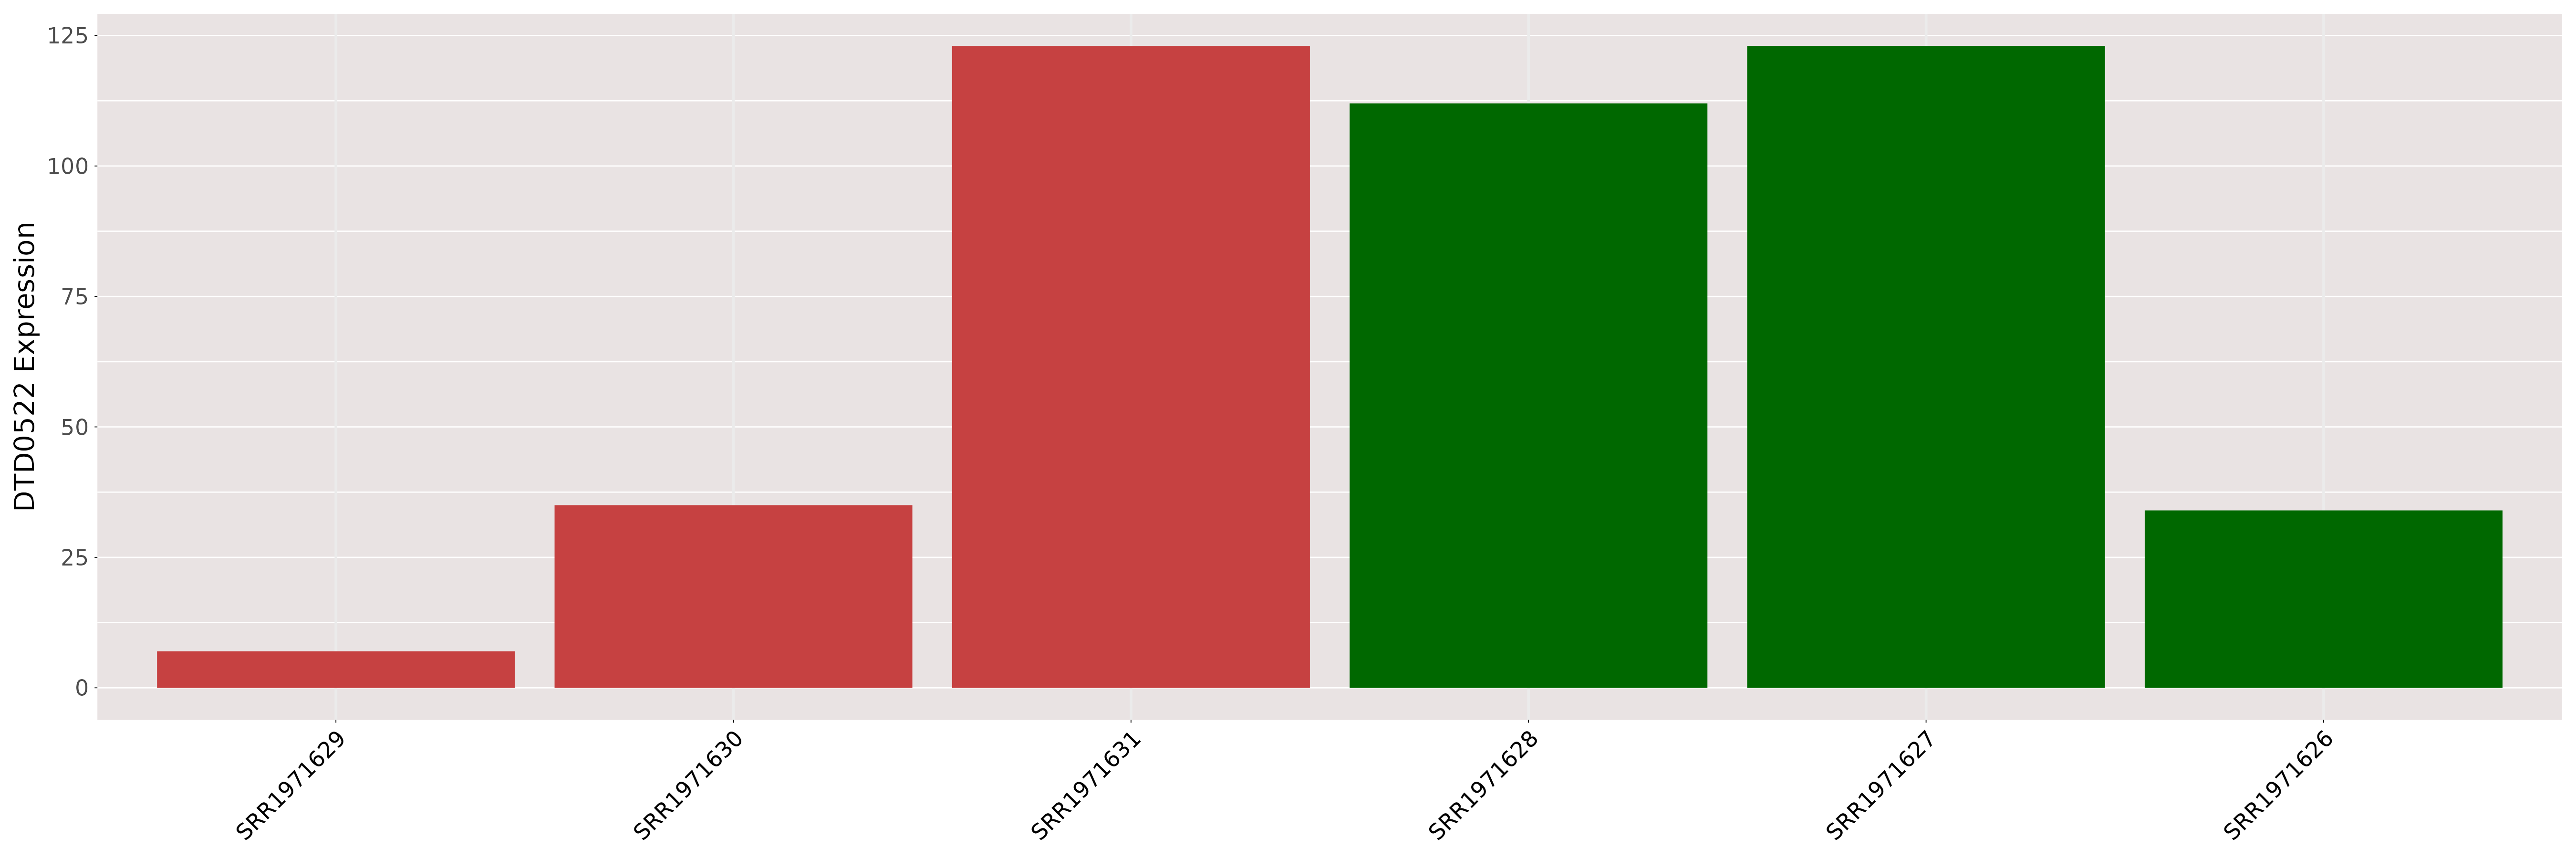
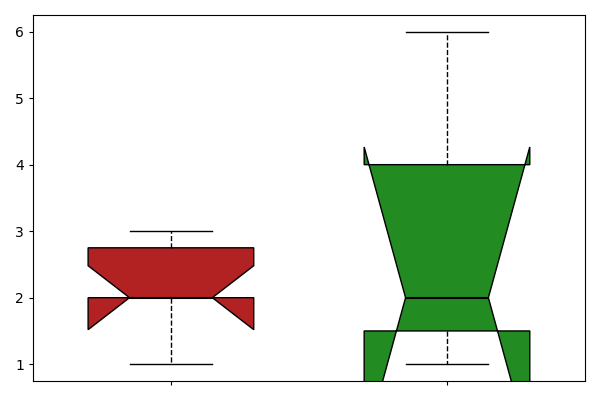
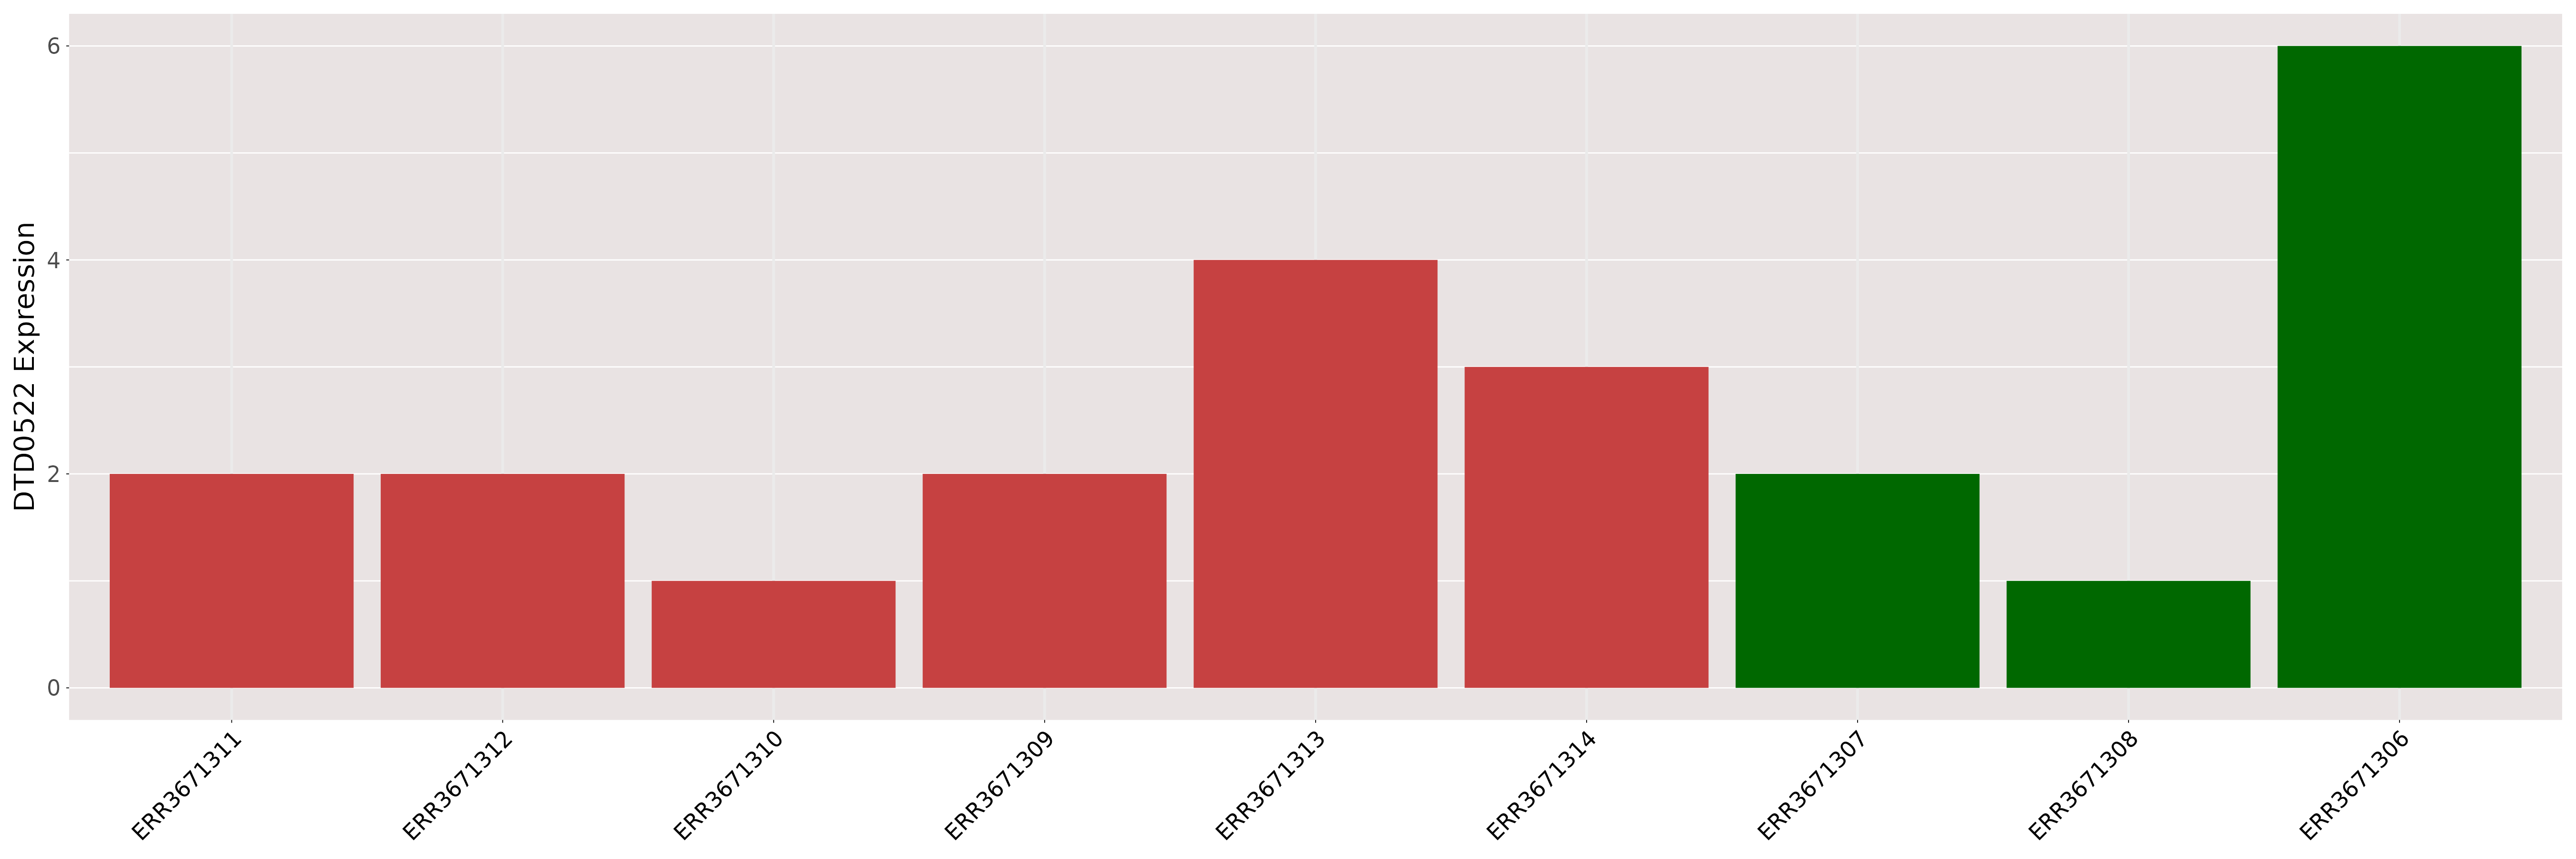
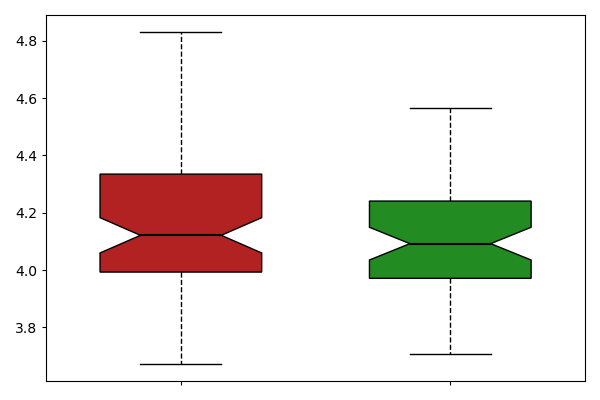
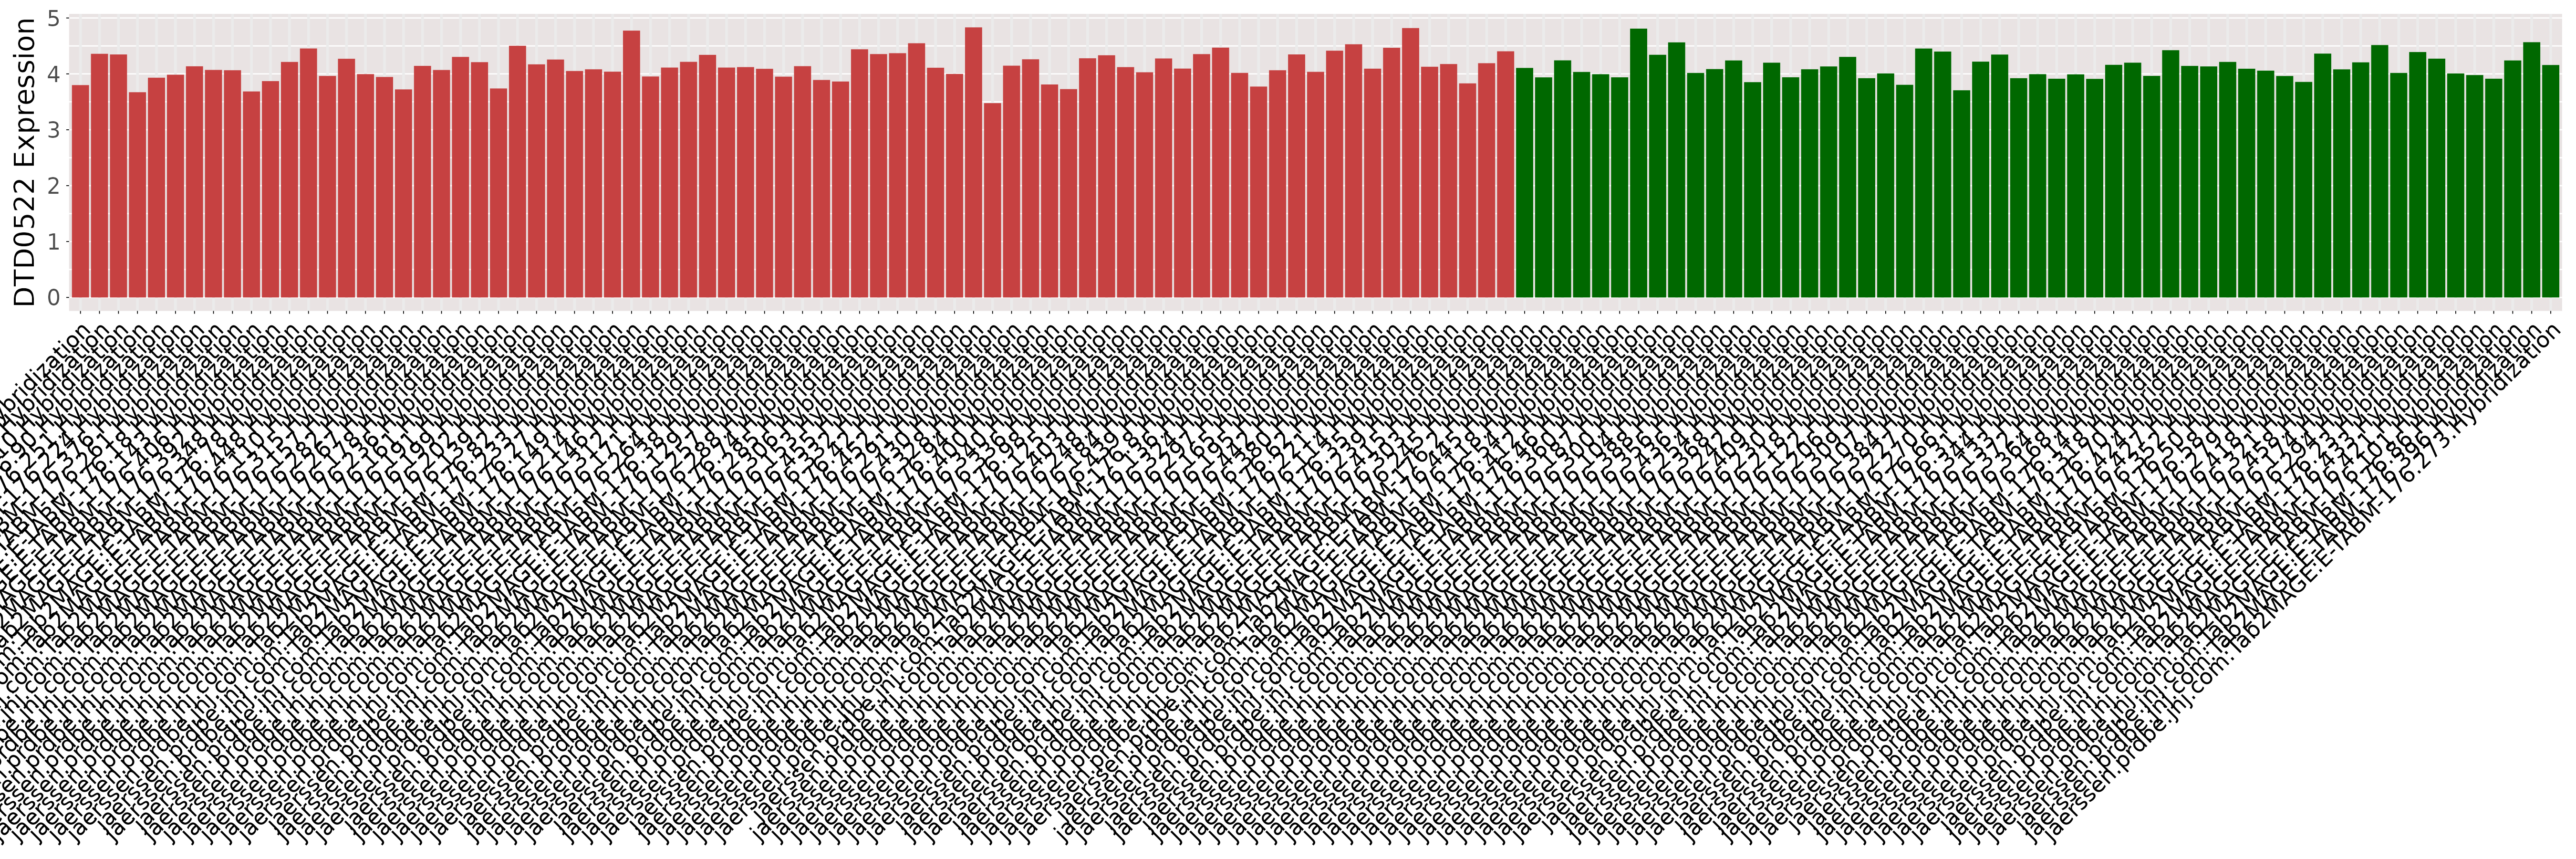
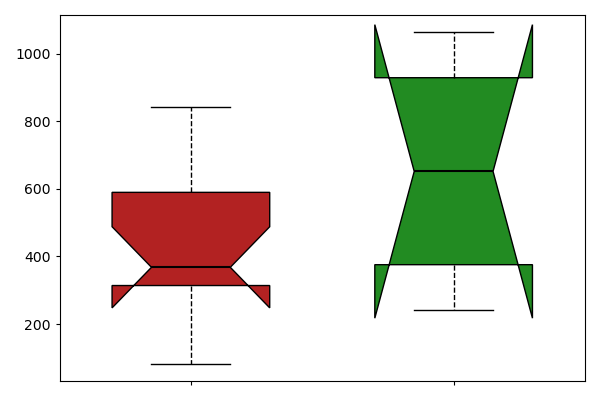
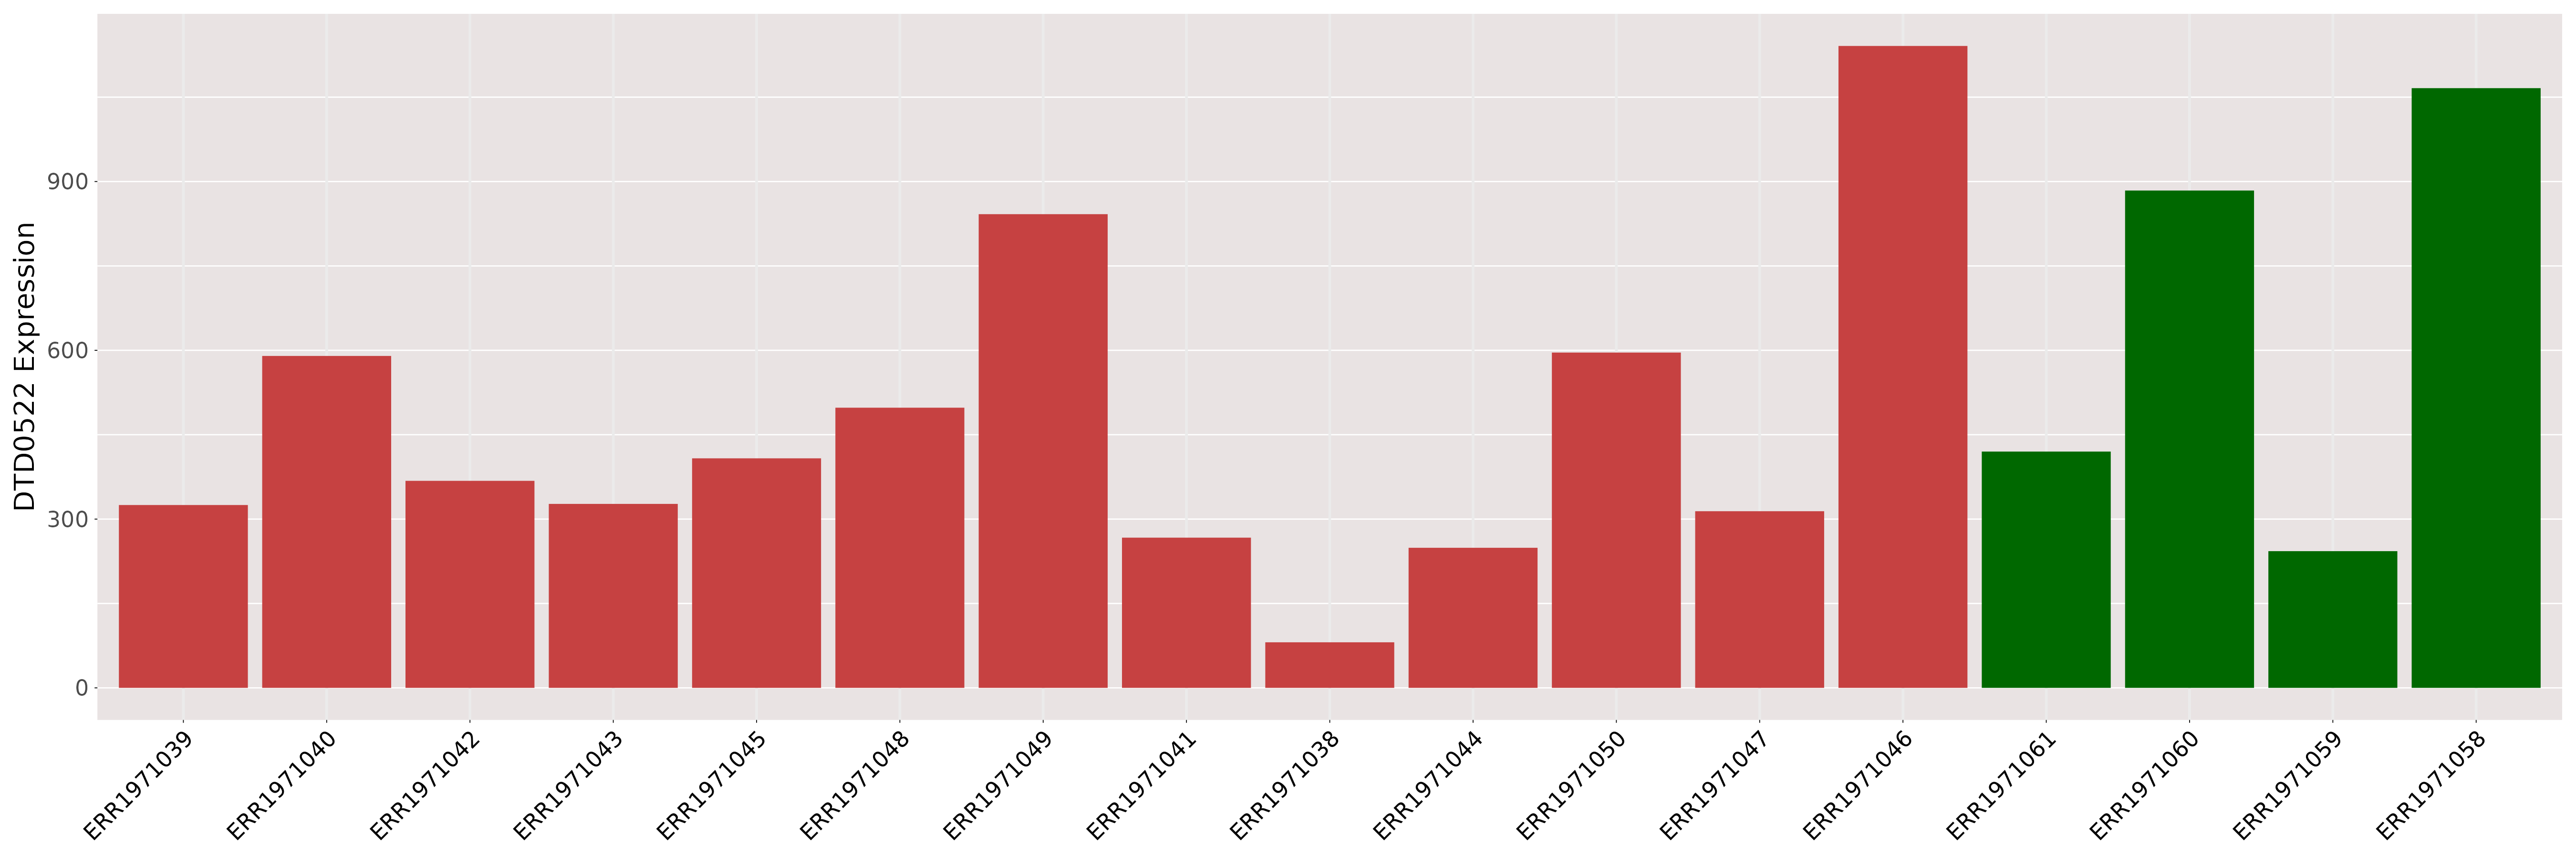
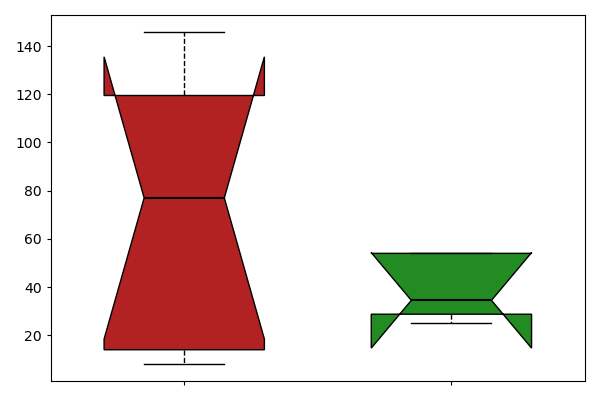
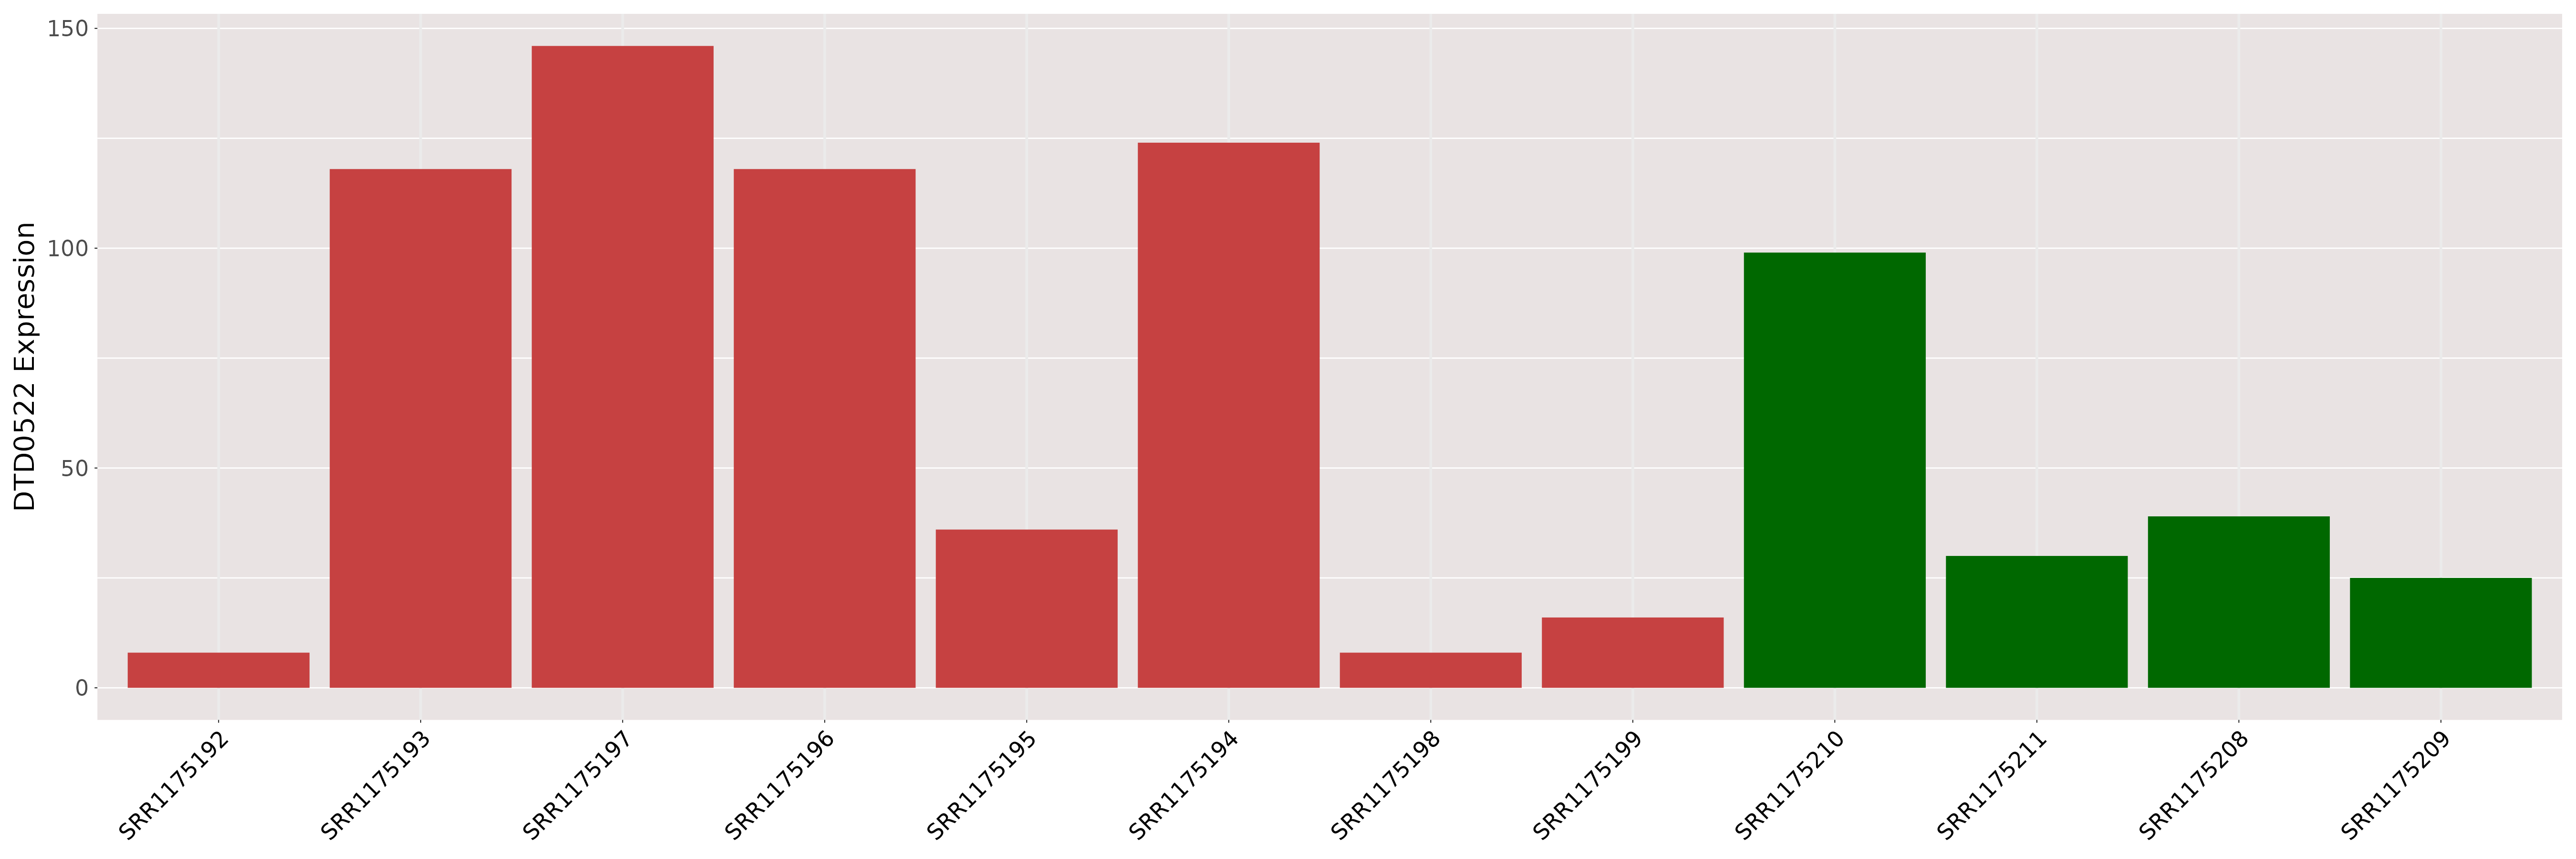
| [+] ICD-11: 2B91 Colorectal carcinoma (colorectal cancer) | Click to Show/Hide the Full List | ||||
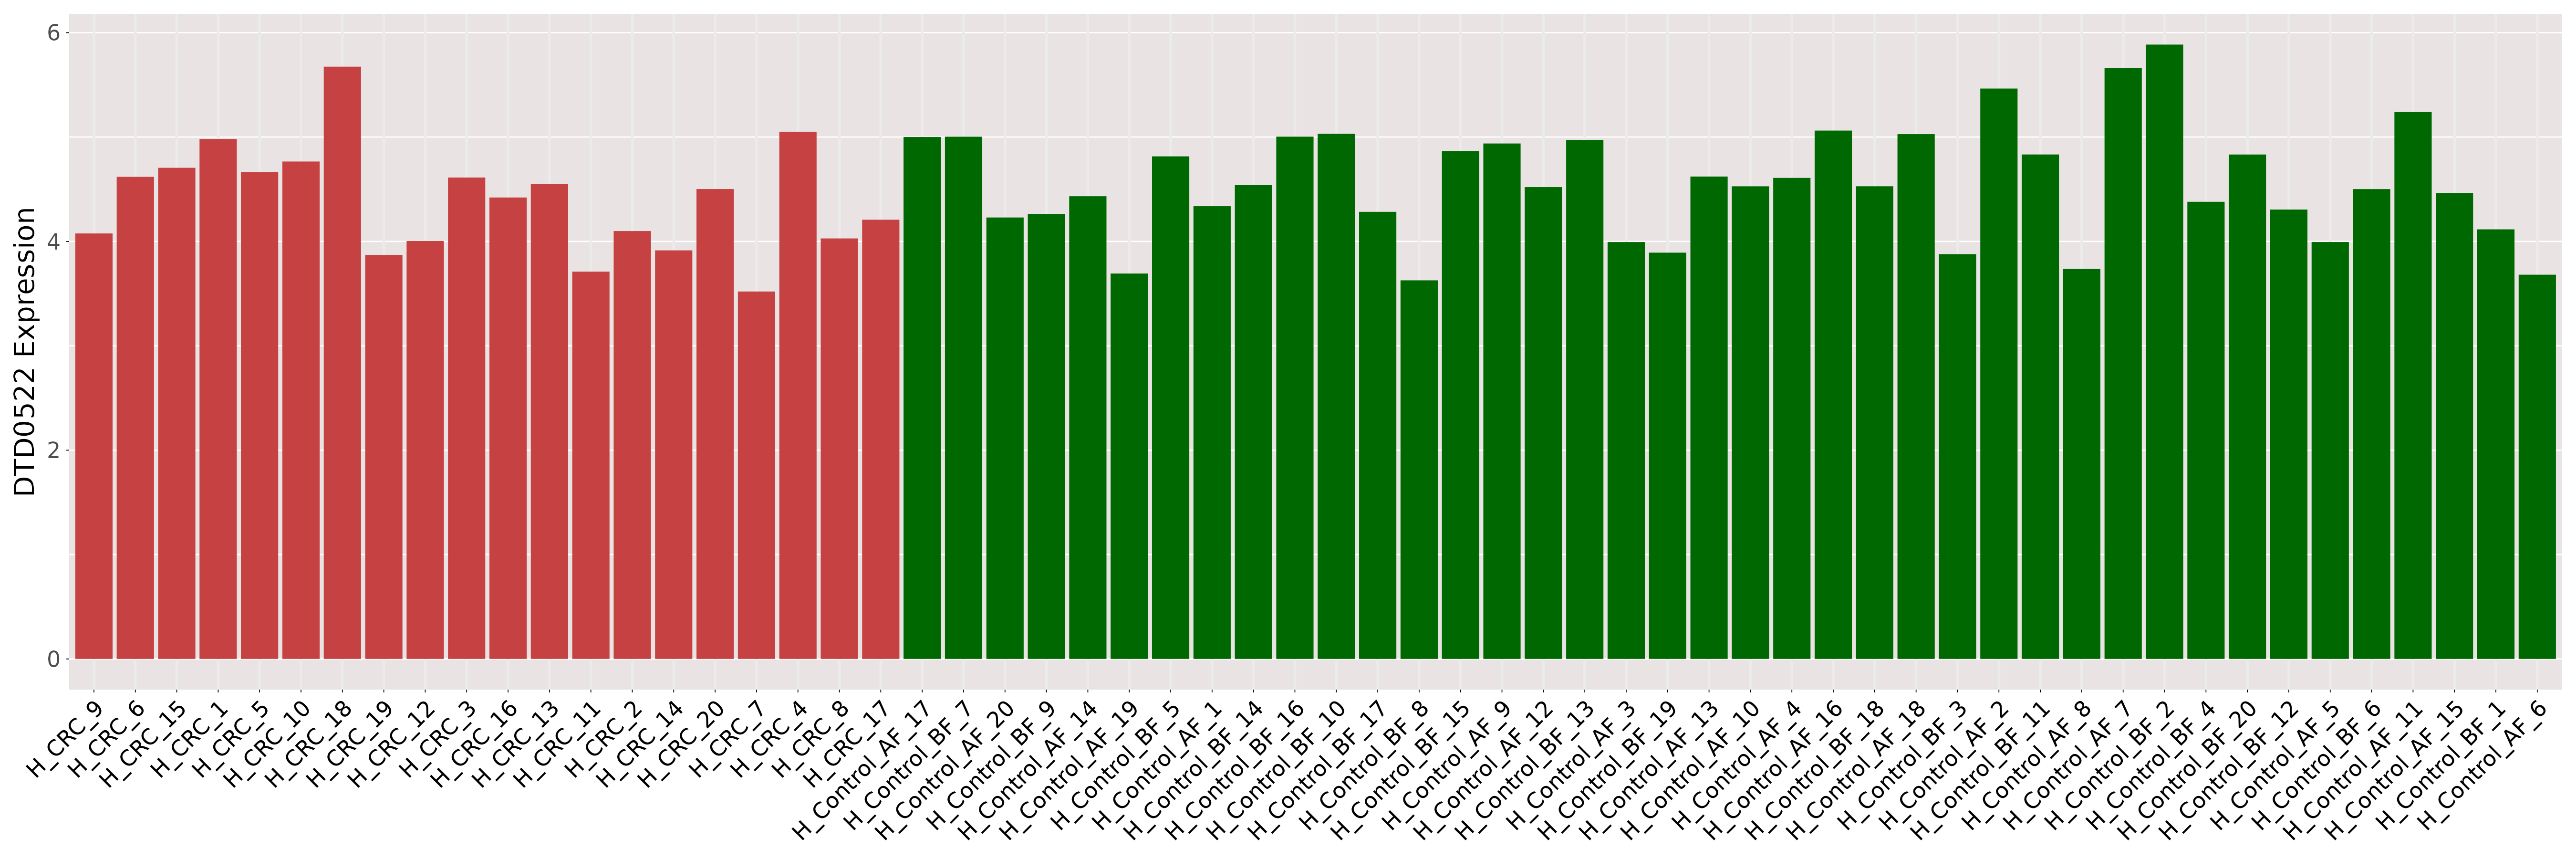
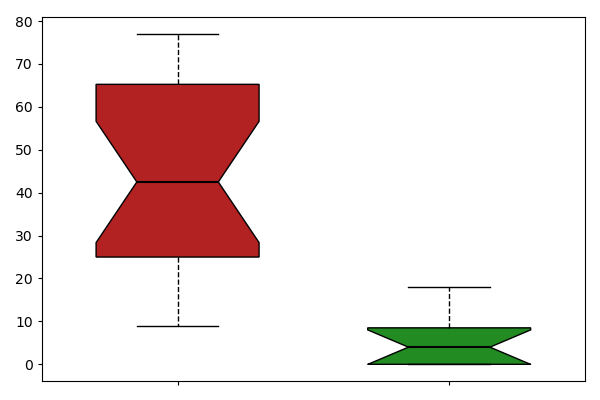
| The Studied Tissue | Blood | ||||
| The Specified Disease | Colorectal cancer [ICD-11:2B91] | ||||
| The Expression Level of Disease Section Compare with the Healthy Individual Tissue | p-value:0.2479101722097953; Fold-change:0.985251933146829; Z-score:-0.315237812 | ||||
| DT expression in the diseased tissue of patients
DT expression in the normal tissue of healthy individuals
|
|||||
|
 Please Click the above Thumbnail to View/Download
the Expression Barchart for All Samples Please Click the above Thumbnail to View/Download
the Expression Barchart for All Samples
|
||||
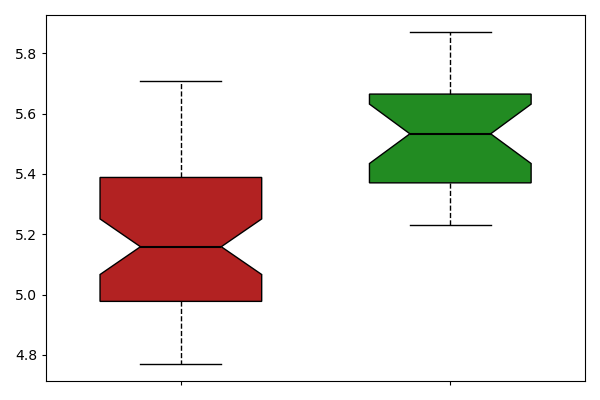
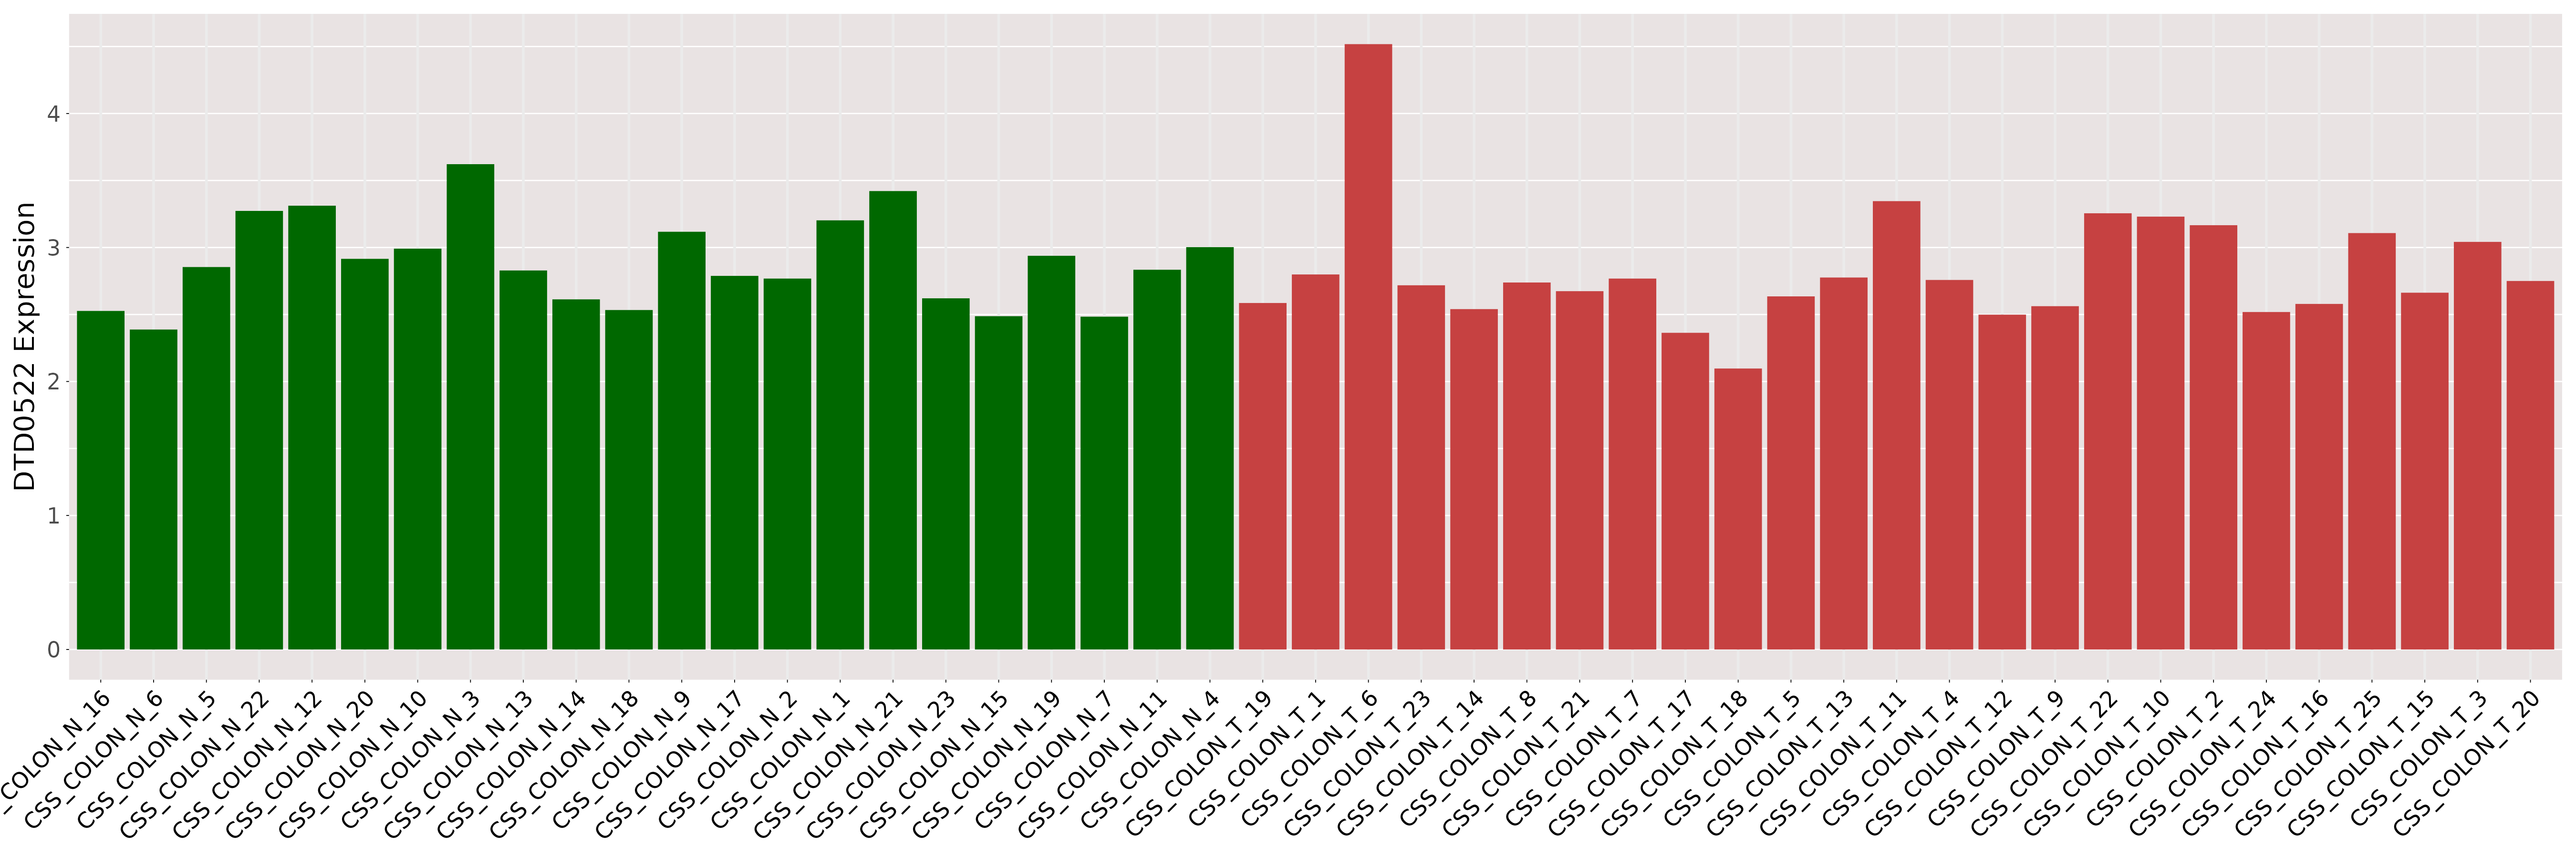
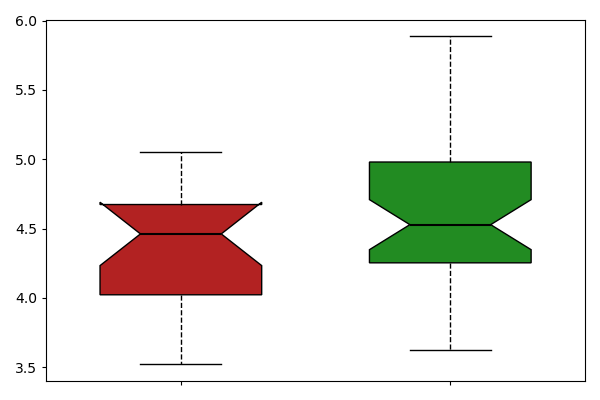
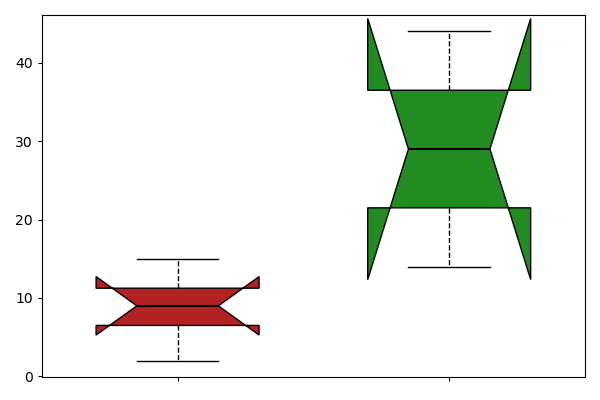
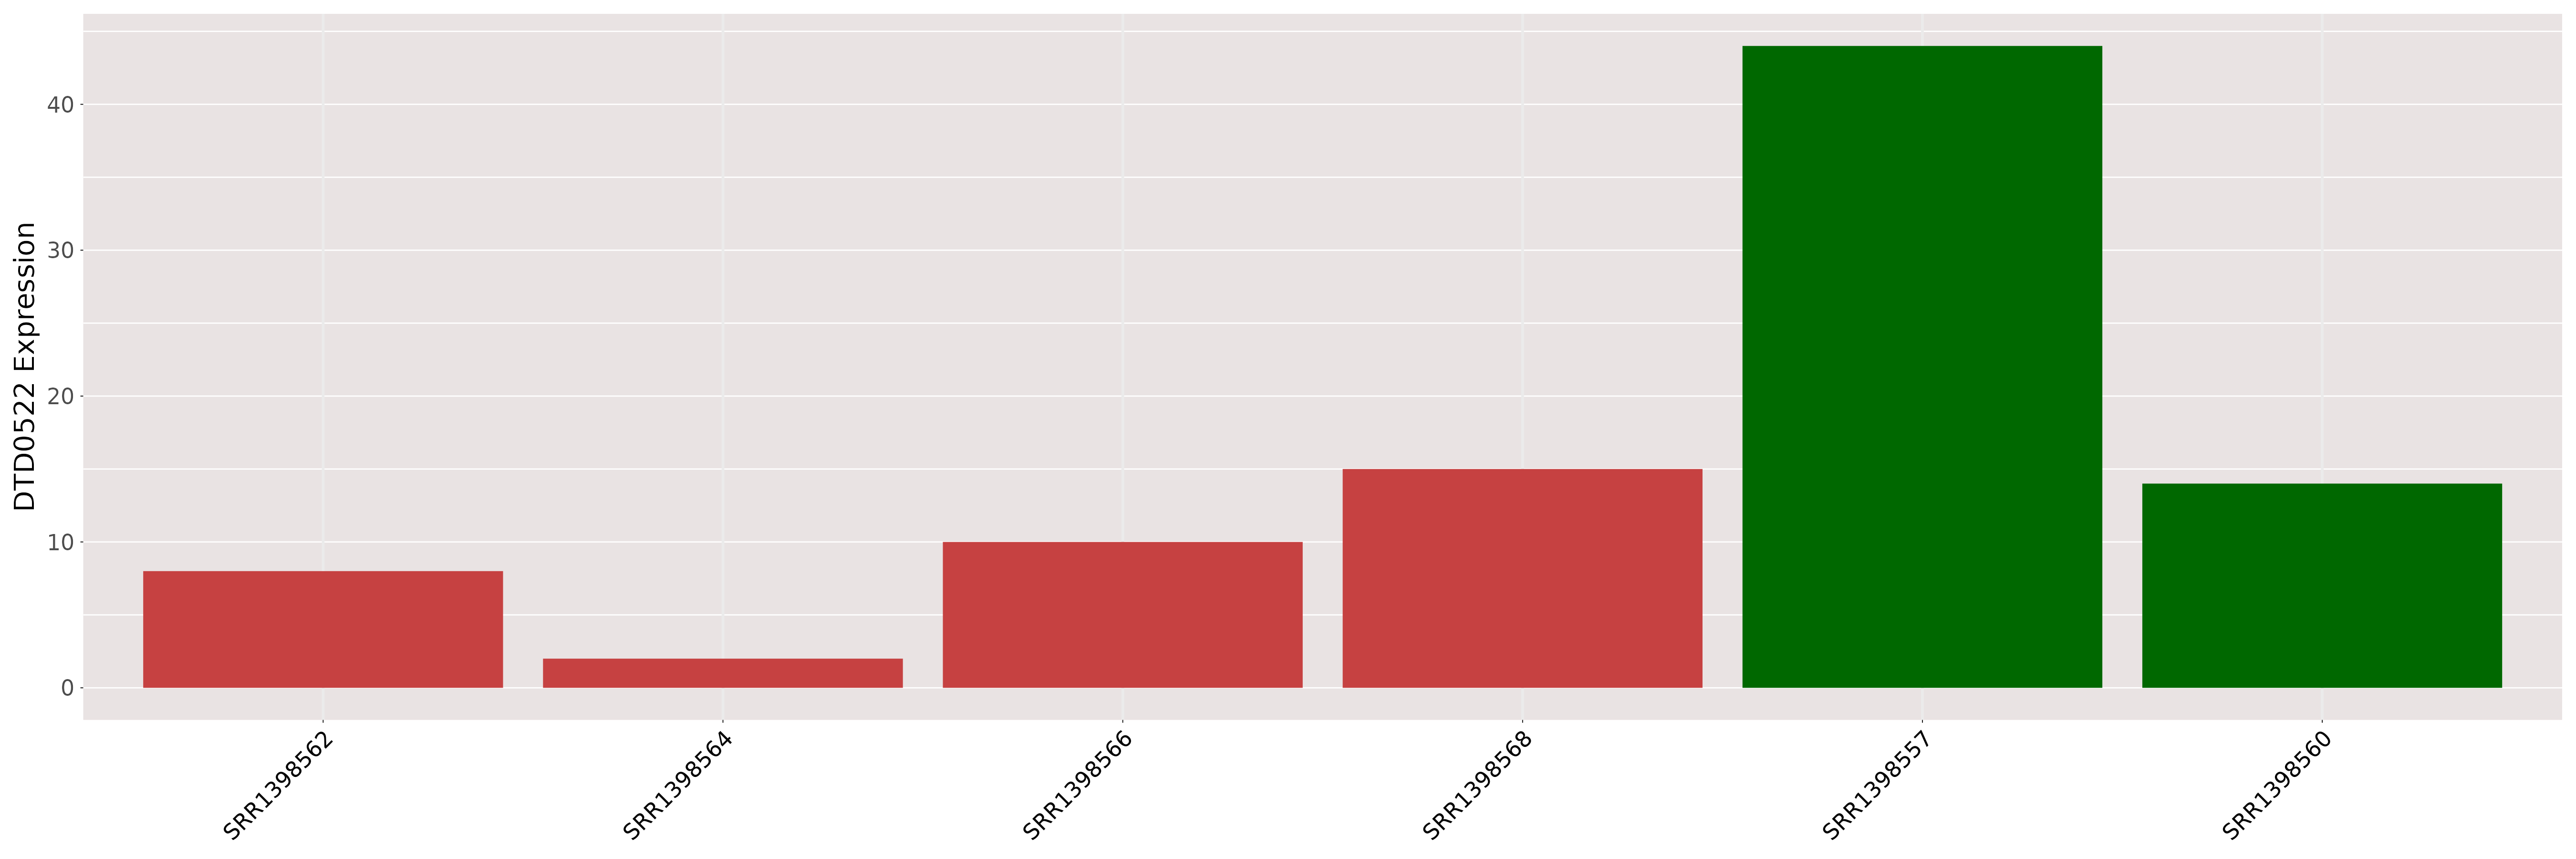
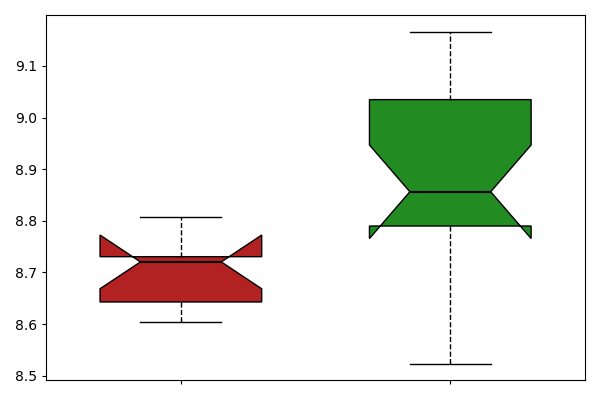
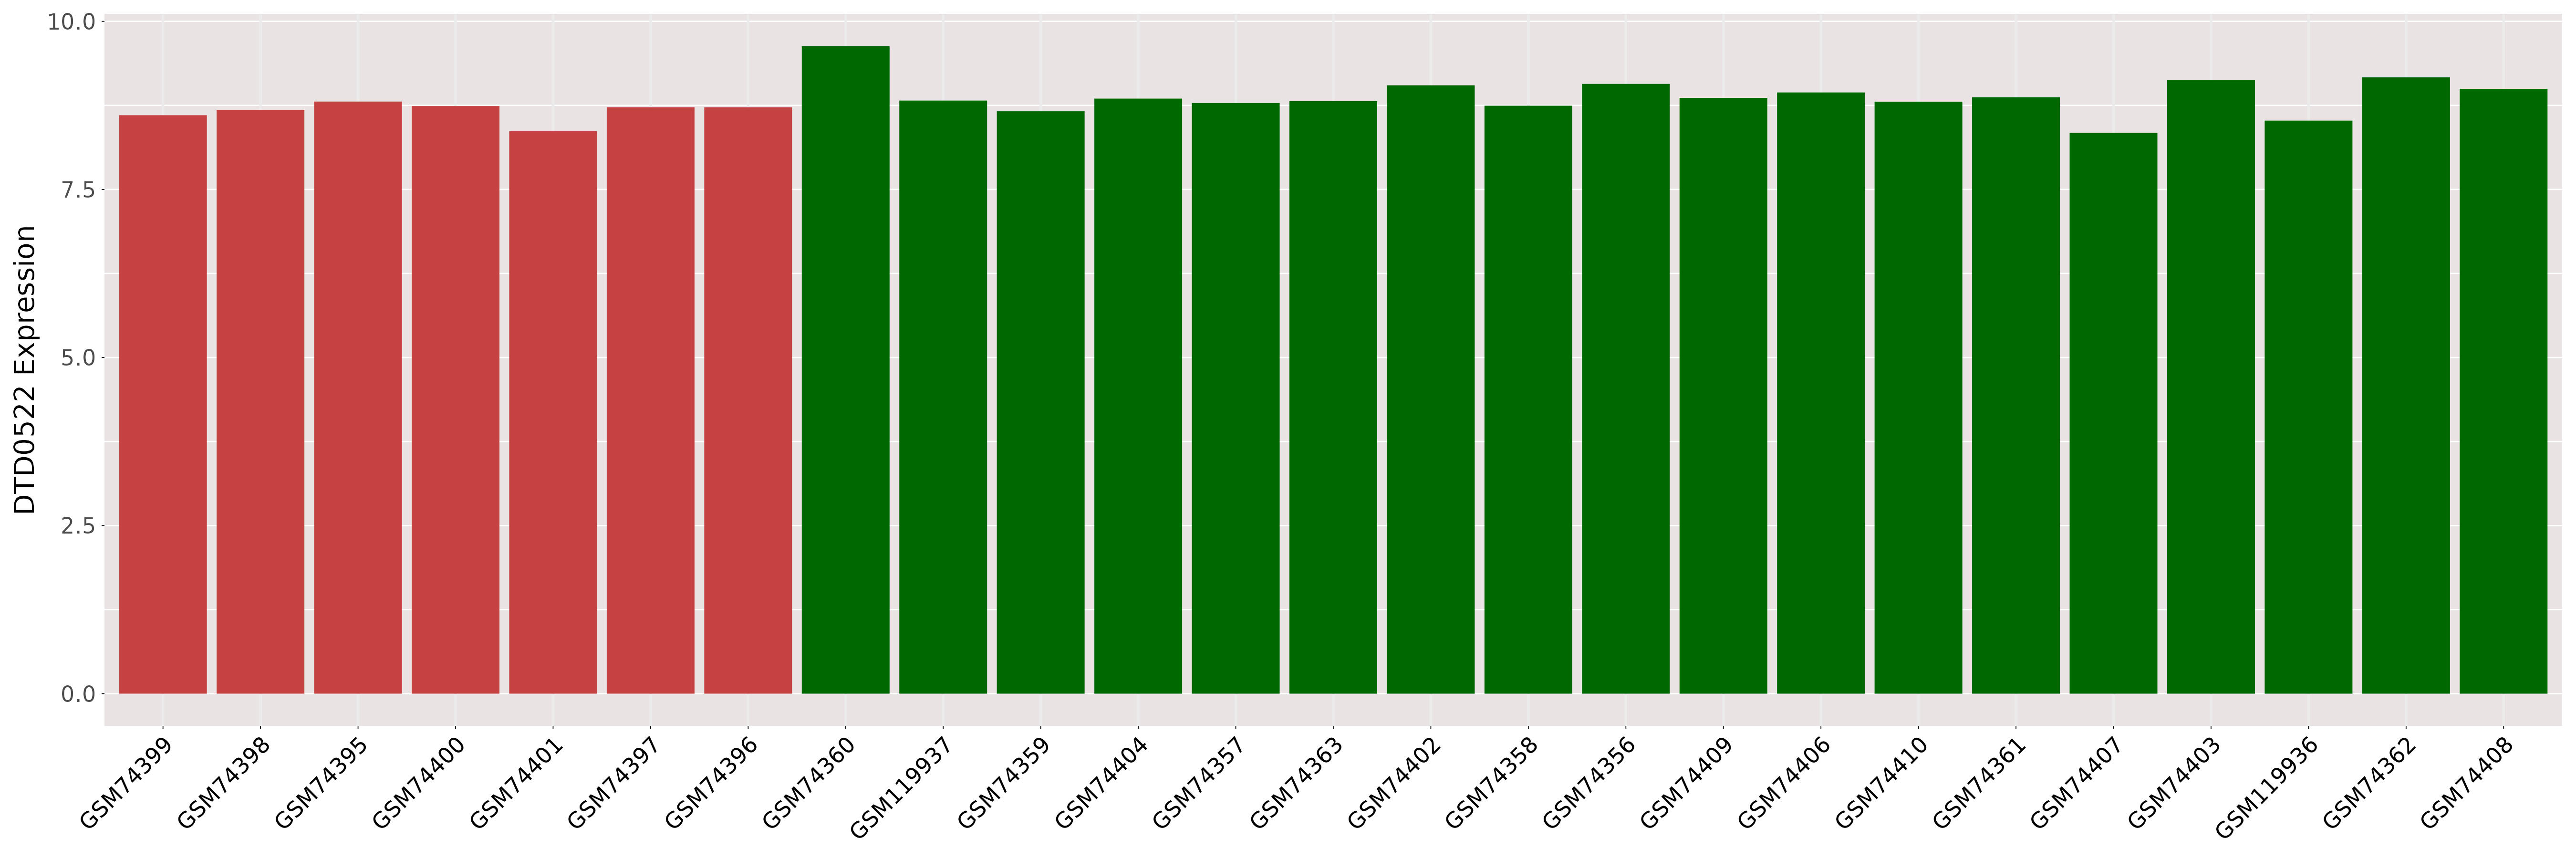
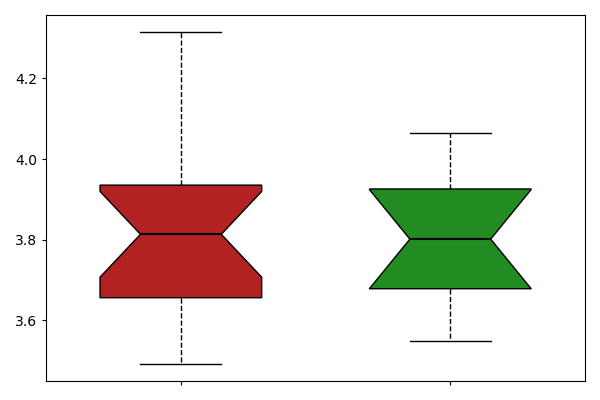
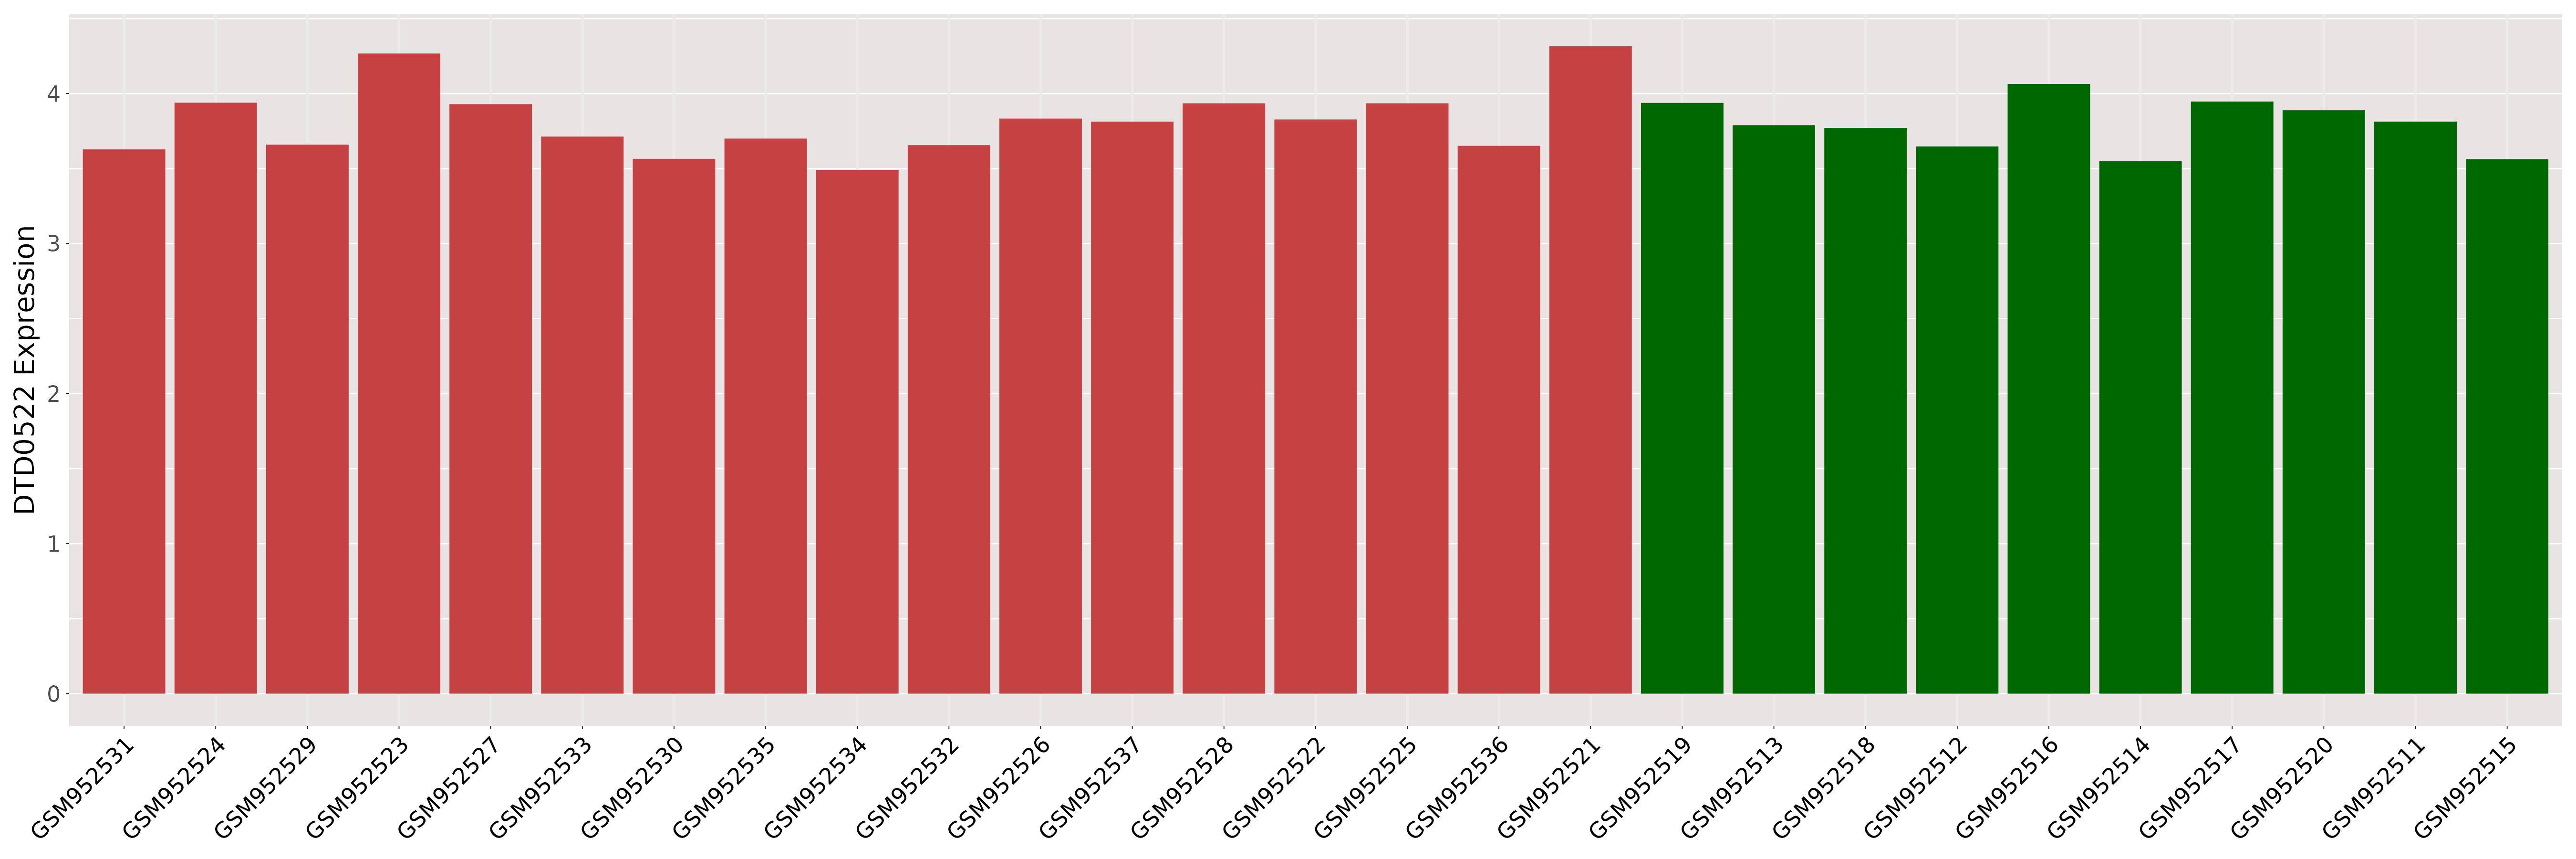
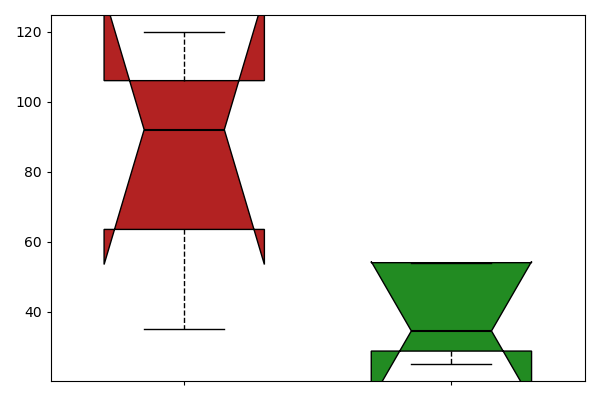
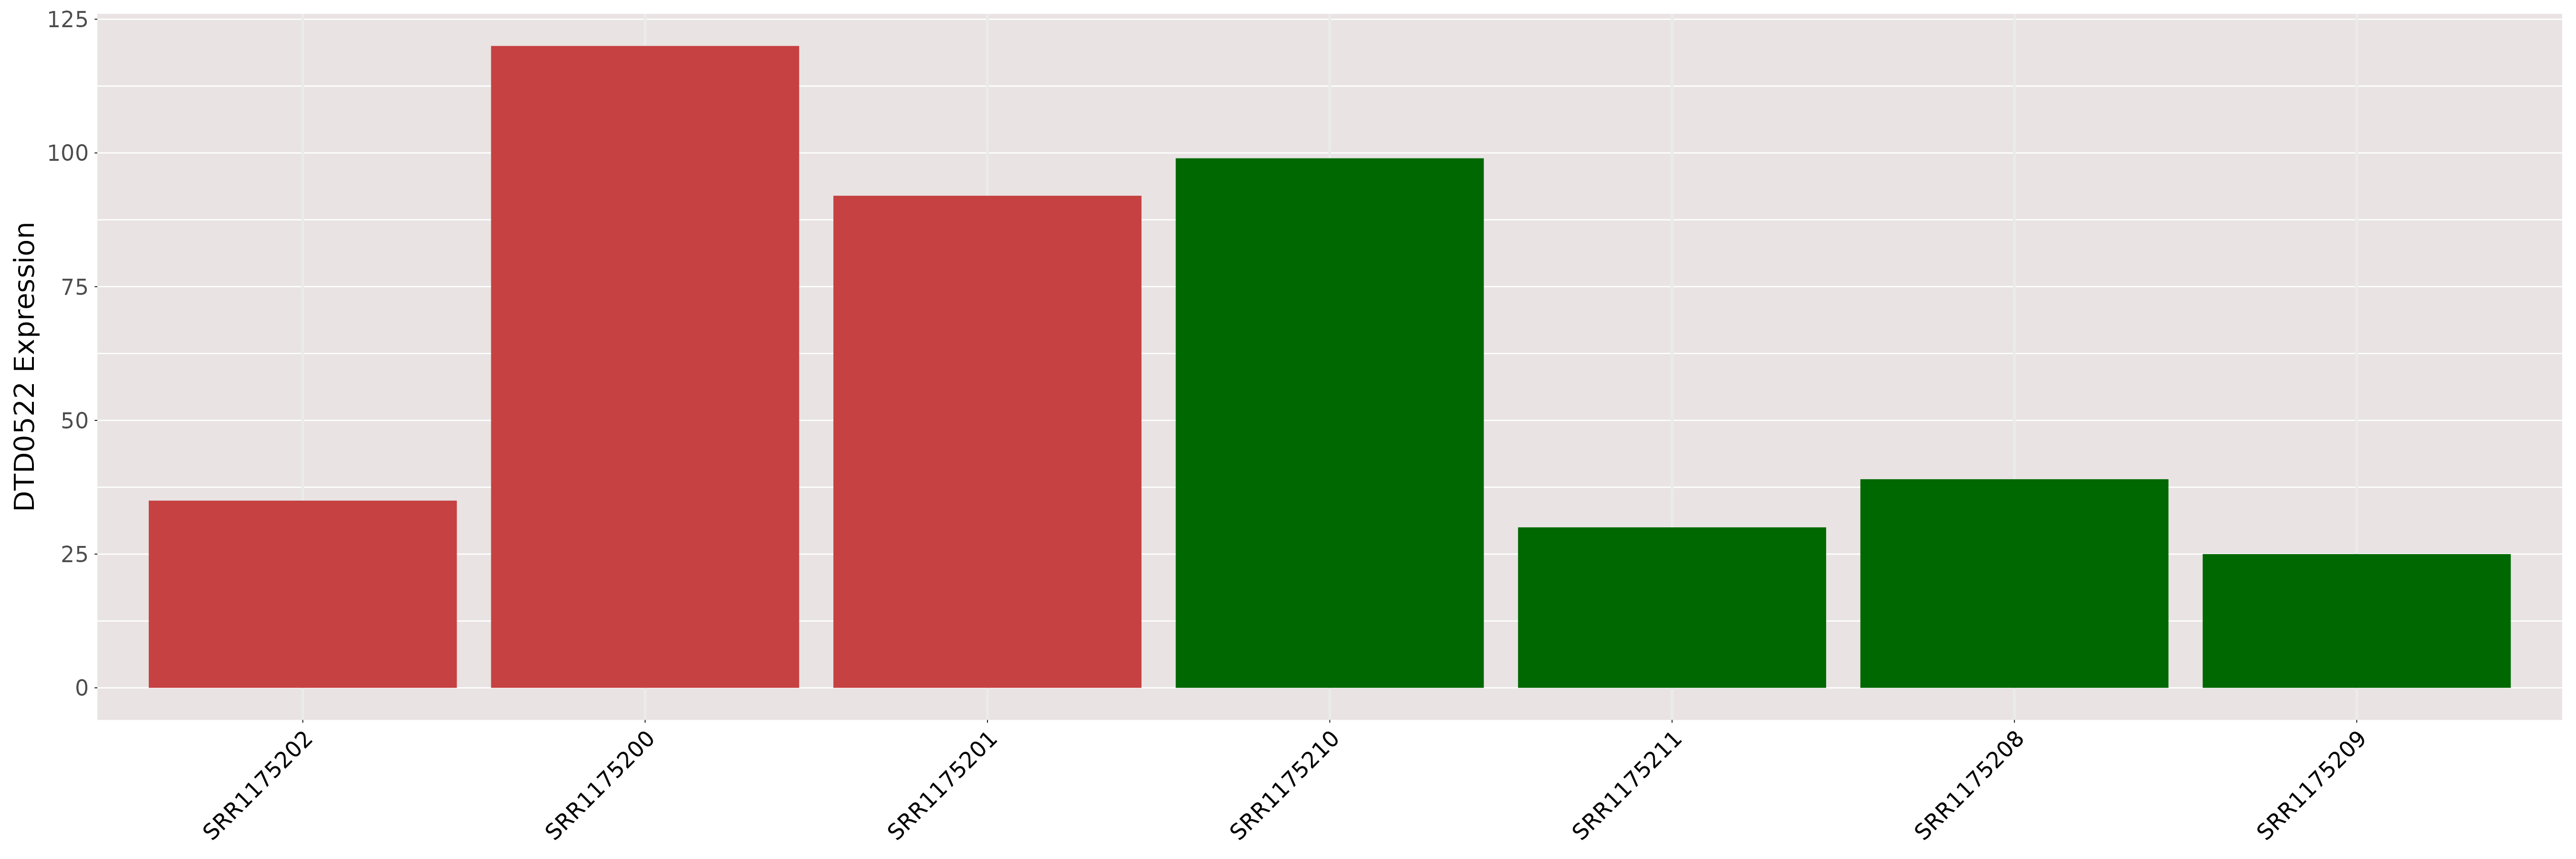
| The Studied Tissue | Colon | ||||
| The Specified Disease | Colorectal cancer [ICD-11:2B91] | ||||
| The Expression Level of Disease Section Compare with the Healthy Individual Tissue | p-value:0.0009330184525301; Fold-change:10.625; Z-score:6.640909611928383 | ||||
| DT expression in the diseased tissue of patients
DT expression in the normal tissue of healthy individuals
|
|||||
|
 Please Click the above Thumbnail to View/Download
the Expression Barchart for All Samples Please Click the above Thumbnail to View/Download
the Expression Barchart for All Samples
|
||||
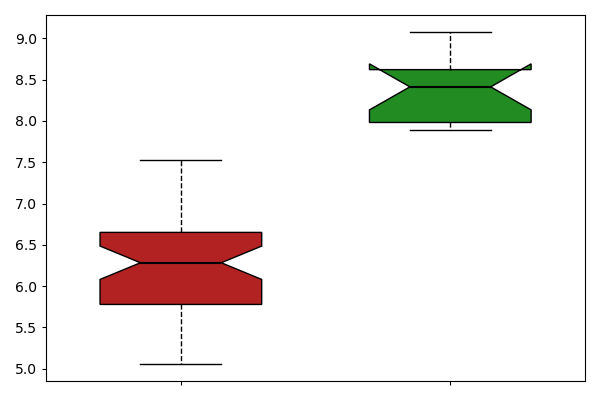
| [+] ICD-11: 2C10 Malignant neoplasm of pancreas (ductal adenocarcinoma) | Click to Show/Hide the Full List | ||||
| The Studied Tissue | Liver | ||||
| The Specified Disease | Primary pancreatic ductal adenocarcinoma [ICD-11:2C10] | ||||
| The Expression Level of Disease Section Compare with the Healthy Individual Tissue | p-value:0.6240189721312119; Fold-change:1.0675886911403083; Z-score:0.6319872245969769 | ||||
| DT expression in the diseased tissue of patients
DT expression in the normal tissue of healthy individuals
|
|||||
|
 Please Click the above Thumbnail to View/Download
the Expression Barchart for All Samples Please Click the above Thumbnail to View/Download
the Expression Barchart for All Samples
|
||||
| The Studied Tissue | Pancreas | ||||
| The Specified Disease | Primary pancreatic ductal adenocarcinoma [ICD-11:2C10] | ||||
| The Expression Level of Disease Section Compare with the Healthy Individual Tissue | p-value:0.8980915938226031; Fold-change:0.965144879817506; Z-score:0.0703248355777712 | ||||
| DT expression in the diseased tissue of patients
DT expression in the normal tissue of healthy individuals
|
|||||
|
 Please Click the above Thumbnail to View/Download
the Expression Barchart for All Samples Please Click the above Thumbnail to View/Download
the Expression Barchart for All Samples
|
||||
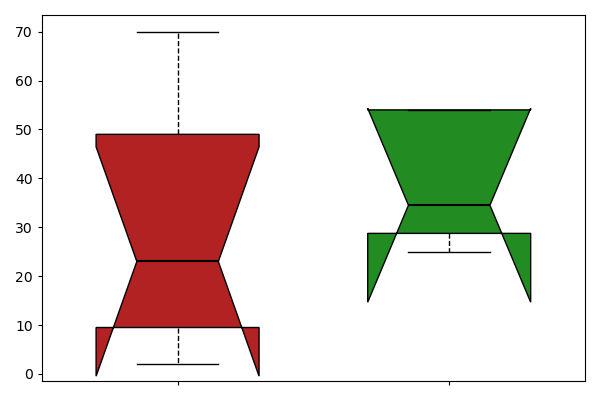
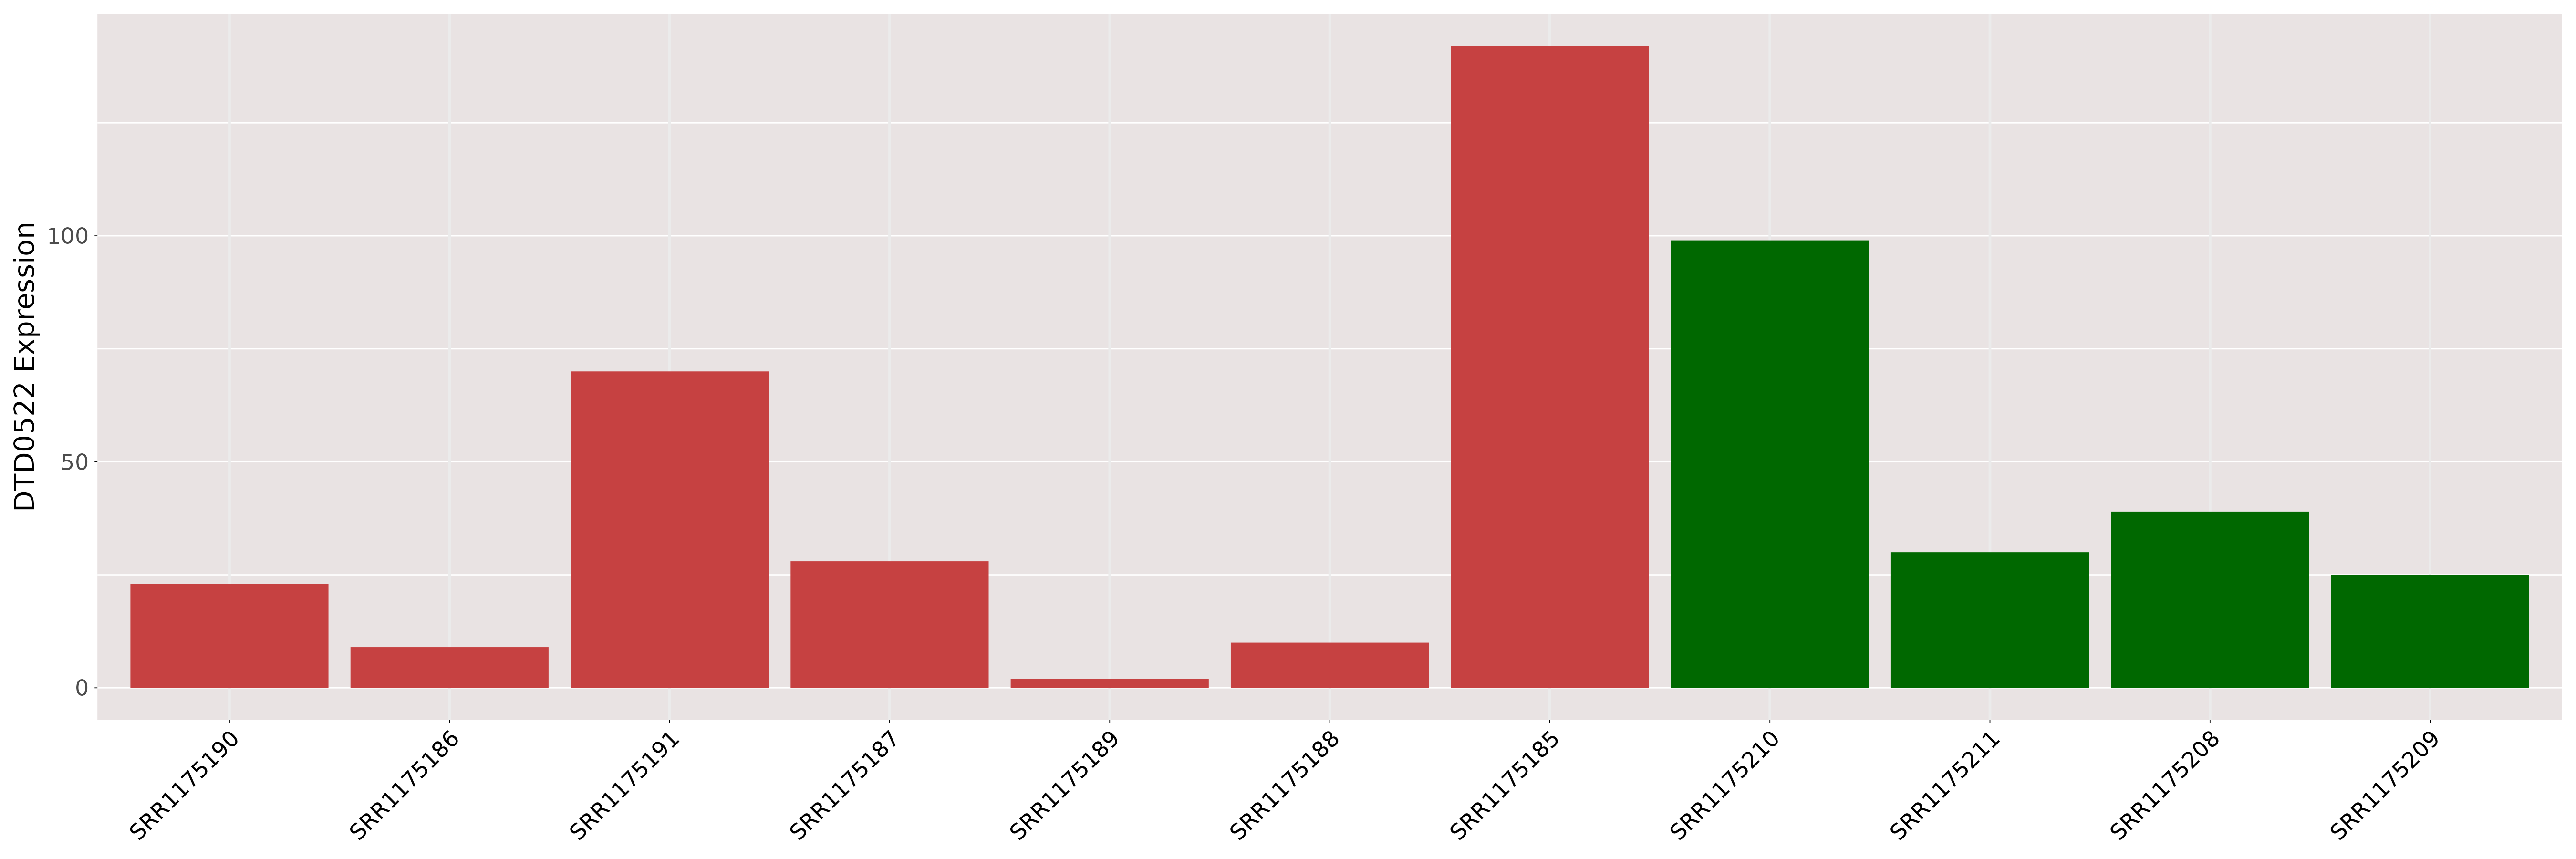
| [+] ICD-11: 2C25 Malignant neoplasms of bronchus or lung | Click to Show/Hide the Full List | ||||
| The Studied Tissue | Saliva | ||||
| The Specified Disease | Lung cancer [ICD-11:2C25] | ||||
| The Expression Level of Disease Section Compare with the Healthy Individual Tissue | p-value:0.2195257717210202; Fold-change:1.0226269706302655; Z-score:0.6078972214094779 | ||||
| DT expression in the diseased tissue of patients
DT expression in the normal tissue of healthy individuals
|
|||||
|
 Please Click the above Thumbnail to View/Download
the Expression Barchart for All Samples Please Click the above Thumbnail to View/Download
the Expression Barchart for All Samples
|
||||
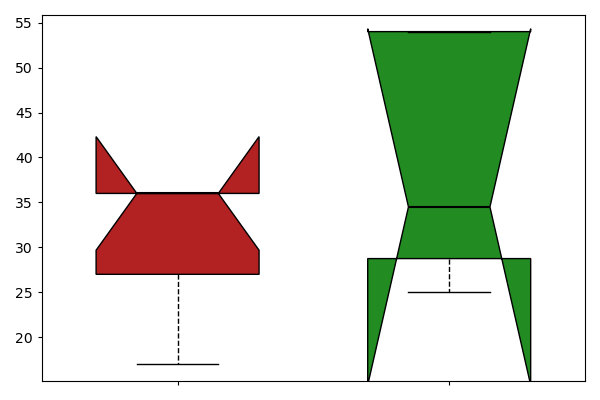
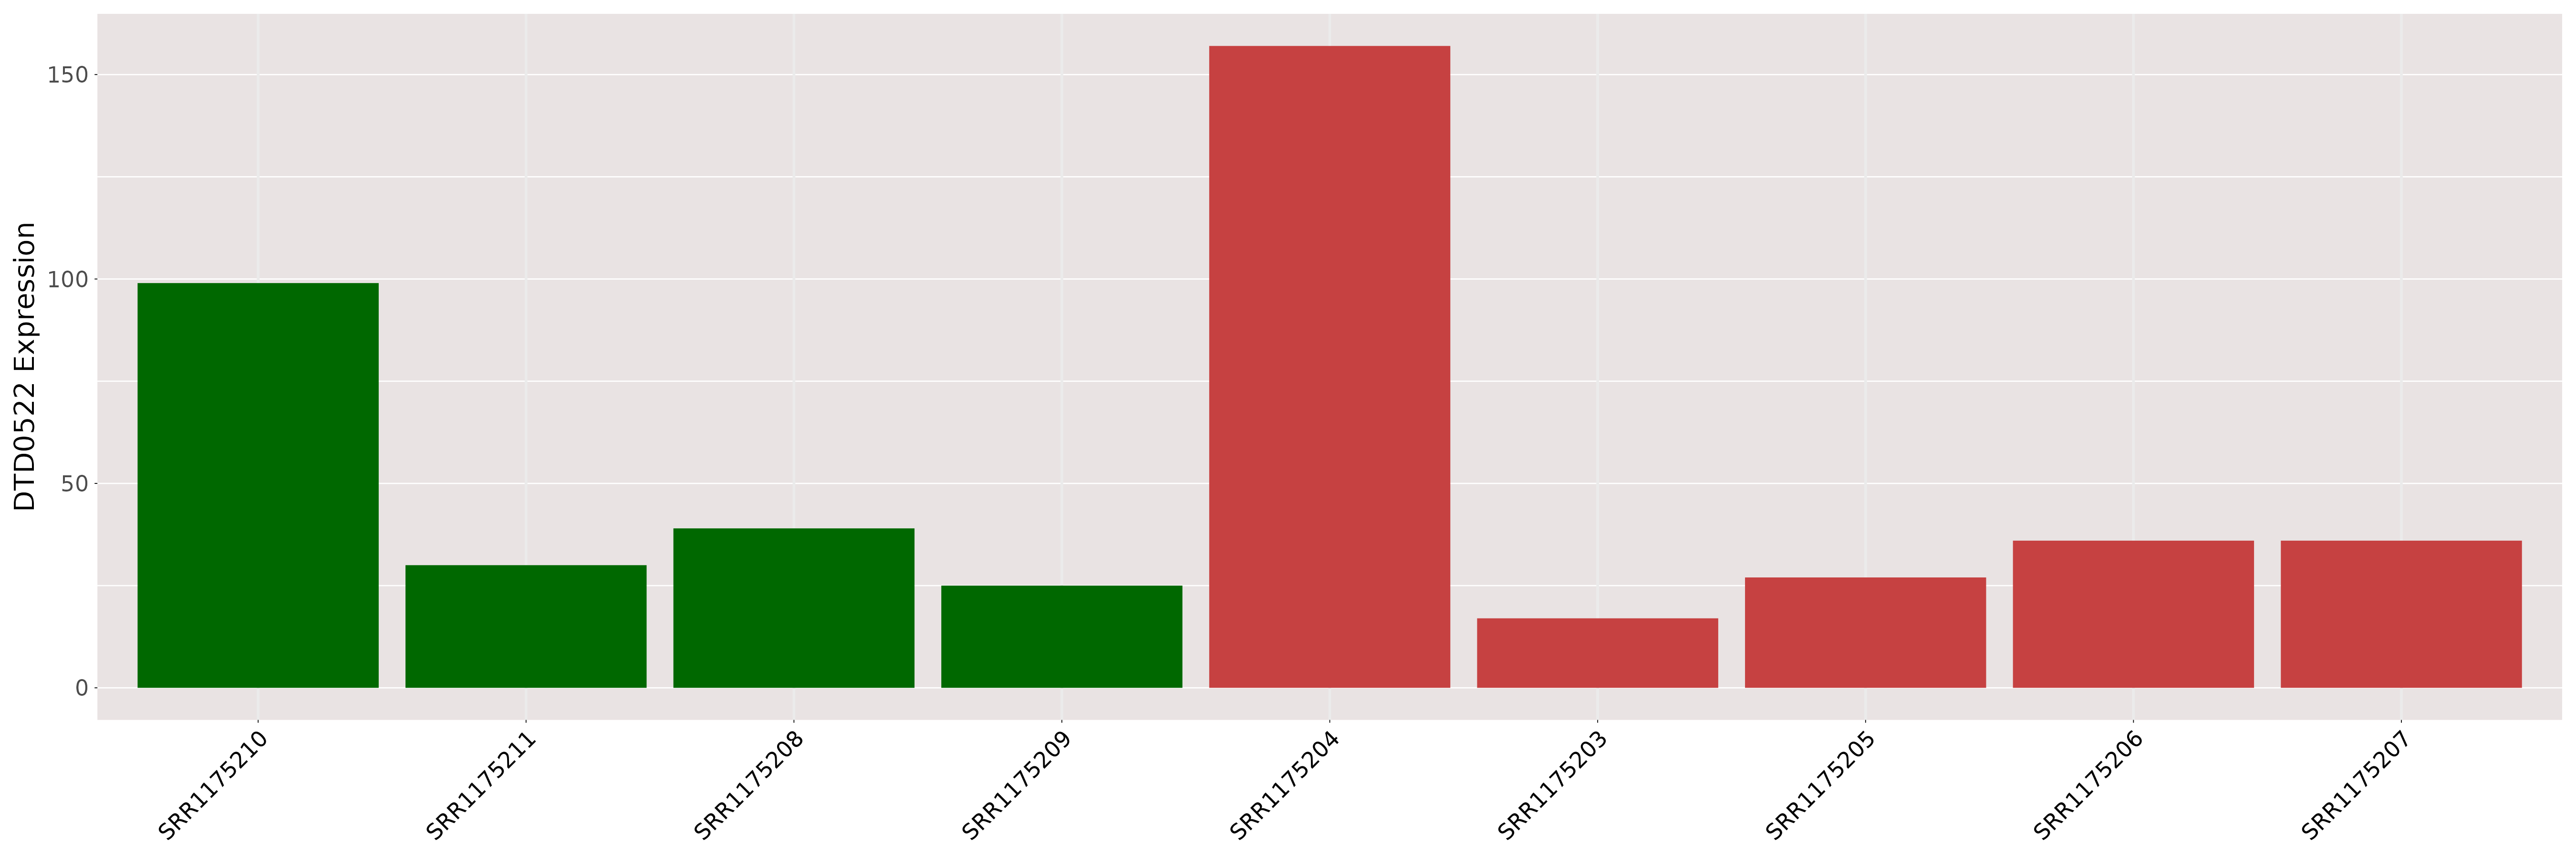
| [+] ICD-11: 2C25.0 Adenocarcinoma of bronchus or lung | Click to Show/Hide the Full List | ||||
| The Studied Tissue | Blood | ||||
| The Specified Disease | Lung adenocarcinoma [ICD-11:2C25] | ||||
| The Expression Level of Disease Section Compare with the Healthy Individual Tissue | p-value:0.182865503794886; Fold-change:0.9981583627266248; Z-score:-0.221713397 | ||||
| DT expression in the diseased tissue of patients
DT expression in the normal tissue of healthy individuals
|
|||||
|
 Please Click the above Thumbnail to View/Download
the Expression Barchart for All Samples Please Click the above Thumbnail to View/Download
the Expression Barchart for All Samples
|
||||
| The Studied Tissue | Lung | ||||
| The Specified Disease | Lung adenocarcinomas [ICD-11:2C25] | ||||
| The Expression Level of Disease Section Compare with the Healthy Individual Tissue | p-value:0.15066839506894; Fold-change:0.9445248720189046; Z-score:-1.228507131 | ||||
| DT expression in the diseased tissue of patients
DT expression in the normal tissue of healthy individuals
|
|||||
|
 Please Click the above Thumbnail to View/Download
the Expression Barchart for All Samples Please Click the above Thumbnail to View/Download
the Expression Barchart for All Samples
|
||||
| [+] ICD-11: 2C25.0Z Non-small cell carcinoma of lung, unspecified | Click to Show/Hide the Full List | ||||
| The Studied Tissue | Lung | ||||
| The Specified Disease | Non small cell lung cancer [ICD-11:2C25] | ||||
| The Expression Level of Disease Section Compare with the Healthy Individual Tissue | p-value:1.6471382908915785e-06; Fold-change:0.9402113801338644; Z-score:-0.854283882 | ||||
| DT expression in the diseased tissue of patients
DT expression in the normal tissue of healthy individuals
|
|||||
|
 Please Click the above Thumbnail to View/Download
the Expression Barchart for All Samples Please Click the above Thumbnail to View/Download
the Expression Barchart for All Samples
|
||||
| [+] ICD-11: 2C25.1 Small cell carcinoma of bronchus or lung | Click to Show/Hide the Full List | ||||
| The Studied Tissue | Lung | ||||
| The Specified Disease | Small cell lung carcinoma [ICD-11:2C25] | ||||
| The Expression Level of Disease Section Compare with the Healthy Individual Tissue | p-value:0.8193496053758693; Fold-change:0.7640449438202247; Z-score:-0.155072375 | ||||
| DT expression in the diseased tissue of patients
DT expression in the normal tissue of healthy individuals
|
|||||
|
 Please Click the above Thumbnail to View/Download
the Expression Barchart for All Samples Please Click the above Thumbnail to View/Download
the Expression Barchart for All Samples
|
||||
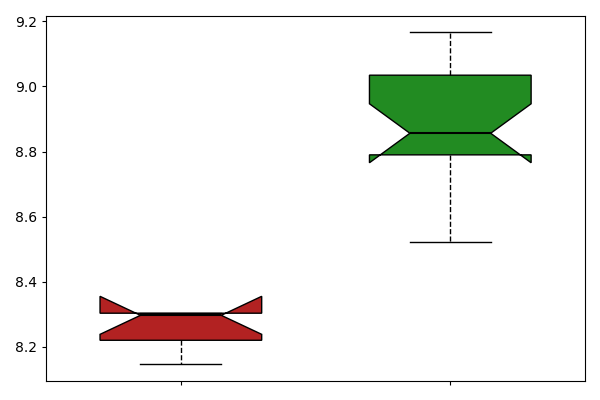
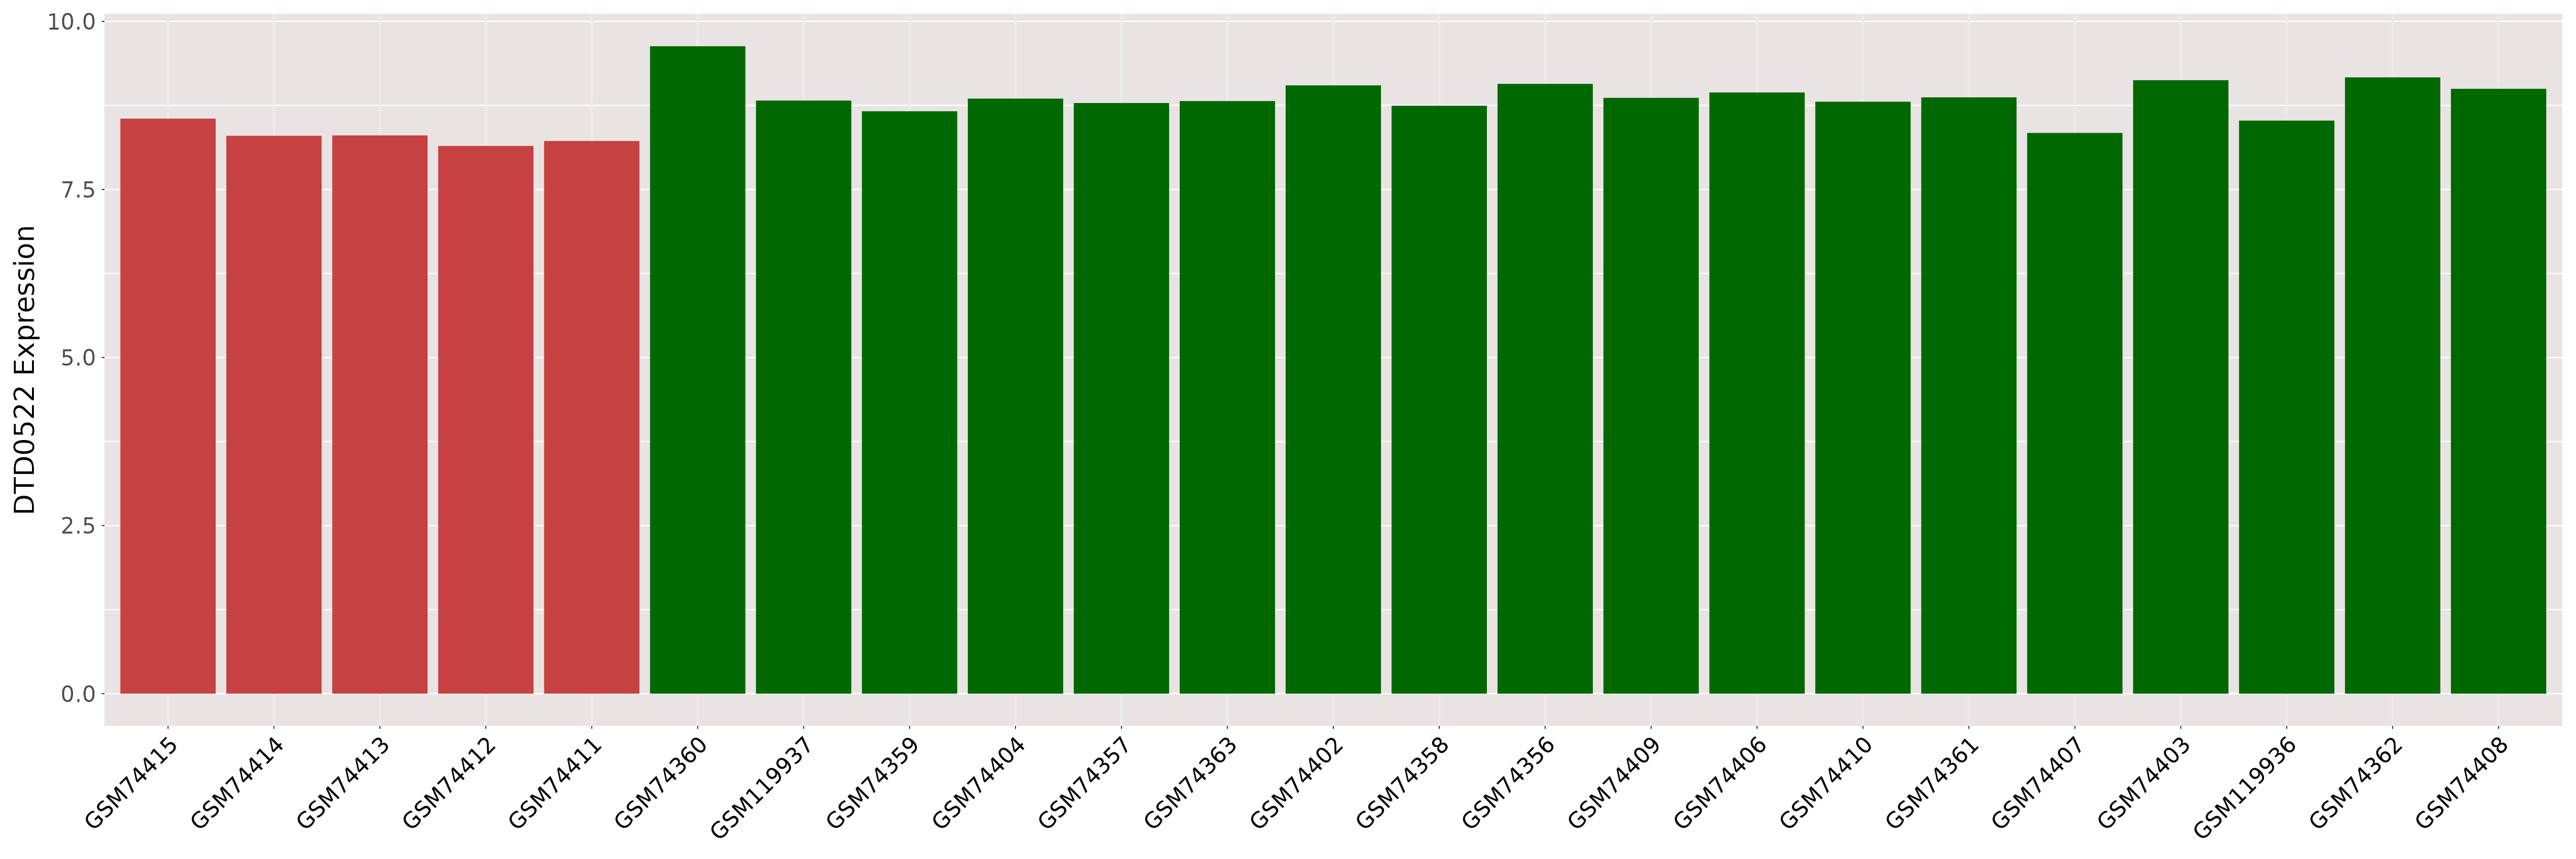
| [+] ICD-11: 2C31 Squamous cell carcinoma of skin | Click to Show/Hide the Full List | ||||
| The Studied Tissue | Skin | ||||
| The Specified Disease | Squamous cell carcinoma [ICD-11:2C31.Z] | ||||
| The Expression Level of Disease Section Compare with the Healthy Individual Tissue | p-value:0.3981349057184541; Fold-change:0.661042944785276; Z-score:-0.490652425 | ||||
| DT expression in the diseased tissue of patients
DT expression in the normal tissue of healthy individuals
|
|||||

|
 Please Click the above Thumbnail to View/Download
the Expression Barchart for All Samples Please Click the above Thumbnail to View/Download
the Expression Barchart for All Samples
|
||||
| [+] ICD-11: 2C90 Malignant neoplasm of kidney, except renal pelvis (clear cell type) | Click to Show/Hide the Full List | ||||
| The Studied Tissue | Kidney | ||||
| The Specified Disease | Clear cell renal carcinomas [ICD-11:2C90] | ||||
| The Expression Level of Disease Section Compare with the Healthy Individual Tissue | p-value:0.0002277510938292; Fold-change:0.8778955722220192; Z-score:-1.781889125 | ||||
| DT expression in the diseased tissue of patients
DT expression in the normal tissue of healthy individuals
|
|||||
|
|
|
||||
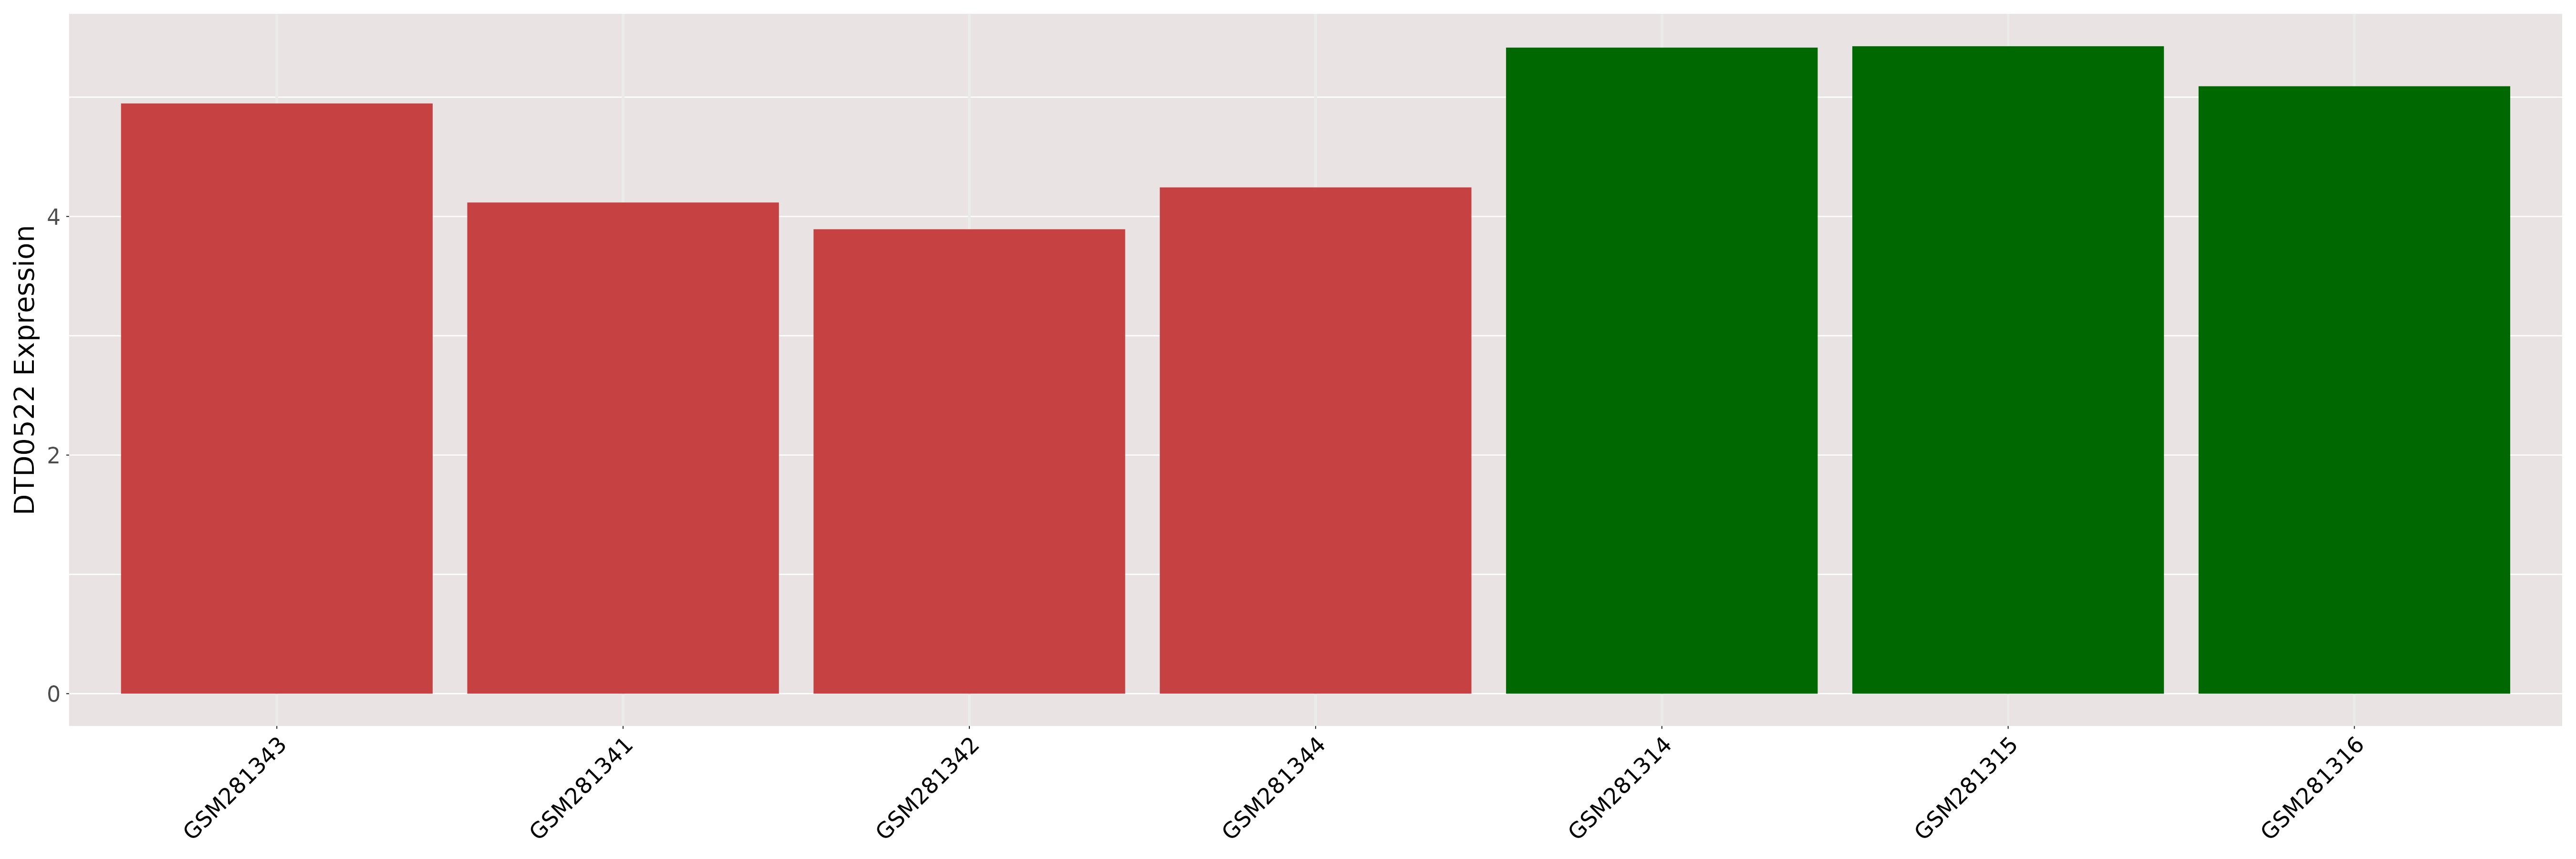
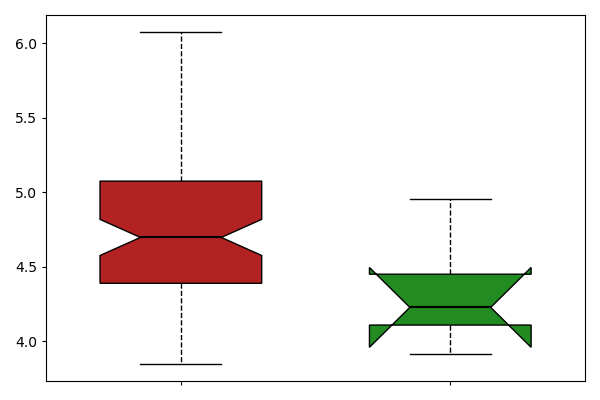
| [+] ICD-11: 2C90.0 Renal cell carcinoma of kidney, except renal pelvis (chromophobe type) | Click to Show/Hide the Full List | ||||
| The Studied Tissue | Kidney | ||||
| The Specified Disease | Chromophobe renal cell carcinoma [ICD-11:2C90.Y] | ||||
| The Expression Level of Disease Section Compare with the Healthy Individual Tissue | p-value:0.9433396684050988; Fold-change:0.996202111115742; Z-score:0.0718420577767956 | ||||
| DT expression in the diseased tissue of patients
DT expression in the normal tissue of healthy individuals
|
|||||
|
 Please Click the above Thumbnail to View/Download
the Expression Barchart for All Samples Please Click the above Thumbnail to View/Download
the Expression Barchart for All Samples
|
||||
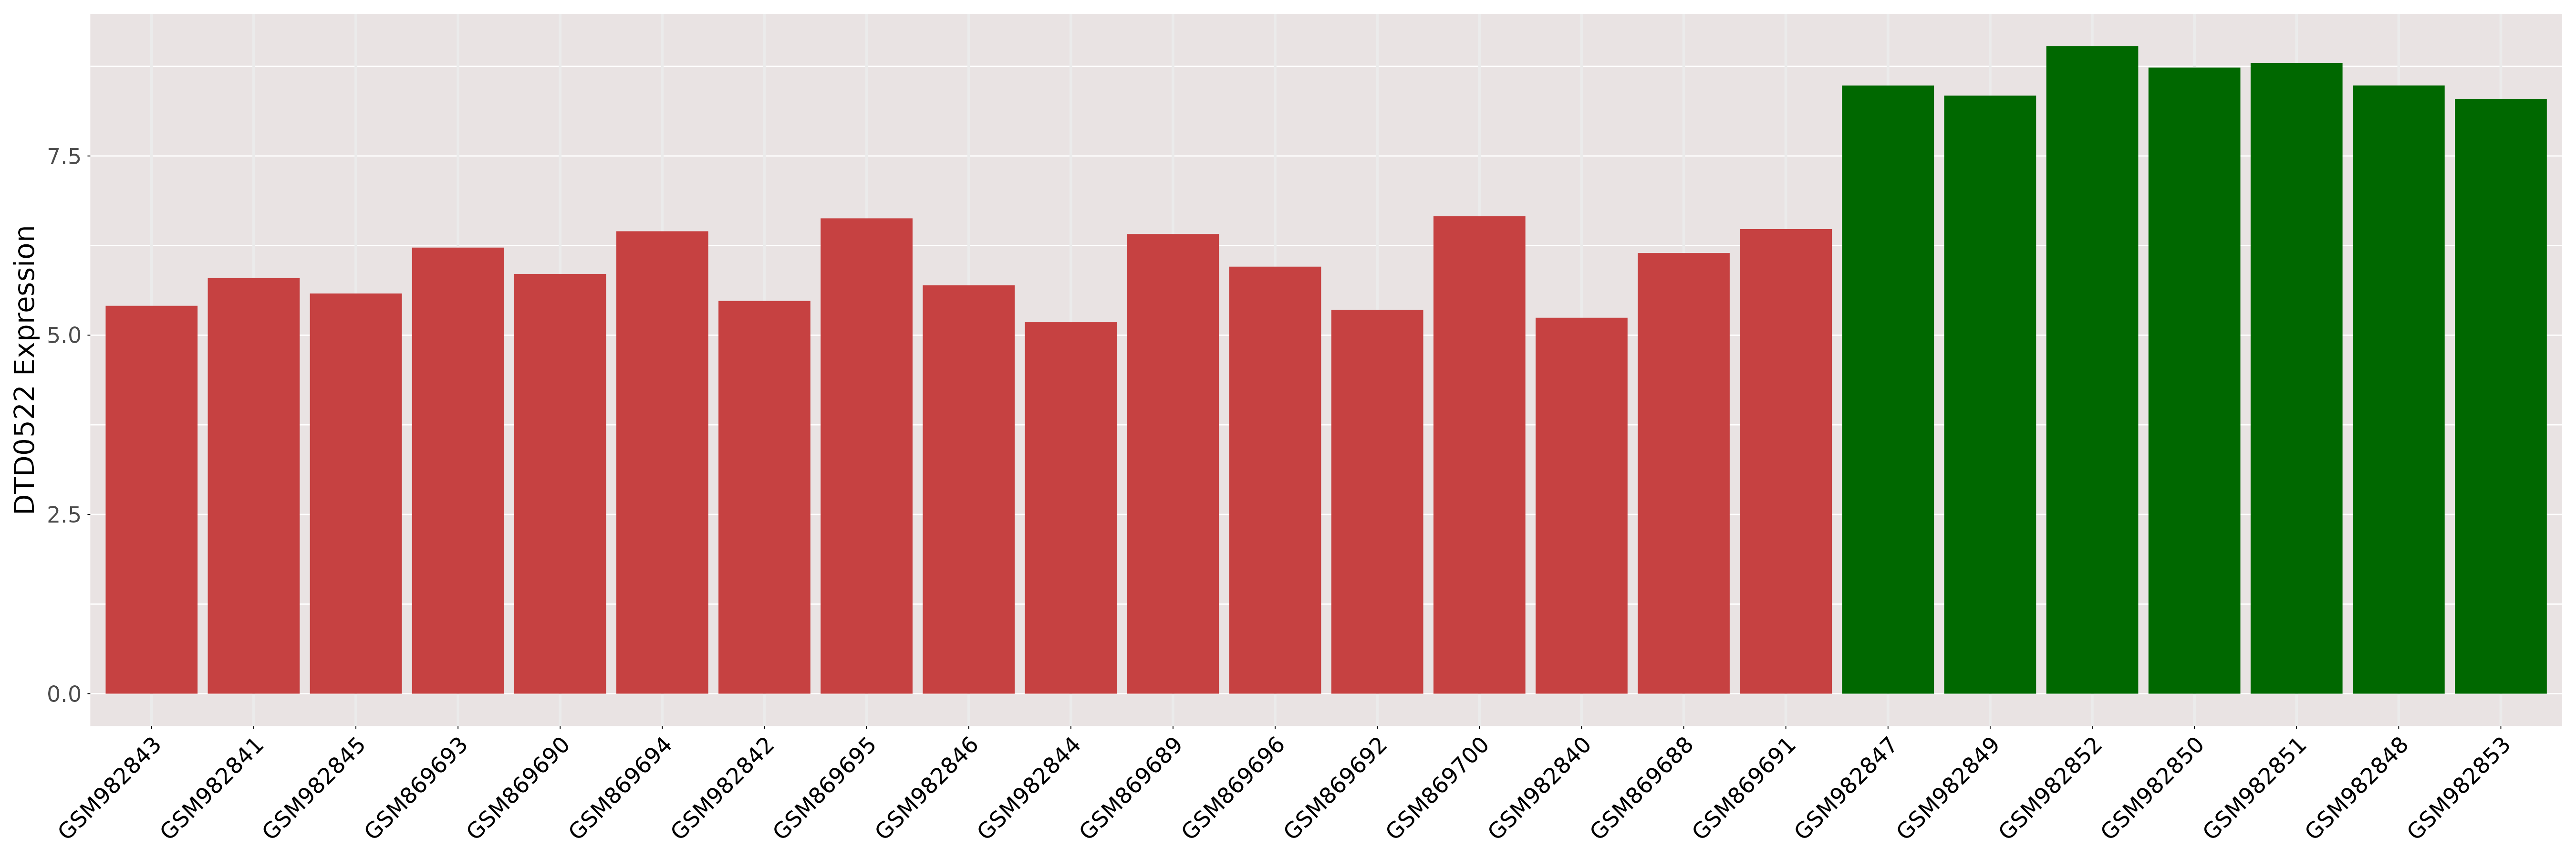
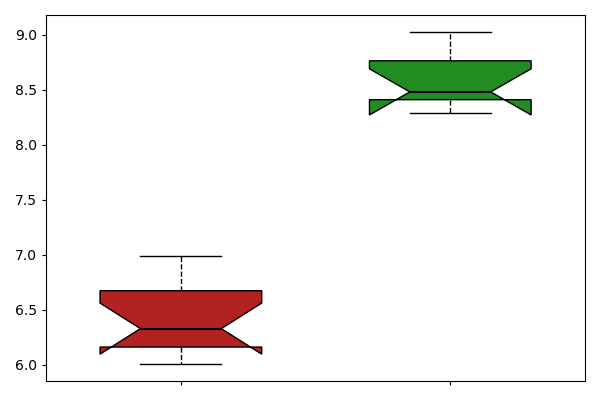
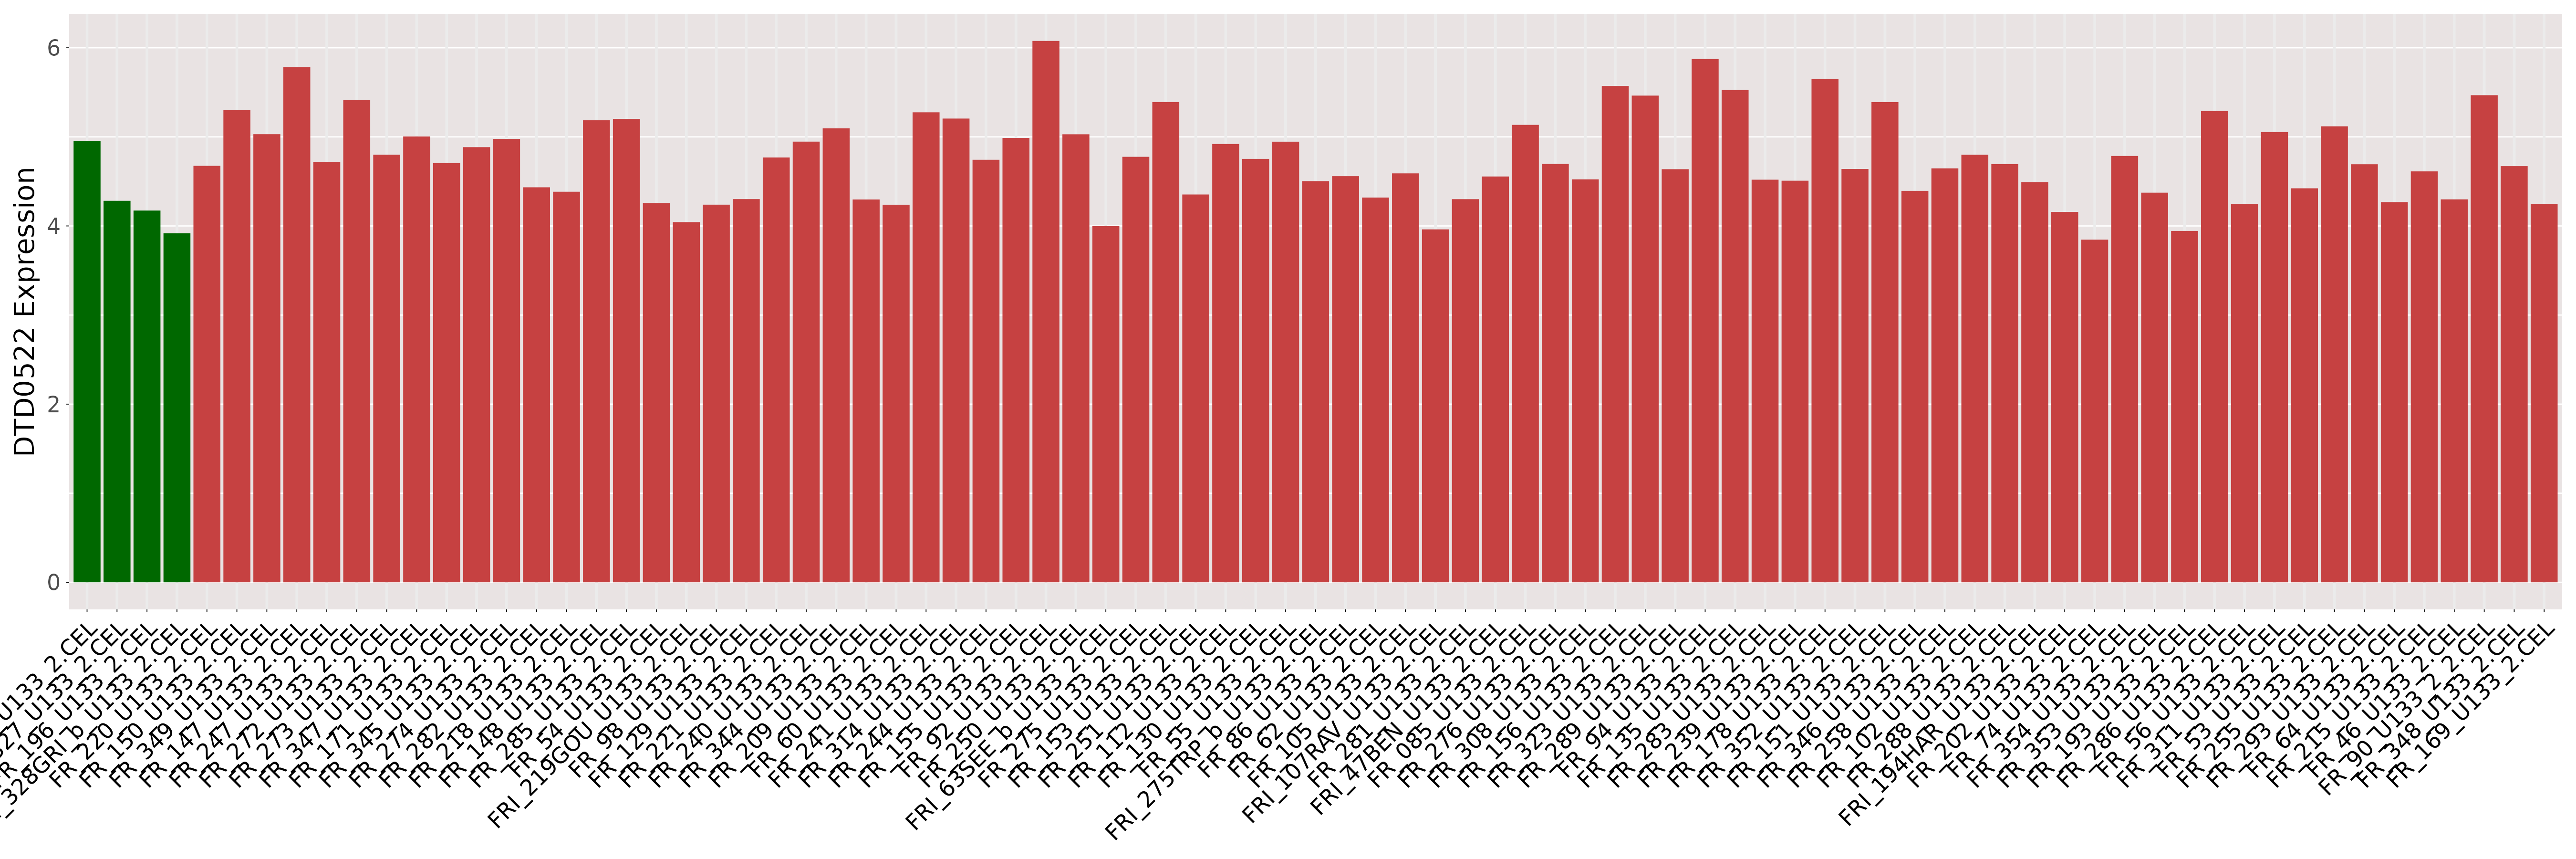
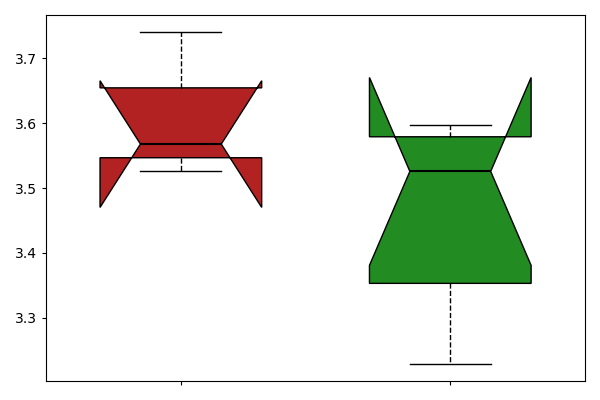
| [+] ICD-11: 2C90.0 Renal cell carcinoma of kidney, except renal pelvis (papillary type) | Click to Show/Hide the Full List | ||||
| The Studied Tissue | Kidney | ||||
| The Specified Disease | Papillary renal cell carcinoma [ICD-11:2C90.Y] | ||||
| The Expression Level of Disease Section Compare with the Healthy Individual Tissue | p-value:0.0016781647921153; Fold-change:0.8104310999654811; Z-score:-4.837204845 | ||||
| DT expression in the diseased tissue of patients
DT expression in the normal tissue of healthy individuals
|
|||||
|
 Please Click the above Thumbnail to View/Download
the Expression Barchart for All Samples Please Click the above Thumbnail to View/Download
the Expression Barchart for All Samples
|
||||
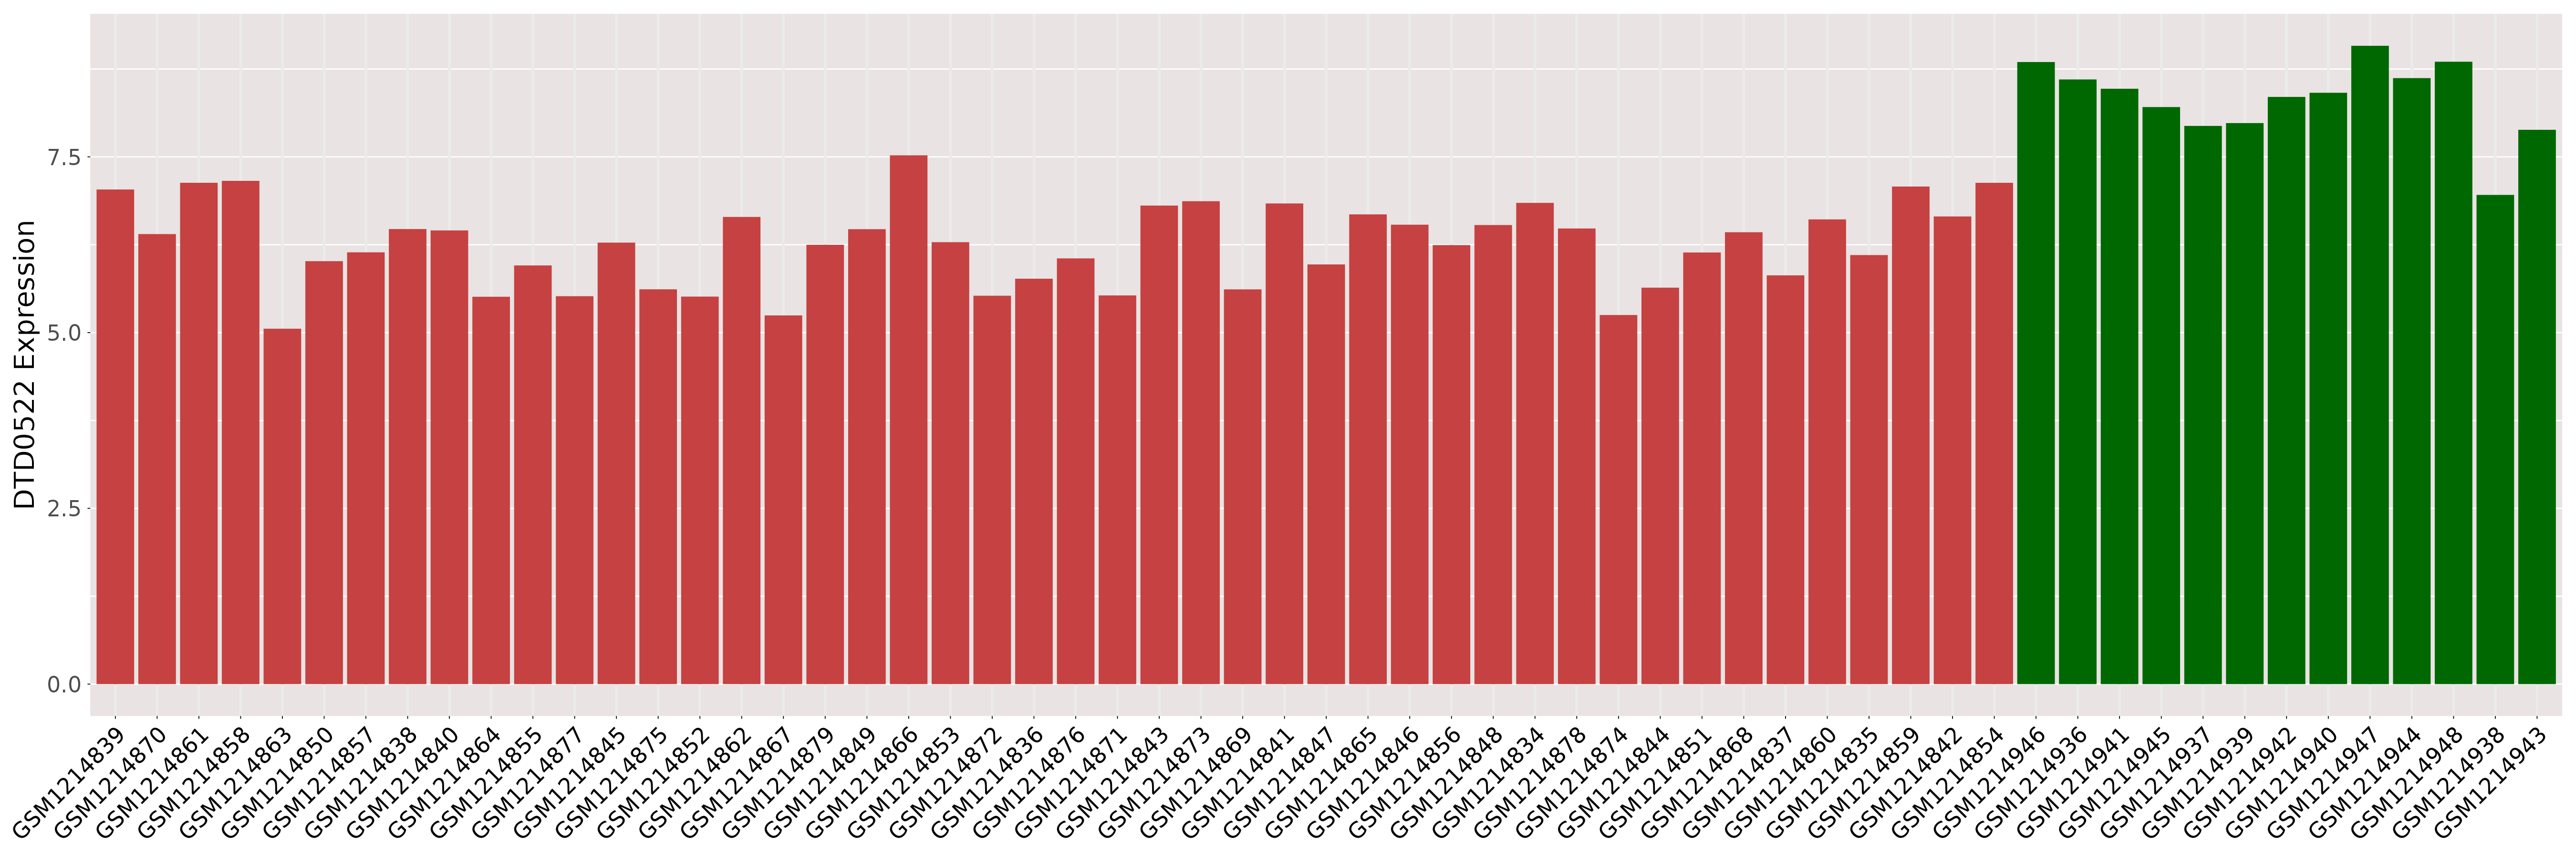
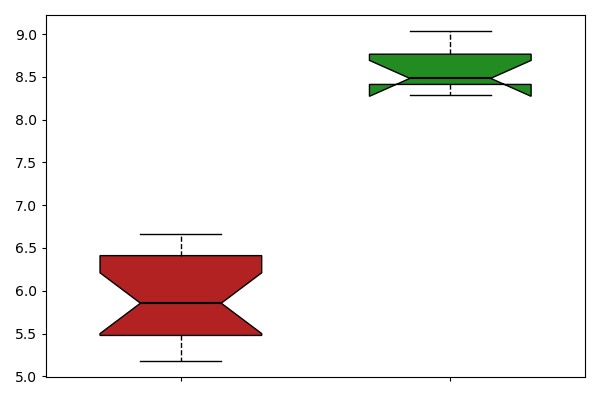
| [+] ICD-11: 2C90.Y Nephroblastoma (Wilms tumor) | Click to Show/Hide the Full List | ||||
| The Studied Tissue | Kidney | ||||
| The Specified Disease | Nephroblastoma [ICD-11:2C90.Y] | ||||
| The Expression Level of Disease Section Compare with the Healthy Individual Tissue | p-value:0.0163290611287398; Fold-change:0.7719536800857582; Z-score:-5.311137934 | ||||
| DT expression in the diseased tissue of patients
DT expression in the normal tissue of healthy individuals
|
|||||
|
 Please Click the above Thumbnail to View/Download
the Expression Barchart for All Samples Please Click the above Thumbnail to View/Download
the Expression Barchart for All Samples
|
||||
| [+] ICD-11: 2C94.2 Urothelial carcinoma of bladder | Click to Show/Hide the Full List | ||||
| The Studied Tissue | Bladder | ||||
| The Specified Disease | Urothelial carcinoma [ICD-11:2C94.2] | ||||
| The Expression Level of Disease Section Compare with the Healthy Individual Tissue | p-value:0.080921589423742; Fold-change:1.1109615675414986; Z-score:0.9854726907696804 | ||||
| DT expression in the diseased tissue of patients
DT expression in the normal tissue of healthy individuals
|
|||||
|
 Please Click the above Thumbnail to View/Download
the Expression Barchart for All Samples Please Click the above Thumbnail to View/Download
the Expression Barchart for All Samples
|
||||
| [+] ICD-11: 2E86.0 Leiomyoma of uterus (uterine fibroid) | Click to Show/Hide the Full List | ||||
| The Studied Tissue | Uterus | ||||
| The Specified Disease | Uterine fibroid [ICD-11:2E86.0] | ||||
| The Expression Level of Disease Section Compare with the Healthy Individual Tissue | p-value:0.555899283933188; Fold-change:1.0119503297786467; Z-score:0.3849915382512101 | ||||
| DT expression in the diseased tissue of patients
DT expression in the normal tissue of healthy individuals
|
|||||
|
 Please Click the above Thumbnail to View/Download
the Expression Barchart for All Samples Please Click the above Thumbnail to View/Download
the Expression Barchart for All Samples
|
||||
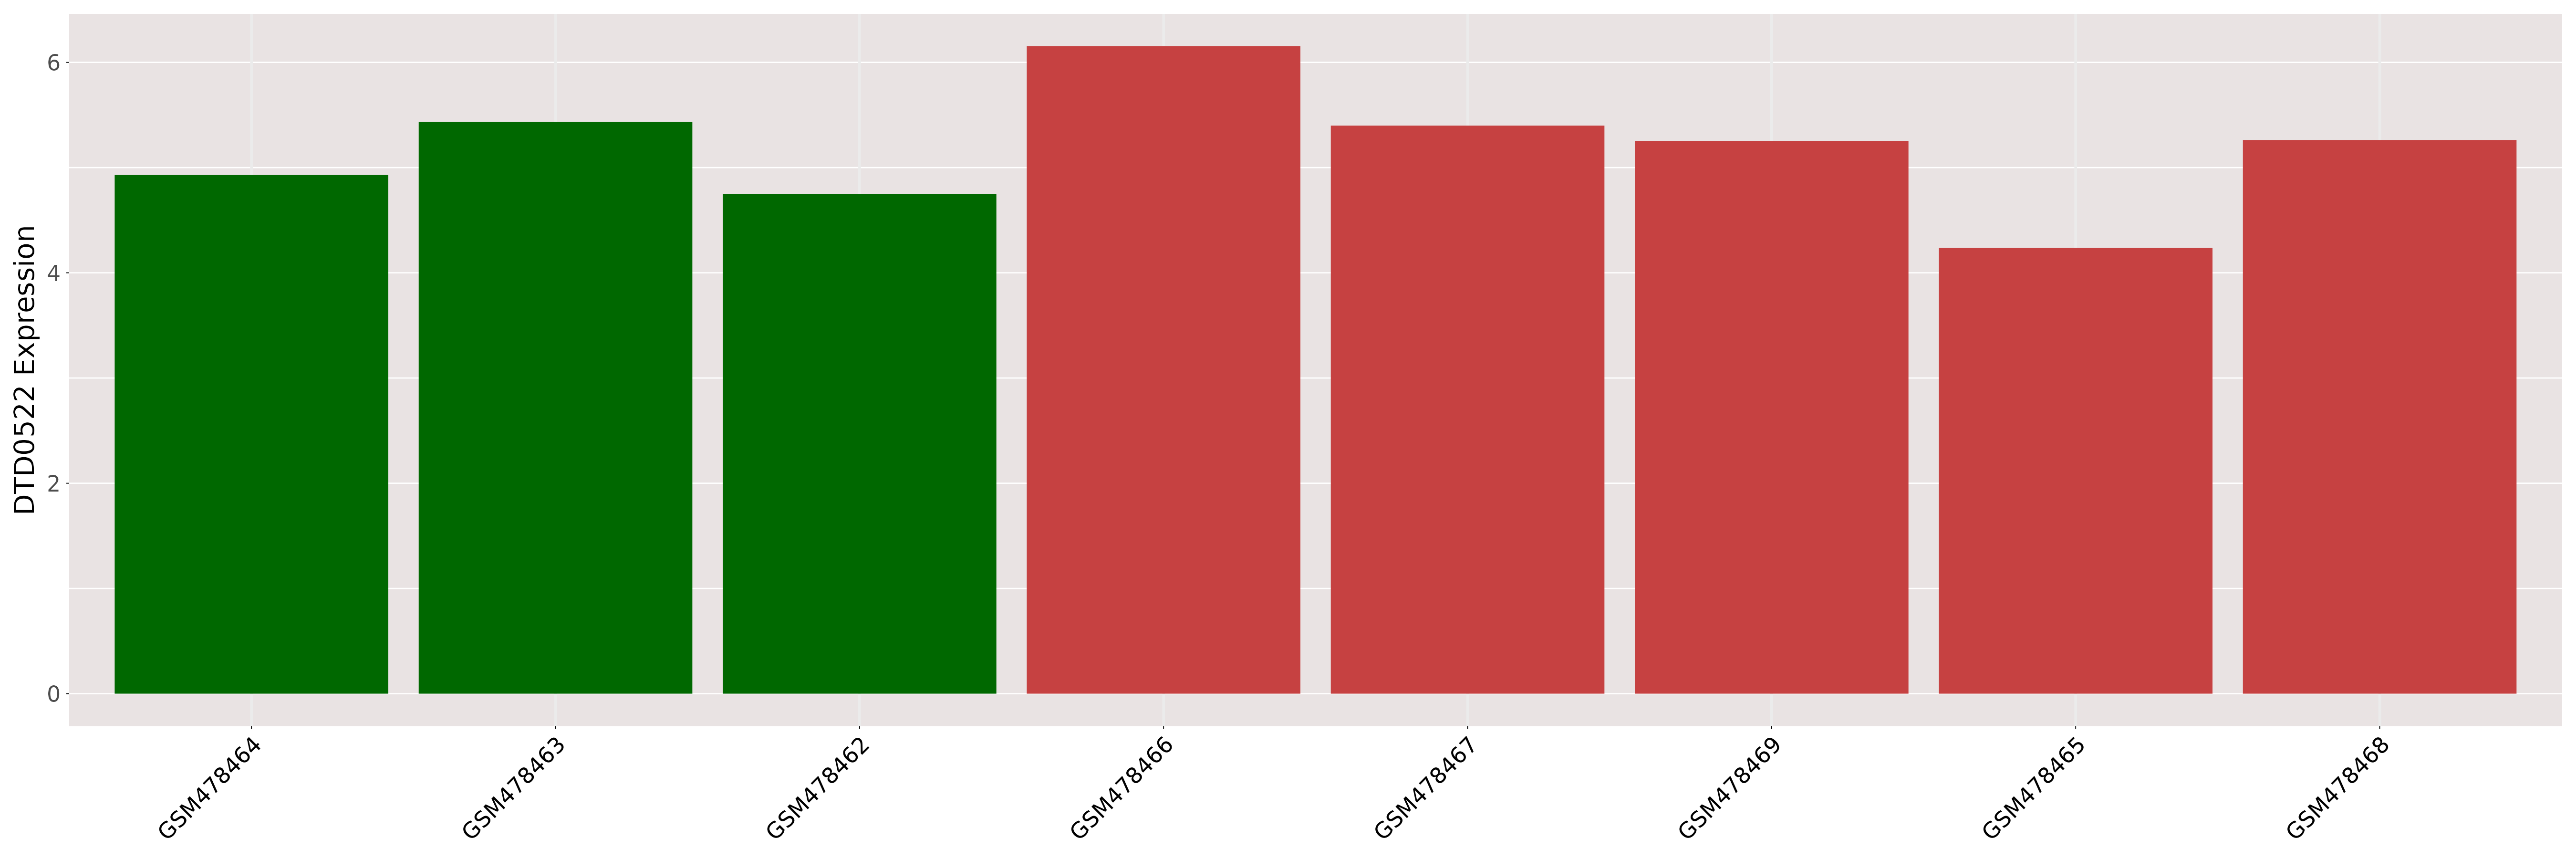
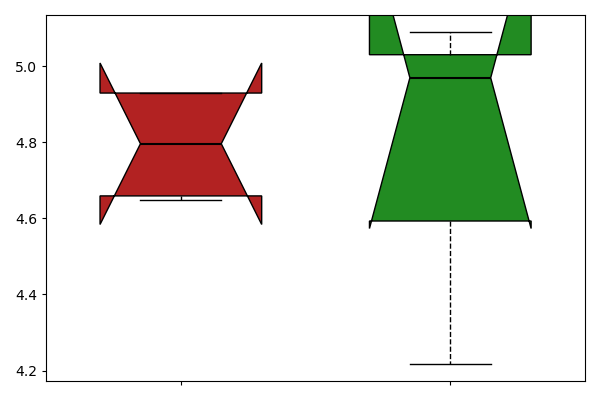
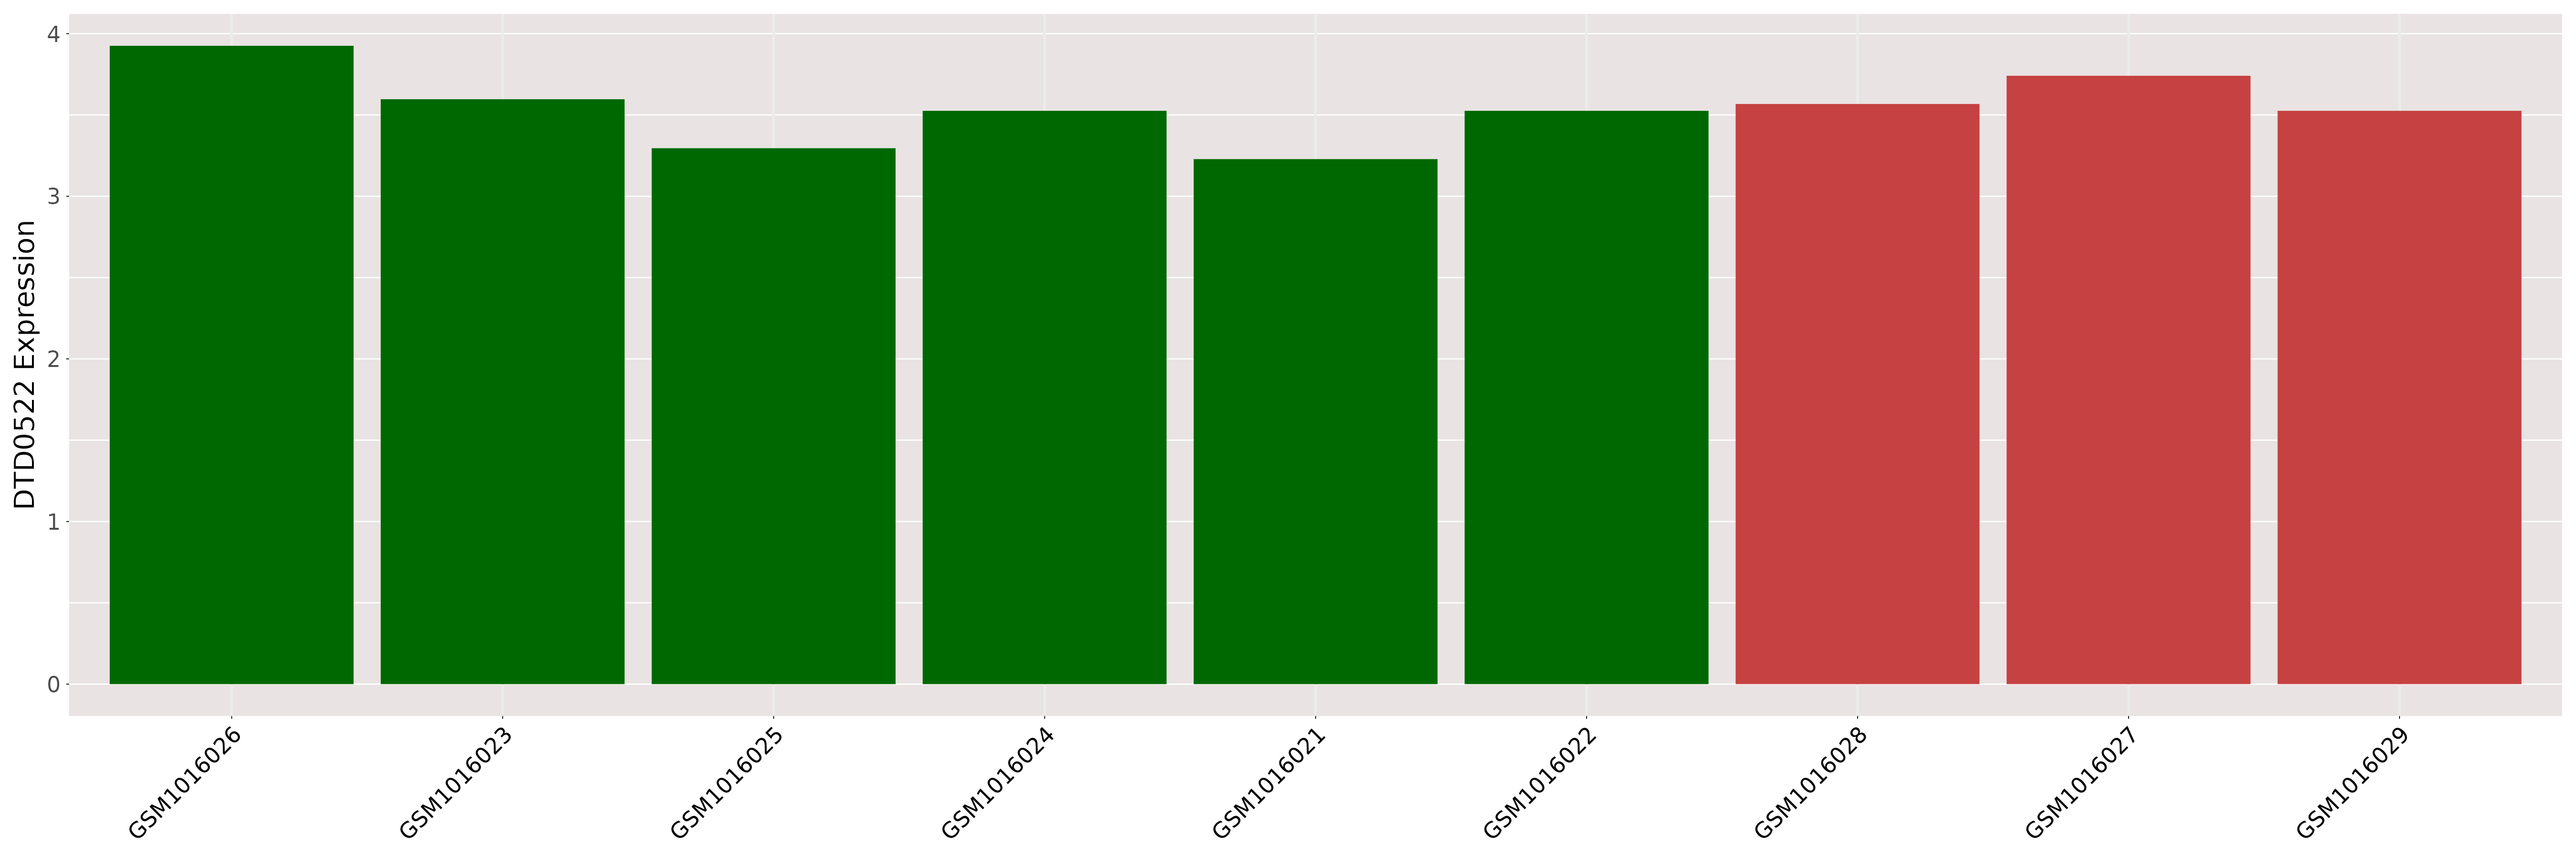
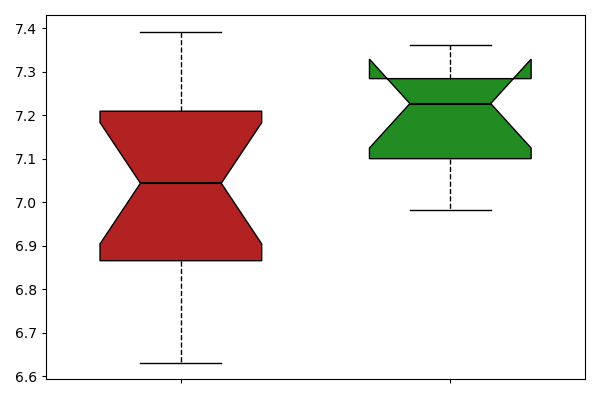
| [+] ICD-11: 2F32.0 Adenoma of colon (benign colon polyp) | Click to Show/Hide the Full List | ||||
| The Studied Tissue | Colon | ||||
| The Specified Disease | Colon adenoma [ICD-11:2F32.0] | ||||
| The Expression Level of Disease Section Compare with the Healthy Individual Tissue | p-value:0.4312064031455154; Fold-change:0.9746405977203426; Z-score:-0.832110544 | ||||
| DT expression in the diseased tissue of patients
DT expression in the normal tissue of healthy individuals
|
|||||
|
 Please Click the above Thumbnail to View/Download
the Expression Barchart for All Samples Please Click the above Thumbnail to View/Download
the Expression Barchart for All Samples
|
||||
| [+] ICD-11: 2F92 Benign neoplasm of kidney (renal oncocytoma) | Click to Show/Hide the Full List | ||||
| The Studied Tissue | Kidney | ||||
| The Specified Disease | Kidney oncocytoma [ICD-11:2F92] | ||||
| The Expression Level of Disease Section Compare with the Healthy Individual Tissue | p-value:0.1104276271884809; Fold-change:1.0315979319612647; Z-score:1.3554532659987628 | ||||
| DT expression in the diseased tissue of patients
DT expression in the normal tissue of healthy individuals
|
|||||
|
 Please Click the above Thumbnail to View/Download
the Expression Barchart for All Samples Please Click the above Thumbnail to View/Download
the Expression Barchart for All Samples
|
||||
| ICD-11: 04 Disease of the immune system | |||||
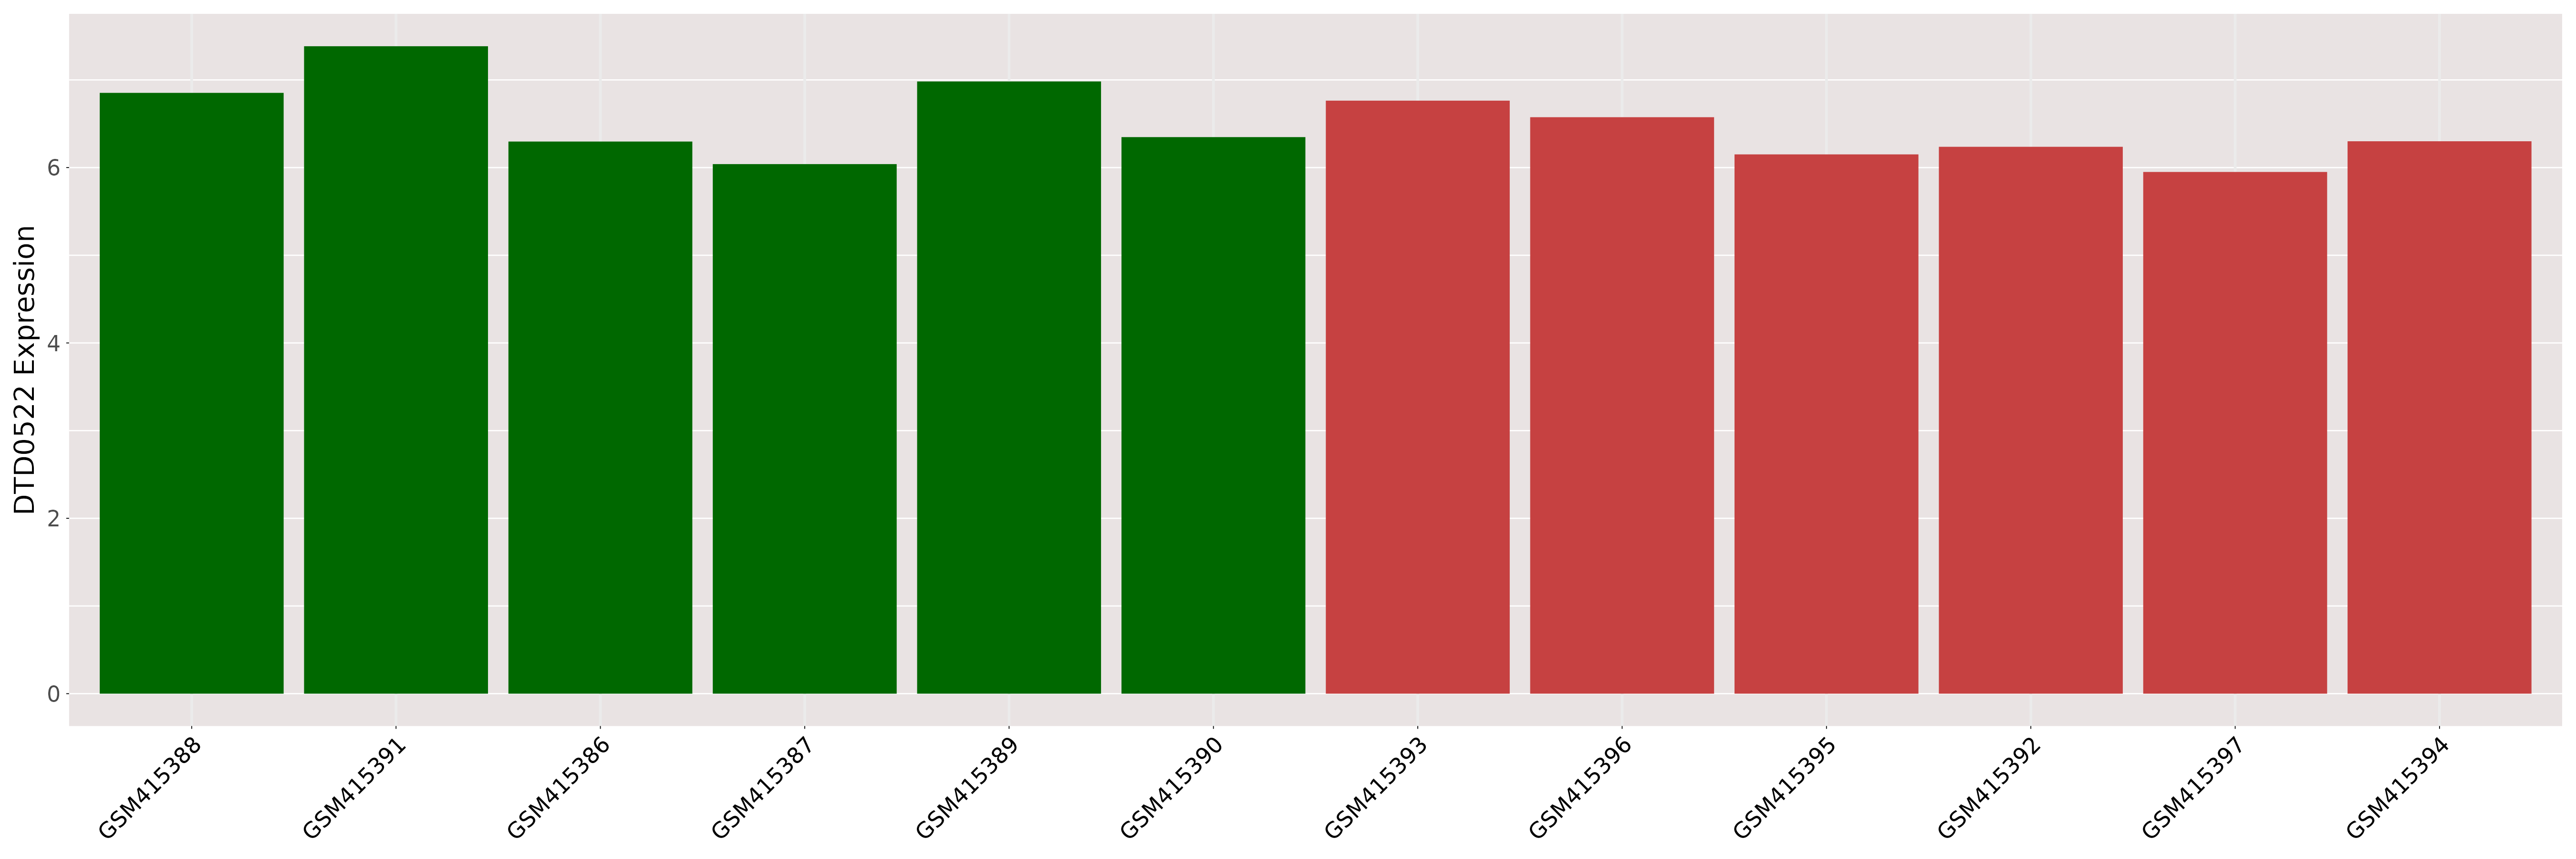
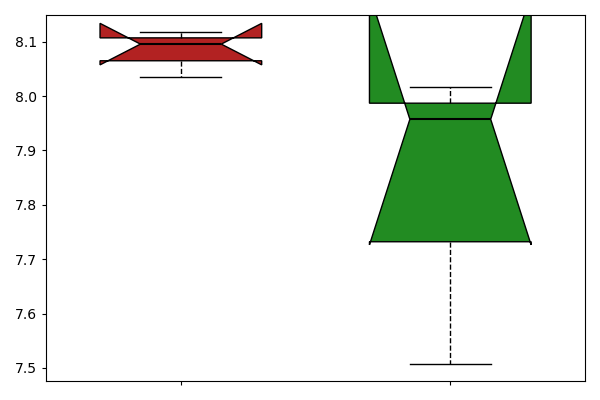
| [+] ICD-11: 4A41.0 Dermatomyositis | Click to Show/Hide the Full List | ||||
| The Studied Tissue | Skeletal muscle | ||||
| The Specified Disease | Dermatomyositis [ICD-11:4A41.00] | ||||
| The Expression Level of Disease Section Compare with the Healthy Individual Tissue | p-value:0.024495818712038; Fold-change:0.9406084515796016; Z-score:-1.423071573 | ||||
| DT expression in the diseased tissue of patients
DT expression in the normal tissue of healthy individuals
|
|||||
|
 Please Click the above Thumbnail to View/Download
the Expression Barchart for All Samples Please Click the above Thumbnail to View/Download
the Expression Barchart for All Samples
|
||||
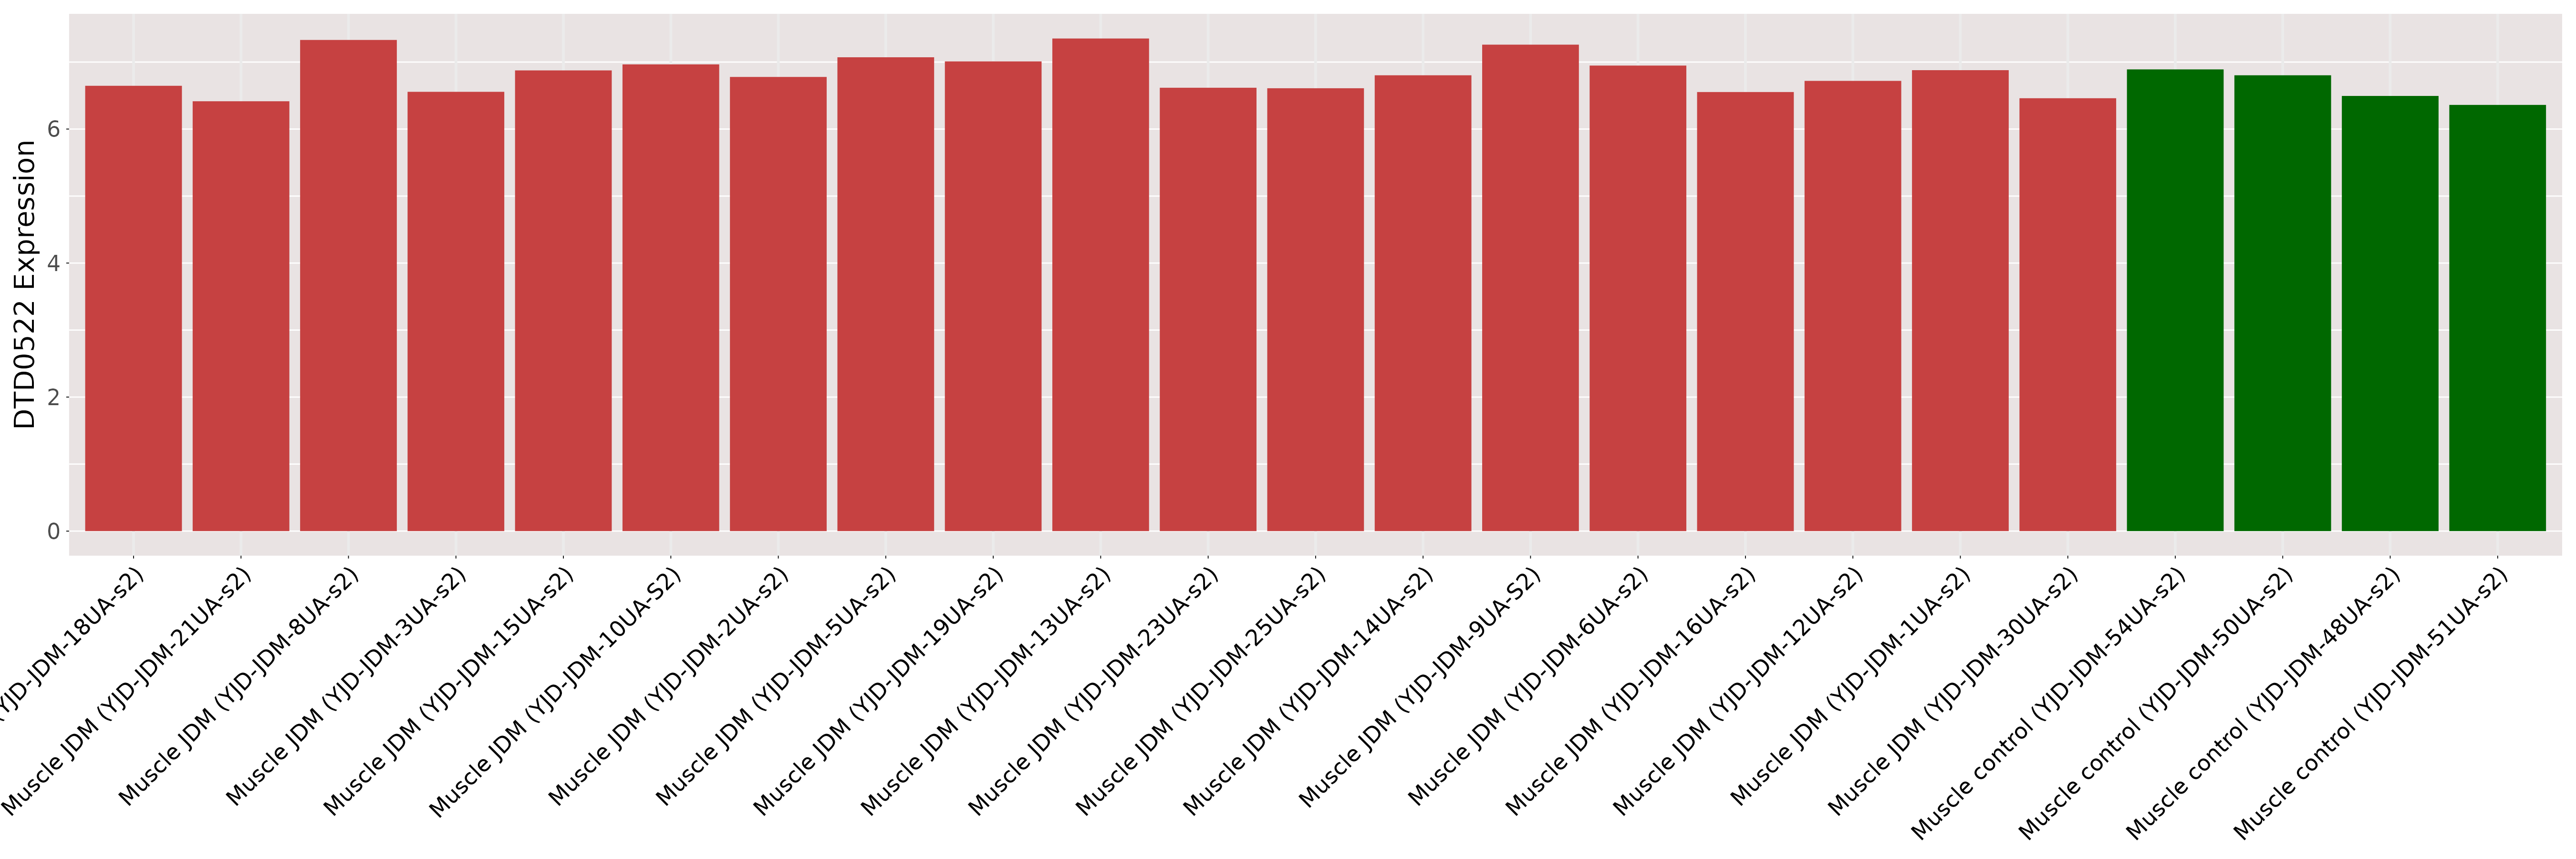
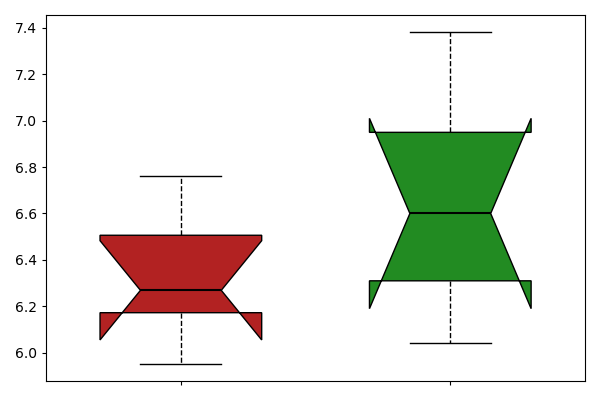
| [+] ICD-11: 4A41.0 Dermatomyositis (juvenile form) | Click to Show/Hide the Full List | ||||
| The Studied Tissue | Skeletal muscle organ | ||||
| The Specified Disease | Juvenile dermatomyositis [ICD-11:4A41.01] | ||||
| The Expression Level of Disease Section Compare with the Healthy Individual Tissue | p-value:0.2124422923422811; Fold-change:1.0231995051793206; Z-score:0.7856254592161453 | ||||
| DT expression in the diseased tissue of patients
DT expression in the normal tissue of healthy individuals
|
|||||
|
 Please Click the above Thumbnail to View/Download
the Expression Barchart for All Samples Please Click the above Thumbnail to View/Download
the Expression Barchart for All Samples
|
||||
| [+] ICD-11: 4B20 Sarcoidosis | Click to Show/Hide the Full List | ||||
| The Studied Tissue | Lung | ||||
| The Specified Disease | Sarcoidosis [ICD-11:4B20] | ||||
| The Expression Level of Disease Section Compare with the Healthy Individual Tissue | p-value:0.2086458108462096; Fold-change:0.9498160754320322; Z-score:-0.634979561 | ||||
| DT expression in the diseased tissue of patients
DT expression in the normal tissue of healthy individuals
|
|||||
|
 Please Click the above Thumbnail to View/Download
the Expression Barchart for All Samples Please Click the above Thumbnail to View/Download
the Expression Barchart for All Samples
|
||||
| ICD-11: 05 Endocrine, nutritional or metabolic disease | |||||
| [+] ICD-11: 5A11 Type 2 diabetes mellitus | Click to Show/Hide the Full List | ||||
| The Studied Tissue | Skeletal muscle | ||||
| The Specified Disease | Type 2 diabetes [ICD-11:5A11] | ||||
| The Expression Level of Disease Section Compare with the Healthy Individual Tissue | p-value:0.9399762225270132; Fold-change:1.007013611411696; Z-score:-0.043053802 | ||||
| DT expression in the diseased tissue of patients
DT expression in the normal tissue of healthy individuals
|
|||||

|
 Please Click the above Thumbnail to View/Download
the Expression Barchart for All Samples Please Click the above Thumbnail to View/Download
the Expression Barchart for All Samples
|
||||
| The Studied Tissue | Islet of langerhans | ||||
| The Specified Disease | Type ii diabetes mellitus [ICD-11:5A11] | ||||
| The Expression Level of Disease Section Compare with the Healthy Individual Tissue | p-value:0.4761543187633772; Fold-change:0.9; Z-score:-0.450693909 | ||||
| DT expression in the diseased tissue of patients
DT expression in the normal tissue of healthy individuals
|
|||||

|
 Please Click the above Thumbnail to View/Download
the Expression Barchart for All Samples Please Click the above Thumbnail to View/Download
the Expression Barchart for All Samples
|
||||
| [+] ICD-11: 5A11.2 Type 2 diabetes mellitus with diabetic nephropathy | Click to Show/Hide the Full List | ||||
| The Studied Tissue | Kidney | ||||
| The Specified Disease | Diabetic nephropathy [ICD-11:5A11.1] | ||||
| The Expression Level of Disease Section Compare with the Healthy Individual Tissue | p-value:0.1912608235591055; Fold-change:1.017378980174992; Z-score:0.9180566608609124 | ||||
| DT expression in the diseased tissue of patients
DT expression in the normal tissue of healthy individuals
|
|||||
|
 Please Click the above Thumbnail to View/Download
the Expression Barchart for All Samples Please Click the above Thumbnail to View/Download
the Expression Barchart for All Samples
|
||||
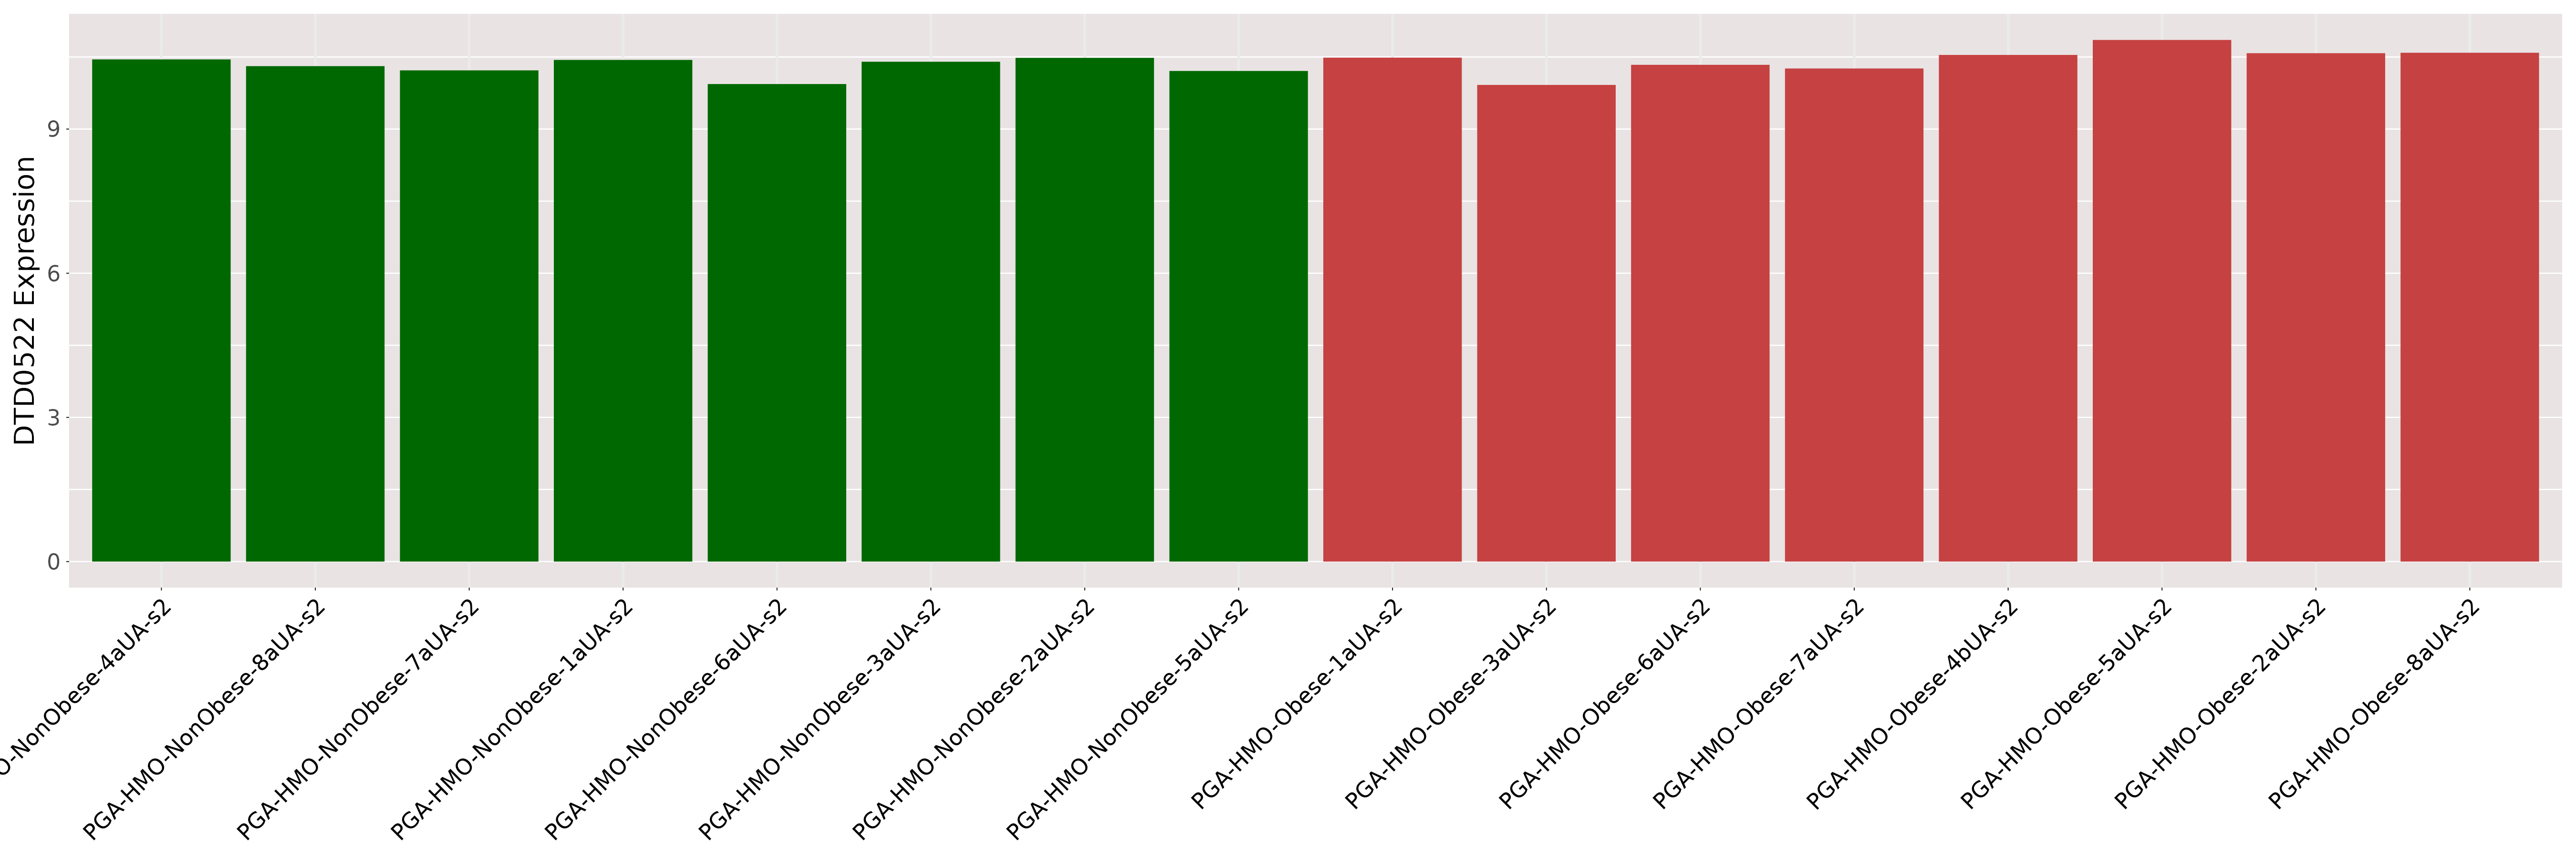
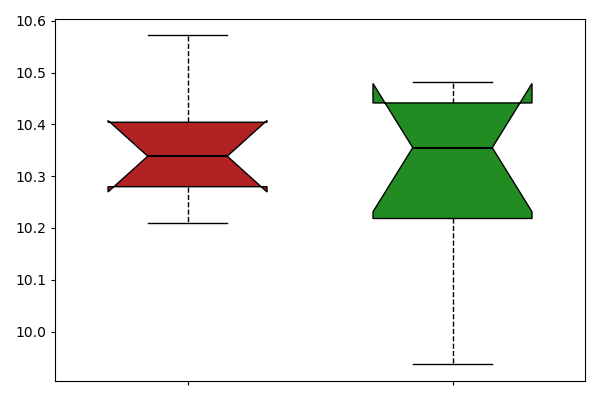
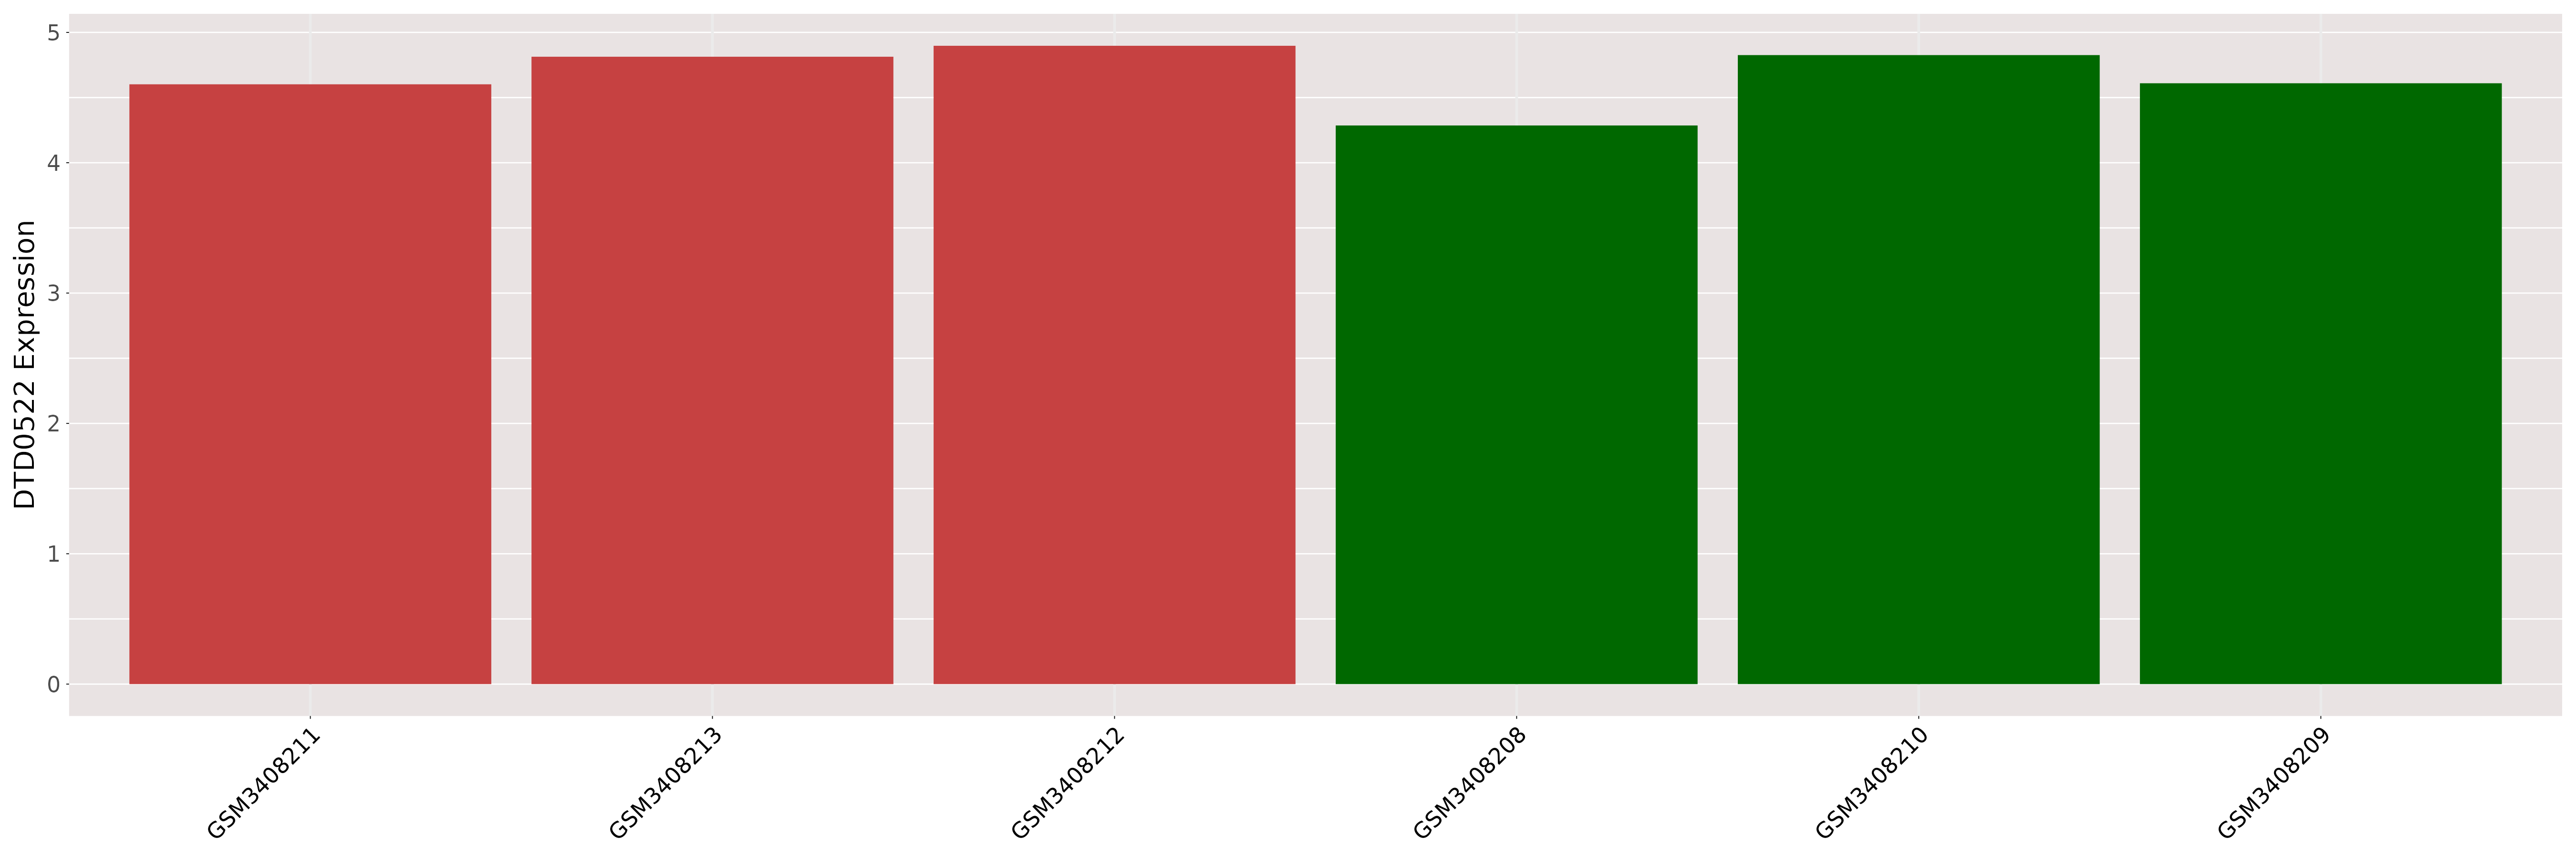
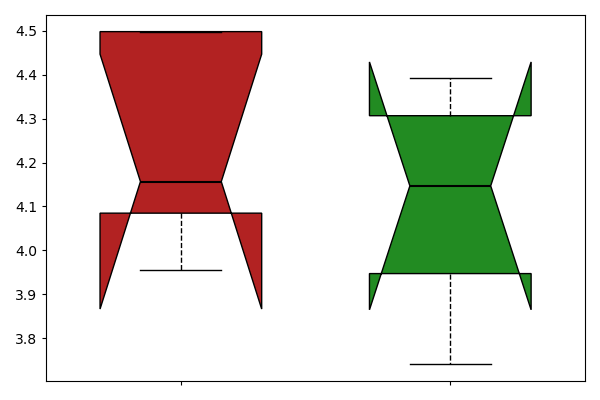
| [+] ICD-11: 5B81 Obesity | Click to Show/Hide the Full List | ||||
| The Studied Tissue | Skeletal muscle | ||||
| The Specified Disease | Obesity [ICD-11:5B81] | ||||
| The Expression Level of Disease Section Compare with the Healthy Individual Tissue | p-value:0.2529962177122732; Fold-change:1.0154010034662149; Z-score:0.7700160546947189 | ||||
| DT expression in the diseased tissue of patients
DT expression in the normal tissue of healthy individuals
|
|||||
|
 Please Click the above Thumbnail to View/Download
the Expression Barchart for All Samples Please Click the above Thumbnail to View/Download
the Expression Barchart for All Samples
|
||||
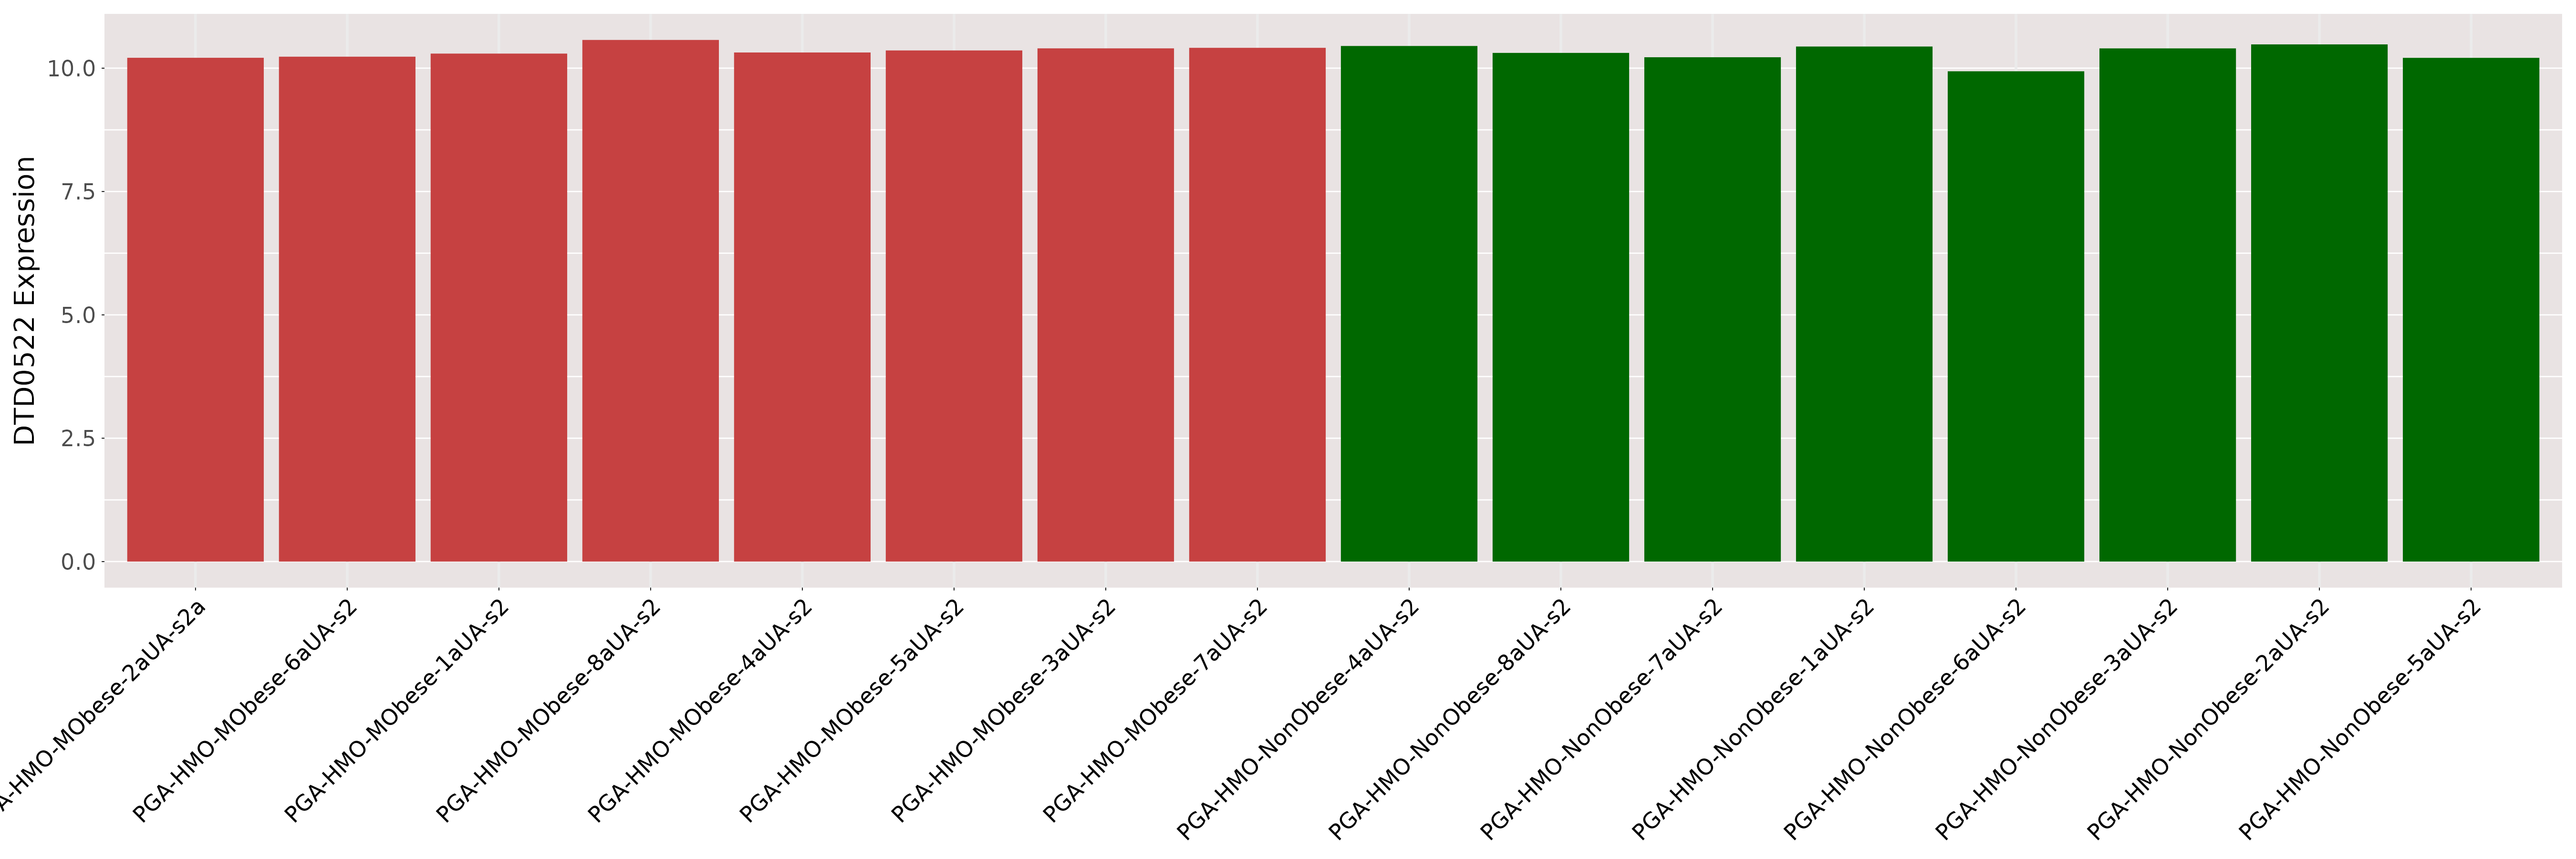
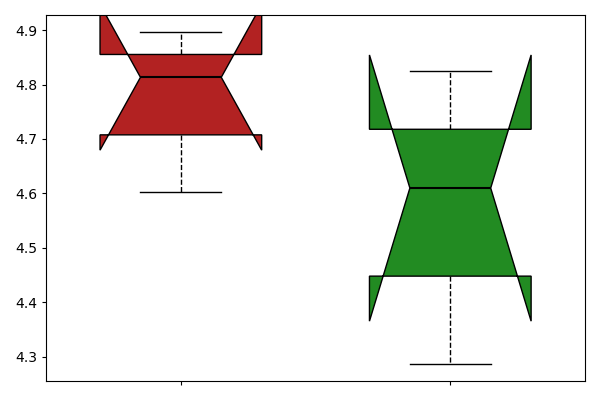
| [+] ICD-11: 5B81 Obesity (morbid obesity) | Click to Show/Hide the Full List | ||||
| The Studied Tissue | Skeletal muscle | ||||
| The Specified Disease | Morbidly obese [ICD-11:5B81] | ||||
| The Expression Level of Disease Section Compare with the Healthy Individual Tissue | p-value:0.5701724525047337; Fold-change:0.9984039663493542; Z-score:0.2434883863070717 | ||||
| DT expression in the diseased tissue of patients
DT expression in the normal tissue of healthy individuals
|
|||||
|
 Please Click the above Thumbnail to View/Download
the Expression Barchart for All Samples Please Click the above Thumbnail to View/Download
the Expression Barchart for All Samples
|
||||
| [+] ICD-11: 5C50.E0 Classical organic aciduria (Methylmalonic acidemia) | Click to Show/Hide the Full List | ||||
| The Studied Tissue | Kidney | ||||
| The Specified Disease | Methylmalonic acidemia [ICD-11:5C50.E0] | ||||
| The Expression Level of Disease Section Compare with the Healthy Individual Tissue | p-value:0.3349399646105465; Fold-change:1.0441693327885326; Z-score:0.72486790663126 | ||||
| DT expression in the diseased tissue of patients
DT expression in the normal tissue of healthy individuals
|
|||||
|
 Please Click the above Thumbnail to View/Download
the Expression Barchart for All Samples Please Click the above Thumbnail to View/Download
the Expression Barchart for All Samples
|
||||
| [+] ICD-11: 5C56.0Y Gaucher disease (non-neuronopathic Type 1) | Click to Show/Hide the Full List | ||||
| The Studied Tissue | Skin | ||||
| The Specified Disease | Gaucher disease type 1 [ICD-11:5C56.0Y] | ||||
| The Expression Level of Disease Section Compare with the Healthy Individual Tissue | p-value:0.3632603334280028; Fold-change:1.0023561063820774; Z-score:1.2917758795416985 | ||||
| DT expression in the diseased tissue of patients
DT expression in the normal tissue of healthy individuals
|
|||||
|
 Please Click the above Thumbnail to View/Download
the Expression Barchart for All Samples Please Click the above Thumbnail to View/Download
the Expression Barchart for All Samples
|
||||
| [+] ICD-11: 5C56.0Y Gaucher disease (subacute neuronopathic Type 3) | Click to Show/Hide the Full List | ||||
| The Studied Tissue | Skin | ||||
| The Specified Disease | Gaucher disease type 3 [ICD-11:5C56.0Y] | ||||
| The Expression Level of Disease Section Compare with the Healthy Individual Tissue | p-value:0.1420829404893235; Fold-change:1.065659662024919; Z-score:2.4940279643961225 | ||||
| DT expression in the diseased tissue of patients
DT expression in the normal tissue of healthy individuals
|
|||||

|
 Please Click the above Thumbnail to View/Download
the Expression Barchart for All Samples Please Click the above Thumbnail to View/Download
the Expression Barchart for All Samples
|
||||
| [+] ICD-11: 5C57.1 X-linked adrenoleukodystrophy | Click to Show/Hide the Full List | ||||
| The Studied Tissue | Dermis | ||||
| The Specified Disease | X linked cerebral adrenoleukodystrophy [ICD-11:5C57.1] | ||||
| The Expression Level of Disease Section Compare with the Healthy Individual Tissue | p-value:0.1418298462360661; Fold-change:0.9747048605208524; Z-score:-1.11526071 | ||||
| DT expression in the diseased tissue of patients
DT expression in the normal tissue of healthy individuals
|
|||||
|
 Please Click the above Thumbnail to View/Download
the Expression Barchart for All Samples Please Click the above Thumbnail to View/Download
the Expression Barchart for All Samples
|
||||
| ICD-11: 06 Mental, behavioural or neurodevelopmental disorder | |||||
| [+] ICD-11: 6A02 Autism spectrum disorder | Click to Show/Hide the Full List | ||||
| The Studied Tissue | Brain | ||||
| The Specified Disease | Autism [ICD-11:6A02] | ||||
| The Expression Level of Disease Section Compare with the Healthy Individual Tissue | p-value:5.572615513939803e-06; Fold-change:0.2796575621687729; Z-score:-4.906188584 | ||||
| DT expression in the diseased tissue of patients
DT expression in the normal tissue of healthy individuals
|
|||||
|
 Please Click the above Thumbnail to View/Download
the Expression Barchart for All Samples Please Click the above Thumbnail to View/Download
the Expression Barchart for All Samples
|
||||
| [+] ICD-11: 6A20 Schizophrenia | Click to Show/Hide the Full List | ||||
| The Studied Tissue | Brodmann (1909) area 9 | ||||
| The Specified Disease | Schizophrenia [ICD-11:6A20] | ||||
| The Expression Level of Disease Section Compare with the Healthy Individual Tissue | p-value:0.9905956392924276; Fold-change:0.8876146788990825; Z-score:-0.007285445 | ||||
| DT expression in the diseased tissue of patients
DT expression in the normal tissue of healthy individuals
|
|||||
_area_9-1.png)
|
_area_9.png) Please Click the above Thumbnail to View/Download
the Expression Barchart for All Samples Please Click the above Thumbnail to View/Download
the Expression Barchart for All Samples
|
||||
| The Studied Tissue | Brodmann (1909) area 11 | ||||
| The Specified Disease | Schizophrenia [ICD-11:6A20] | ||||
| The Expression Level of Disease Section Compare with the Healthy Individual Tissue | p-value:0.1393762093509417; Fold-change:0.9791183294663574; Z-score:-0.460175168 | ||||
| DT expression in the diseased tissue of patients
DT expression in the normal tissue of healthy individuals
|
|||||
_area_11-1.png)
|
_area_11.png) Please Click the above Thumbnail to View/Download
the Expression Barchart for All Samples Please Click the above Thumbnail to View/Download
the Expression Barchart for All Samples
|
||||
| The Studied Tissue | Brodmann (1909) area 24 | ||||
| The Specified Disease | Schizophrenia [ICD-11:6A20] | ||||
| The Expression Level of Disease Section Compare with the Healthy Individual Tissue | p-value:0.0237338382111142; Fold-change:0.6018957345971564; Z-score:-1.212798343 | ||||
| DT expression in the diseased tissue of patients
DT expression in the normal tissue of healthy individuals
|
|||||
_area_24-1.png)
|
_area_24.png) Please Click the above Thumbnail to View/Download
the Expression Barchart for All Samples Please Click the above Thumbnail to View/Download
the Expression Barchart for All Samples
|
||||
| [+] ICD-11: 6A60 Bipolar type I disorder (Bipolar disorder) | Click to Show/Hide the Full List | ||||
| The Studied Tissue | Brodmann (1909) area 9 | ||||
| The Specified Disease | Bipolar disorder [ICD-11:6A60] | ||||
| The Expression Level of Disease Section Compare with the Healthy Individual Tissue | p-value:0.1313858448337795; Fold-change:1.2064220183486238; Z-score:0.987177818226072 | ||||
| DT expression in the diseased tissue of patients
DT expression in the normal tissue of healthy individuals
|
|||||
_area_9-1.png)
|
_area_9.png) Please Click the above Thumbnail to View/Download
the Expression Barchart for All Samples Please Click the above Thumbnail to View/Download
the Expression Barchart for All Samples
|
||||
| The Studied Tissue | Brodmann (1909) area 11 | ||||
| The Specified Disease | Bipolar disorder [ICD-11:6A60] | ||||
| The Expression Level of Disease Section Compare with the Healthy Individual Tissue | p-value:0.0656429097290185; Fold-change:0.8352668213457076; Z-score:-0.752846574 | ||||
| DT expression in the diseased tissue of patients
DT expression in the normal tissue of healthy individuals
|
|||||
_area_11-1.png)
|
_area_11.png) Please Click the above Thumbnail to View/Download
the Expression Barchart for All Samples Please Click the above Thumbnail to View/Download
the Expression Barchart for All Samples
|
||||
| The Studied Tissue | Brodmann (1909) area 24 | ||||
| The Specified Disease | Bipolar disorder [ICD-11:6A60] | ||||
| The Expression Level of Disease Section Compare with the Healthy Individual Tissue | p-value:0.6377094373560732; Fold-change:0.971563981042654; Z-score:-0.301049234 | ||||
| DT expression in the diseased tissue of patients
DT expression in the normal tissue of healthy individuals
|
|||||
_area_24-1.png)
|
_area_24.png) Please Click the above Thumbnail to View/Download
the Expression Barchart for All Samples Please Click the above Thumbnail to View/Download
the Expression Barchart for All Samples
|
||||
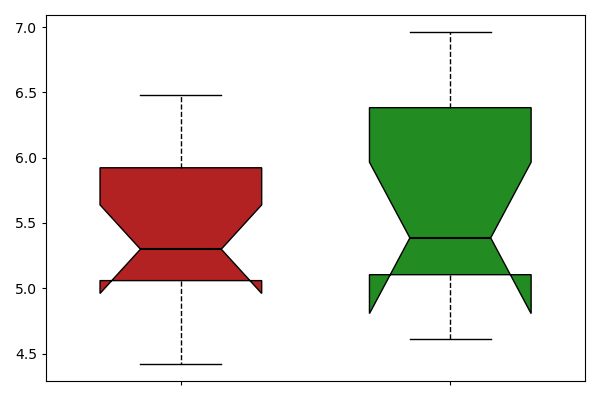
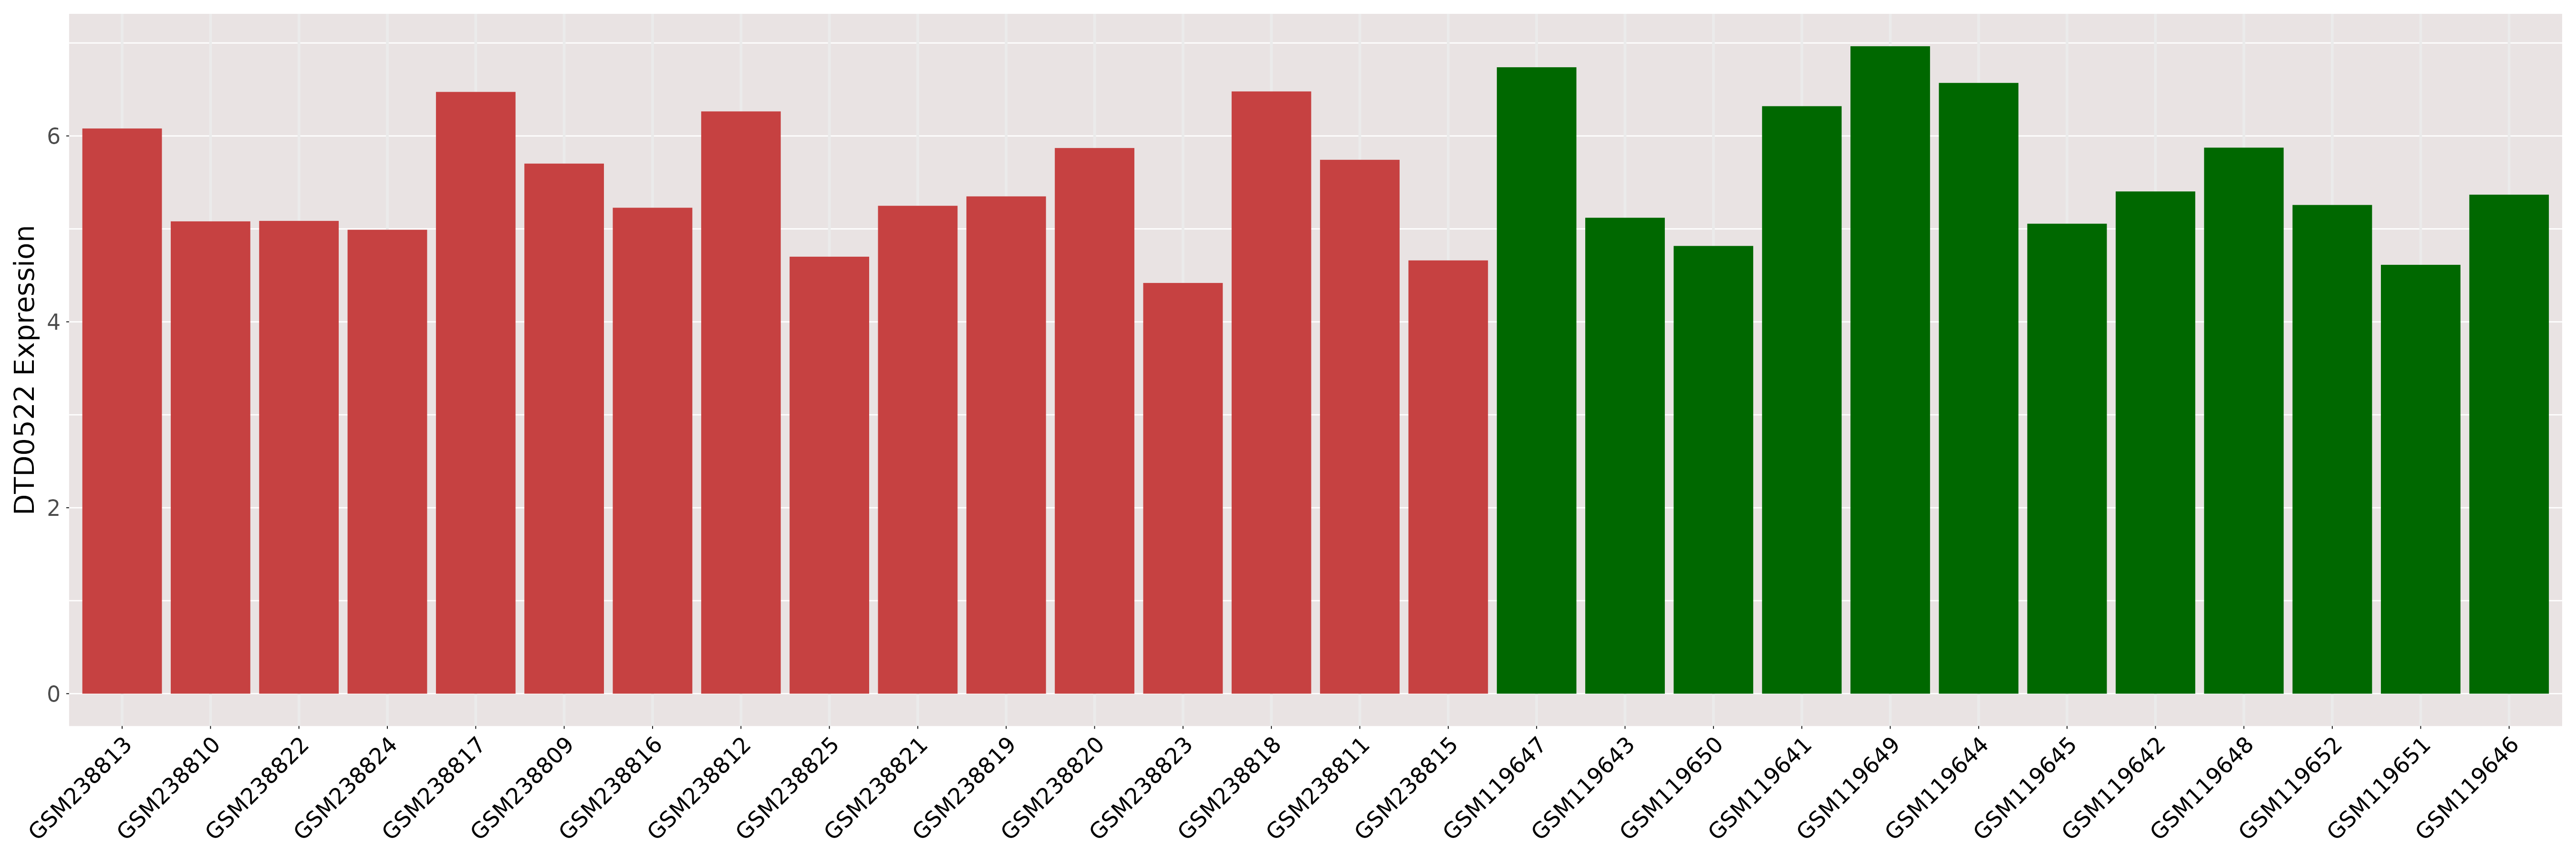
| The Studied Tissue | Dorsolateral prefrontal cortex | ||||
| The Specified Disease | Bipolar disorder [ICD-11:6A60] | ||||
| The Expression Level of Disease Section Compare with the Healthy Individual Tissue | p-value:0.7908355677198848; Fold-change:0.7472698907956318; Z-score:-0.066748322 | ||||
| DT expression in the diseased tissue of patients
DT expression in the normal tissue of healthy individuals
|
|||||

|
 Please Click the above Thumbnail to View/Download
the Expression Barchart for All Samples Please Click the above Thumbnail to View/Download
the Expression Barchart for All Samples
|
||||
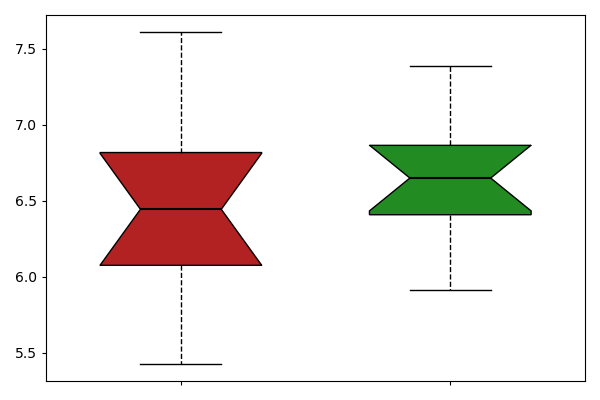
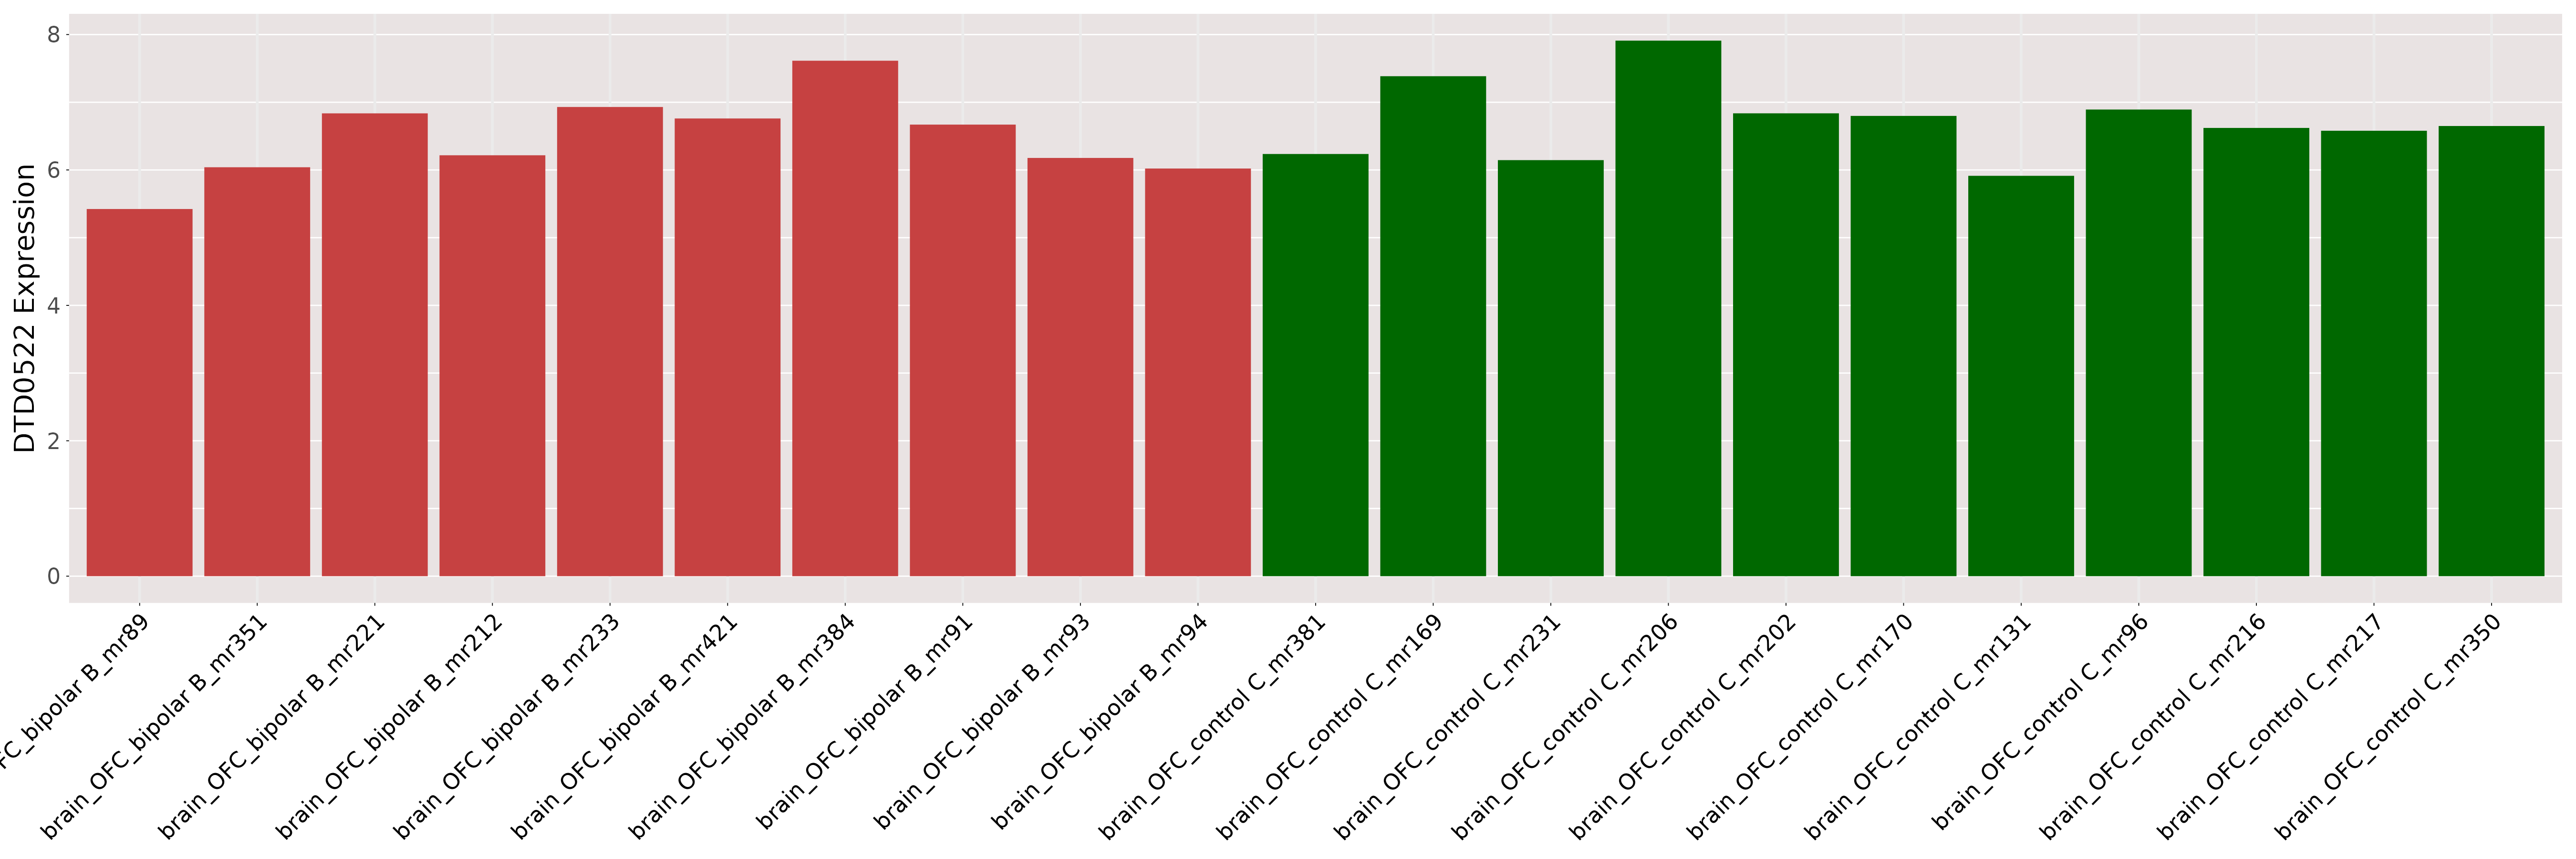
| The Studied Tissue | Orbitofrontal cortex | ||||
| The Specified Disease | Bipolar disorder [ICD-11:6A60] | ||||
| The Expression Level of Disease Section Compare with the Healthy Individual Tissue | p-value:0.33283413556705; Fold-change:0.9690631603067478; Z-score:-0.454262603 | ||||
| DT expression in the diseased tissue of patients
DT expression in the normal tissue of healthy individuals
|
|||||
|
 Please Click the above Thumbnail to View/Download
the Expression Barchart for All Samples Please Click the above Thumbnail to View/Download
the Expression Barchart for All Samples
|
||||
| ICD-11: 08 Disease of the nervous system | |||||
| [+] ICD-11: 8A20 Alzheimer disease | Click to Show/Hide the Full List | ||||
| The Studied Tissue | Middle temporal gyrus | ||||
| The Specified Disease | Alzheimer's disease [ICD-11:8A20] | ||||
| The Expression Level of Disease Section Compare with the Healthy Individual Tissue | p-value:0.4394629032503823; Fold-change:0.983972418233652; Z-score:-0.269445659 | ||||
| DT expression in the diseased tissue of patients
DT expression in the normal tissue of healthy individuals
|
|||||
|
 Please Click the above Thumbnail to View/Download
the Expression Barchart for All Samples Please Click the above Thumbnail to View/Download
the Expression Barchart for All Samples
|
||||
| The Studied Tissue | Postcentral gyrus | ||||
| The Specified Disease | Alzheimer's disease [ICD-11:8A20] | ||||
| The Expression Level of Disease Section Compare with the Healthy Individual Tissue | p-value:0.1413485187276975; Fold-change:0.9721271236009386; Z-score:-0.351420752 | ||||
| DT expression in the diseased tissue of patients
DT expression in the normal tissue of healthy individuals
|
|||||
|
 Please Click the above Thumbnail to View/Download
the Expression Barchart for All Samples Please Click the above Thumbnail to View/Download
the Expression Barchart for All Samples
|
||||
| The Studied Tissue | Posterior cingulate cortex | ||||
| The Specified Disease | Alzheimer's disease [ICD-11:8A20] | ||||
| The Expression Level of Disease Section Compare with the Healthy Individual Tissue | p-value:0.2500308247433402; Fold-change:0.8709677085213899; Z-score:-0.438255142 | ||||
| DT expression in the diseased tissue of patients
DT expression in the normal tissue of healthy individuals
|
|||||
|
 Please Click the above Thumbnail to View/Download
the Expression Barchart for All Samples Please Click the above Thumbnail to View/Download
the Expression Barchart for All Samples
|
||||
| The Studied Tissue | Primary visual cortex | ||||
| The Specified Disease | Alzheimer's disease [ICD-11:8A20] | ||||
| The Expression Level of Disease Section Compare with the Healthy Individual Tissue | p-value:0.0023288394195415; Fold-change:0.8493239027357118; Z-score:-1.264871446 | ||||
| DT expression in the diseased tissue of patients
DT expression in the normal tissue of healthy individuals
|
|||||
|
 Please Click the above Thumbnail to View/Download
the Expression Barchart for All Samples Please Click the above Thumbnail to View/Download
the Expression Barchart for All Samples
|
||||
| The Studied Tissue | Superior frontal gyrus | ||||
| The Specified Disease | Alzheimer's disease [ICD-11:8A20] | ||||
| The Expression Level of Disease Section Compare with the Healthy Individual Tissue | p-value:0.0009317858919119; Fold-change:0.9537324221012748; Z-score:-0.900255576 | ||||
| DT expression in the diseased tissue of patients
DT expression in the normal tissue of healthy individuals
|
|||||
|
 Please Click the above Thumbnail to View/Download
the Expression Barchart for All Samples Please Click the above Thumbnail to View/Download
the Expression Barchart for All Samples
|
||||
| [+] ICD-11: 8B44.0 Hereditary spastic paraplegia | Click to Show/Hide the Full List | ||||
| The Studied Tissue | Skeletal muscle | ||||
| The Specified Disease | Hereditary spastic paraplegia [ICD-11:8B44.0] | ||||
| The Expression Level of Disease Section Compare with the Healthy Individual Tissue | p-value:0.9497162984106982; Fold-change:1.0031726593322818; Z-score:-0.034294812 | ||||
| DT expression in the diseased tissue of patients
DT expression in the normal tissue of healthy individuals
|
|||||
|
 Please Click the above Thumbnail to View/Download
the Expression Barchart for All Samples Please Click the above Thumbnail to View/Download
the Expression Barchart for All Samples
|
||||
| [+] ICD-11: 8B60.0 Amyotrophic lateral sclerosis | Click to Show/Hide the Full List | ||||
| The Studied Tissue | Skeletal muscle | ||||
| The Specified Disease | Amyotrophic lateral sclerosis [ICD-11:8B60.0] | ||||
| The Expression Level of Disease Section Compare with the Healthy Individual Tissue | p-value:0.084583420380956; Fold-change:0.96614889546377; Z-score:-0.698914531 | ||||
| DT expression in the diseased tissue of patients
DT expression in the normal tissue of healthy individuals
|
|||||
|
 Please Click the above Thumbnail to View/Download
the Expression Barchart for All Samples Please Click the above Thumbnail to View/Download
the Expression Barchart for All Samples
|
||||
| [+] ICD-11: 8C70.1 Duchenne muscular dystrophy | Click to Show/Hide the Full List | ||||
| The Studied Tissue | Skeletal muscle | ||||
| The Specified Disease | Duchenne muscular dystrophy [ICD-11:8C70.1] | ||||
| The Expression Level of Disease Section Compare with the Healthy Individual Tissue | p-value:0.0131073643288847; Fold-change:0.9749347283874966; Z-score:-0.940065824 | ||||
| DT expression in the diseased tissue of patients
DT expression in the normal tissue of healthy individuals
|
|||||
|
 Please Click the above Thumbnail to View/Download
the Expression Barchart for All Samples Please Click the above Thumbnail to View/Download
the Expression Barchart for All Samples
|
||||
| [+] ICD-11: 8C70.1 Duchenne/Becker muscular dystrophy | Click to Show/Hide the Full List | ||||
| The Studied Tissue | Skeletal muscle | ||||
| The Specified Disease | Becker muscular dystrophy [ICD-11:8C70.0] | ||||
| The Expression Level of Disease Section Compare with the Healthy Individual Tissue | p-value:0.1064266028828742; Fold-change:0.9847973792267144; Z-score:-0.863265486 | ||||
| DT expression in the diseased tissue of patients
DT expression in the normal tissue of healthy individuals
|
|||||
|
 Please Click the above Thumbnail to View/Download
the Expression Barchart for All Samples Please Click the above Thumbnail to View/Download
the Expression Barchart for All Samples
|
||||
| [+] ICD-11: 8C70.2 Emery-Dreifuss muscular dystrophy | Click to Show/Hide the Full List | ||||
| The Studied Tissue | Skeletal muscle | ||||
| The Specified Disease | Autosomal dominant emery dreifuss muscular dystrophy [ICD-11:8C70.2] | ||||
| The Expression Level of Disease Section Compare with the Healthy Individual Tissue | p-value:0.0134143855781764; Fold-change:0.9689779978911148; Z-score:-1.471119496 | ||||
| DT expression in the diseased tissue of patients
DT expression in the normal tissue of healthy individuals
|
|||||
|
 Please Click the above Thumbnail to View/Download
the Expression Barchart for All Samples Please Click the above Thumbnail to View/Download
the Expression Barchart for All Samples
|
||||
| The Studied Tissue | Skeletal muscle | ||||
| The Specified Disease | X linked recessive emery dreifuss muscular dystrophy [ICD-11:8C70.2] | ||||
| The Expression Level of Disease Section Compare with the Healthy Individual Tissue | p-value:0.7145376957376359; Fold-change:0.9945866110298224; Z-score:-0.197402431 | ||||
| DT expression in the diseased tissue of patients
DT expression in the normal tissue of healthy individuals
|
|||||

|
 Please Click the above Thumbnail to View/Download
the Expression Barchart for All Samples Please Click the above Thumbnail to View/Download
the Expression Barchart for All Samples
|
||||
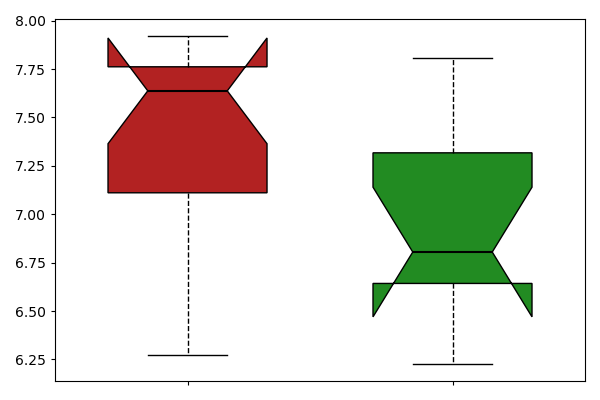
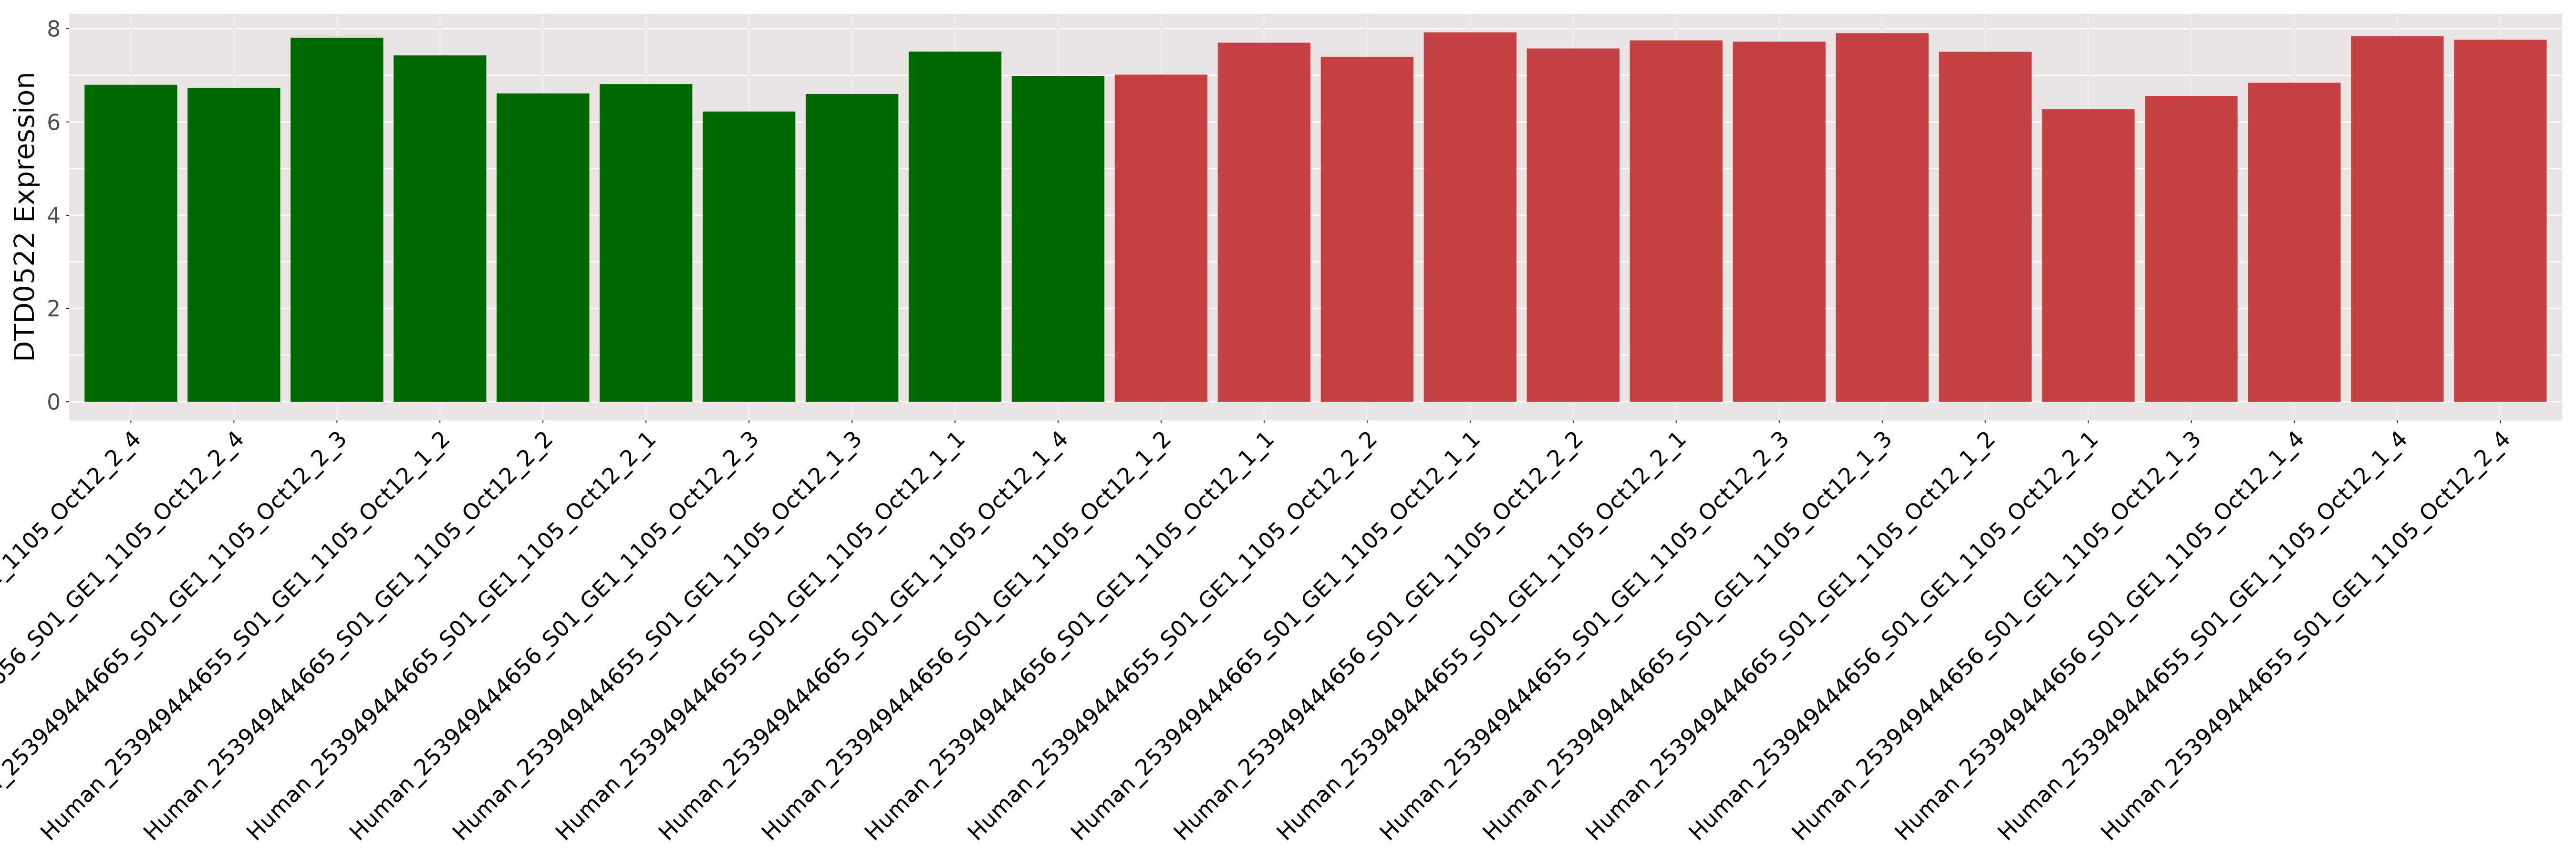
| [+] ICD-11: 8C70.3 Facioscapulohumeral muscular dystrophy | Click to Show/Hide the Full List | ||||
| The Studied Tissue | Muscle | ||||
| The Specified Disease | Facioscapulohumeral dystrophy [ICD-11:8C70.3] | ||||
| The Expression Level of Disease Section Compare with the Healthy Individual Tissue | p-value:0.2144700602765357; Fold-change:1.0952380952380951; Z-score:0.5963676849740109 | ||||
| DT expression in the diseased tissue of patients
DT expression in the normal tissue of healthy individuals
|
|||||
|
 Please Click the above Thumbnail to View/Download
the Expression Barchart for All Samples Please Click the above Thumbnail to View/Download
the Expression Barchart for All Samples
|
||||
| The Studied Tissue | Myoblast | ||||
| The Specified Disease | Facioscapulohumeral dystrophy [ICD-11:8C70.3] | ||||
| The Expression Level of Disease Section Compare with the Healthy Individual Tissue | p-value:0.1136861024775557; Fold-change:0.3103448275862069; Z-score:-0.954594155 | ||||
| DT expression in the diseased tissue of patients
DT expression in the normal tissue of healthy individuals
|
|||||
|
 Please Click the above Thumbnail to View/Download
the Expression Barchart for All Samples Please Click the above Thumbnail to View/Download
the Expression Barchart for All Samples
|
||||
| The Studied Tissue | Myotube | ||||
| The Specified Disease | Facioscapulohumeral dystrophy [ICD-11:8C70.3] | ||||
| The Expression Level of Disease Section Compare with the Healthy Individual Tissue | p-value:0.1763098336644009; Fold-change:3.590909090909091; Z-score:1.2796895168269729 | ||||
| DT expression in the diseased tissue of patients
DT expression in the normal tissue of healthy individuals
|
|||||
|
 Please Click the above Thumbnail to View/Download
the Expression Barchart for All Samples Please Click the above Thumbnail to View/Download
the Expression Barchart for All Samples
|
||||
| The Studied Tissue | Skeletal muscle | ||||
| The Specified Disease | Fascioscapulohumeral muscular dystrophy [ICD-11:8C70.3] | ||||
| The Expression Level of Disease Section Compare with the Healthy Individual Tissue | p-value:0.0012452957806499; Fold-change:0.9438757197421062; Z-score:-1.3920994 | ||||
| DT expression in the diseased tissue of patients
DT expression in the normal tissue of healthy individuals
|
|||||
| [+] ICD-11: 8C70.4 Limb-girdle muscular dystrophy | Click to Show/Hide the Full List | ||||
| The Studied Tissue | Skeletal muscle | ||||
| The Specified Disease | Limb girdle muscular dystrophy 2a [ICD-11:8C70.4] | ||||
| The Expression Level of Disease Section Compare with the Healthy Individual Tissue | p-value:0.1817460095972815; Fold-change:0.98678882504249; Z-score:-0.532440106 | ||||
| DT expression in the diseased tissue of patients
DT expression in the normal tissue of healthy individuals
|
|||||
|
 Please Click the above Thumbnail to View/Download
the Expression Barchart for All Samples Please Click the above Thumbnail to View/Download
the Expression Barchart for All Samples
|
||||
| The Studied Tissue | Skeletal muscle | ||||
| The Specified Disease | Limb girdle muscular dystrophy 2b [ICD-11:8C70.4] | ||||
| The Expression Level of Disease Section Compare with the Healthy Individual Tissue | p-value:0.0220837382324479; Fold-change:0.971936701662761; Z-score:-0.883852388 | ||||
| DT expression in the diseased tissue of patients
DT expression in the normal tissue of healthy individuals
|
|||||
|
 Please Click the above Thumbnail to View/Download
the Expression Barchart for All Samples Please Click the above Thumbnail to View/Download
the Expression Barchart for All Samples
|
||||
| The Studied Tissue | Skeletal muscle | ||||
| The Specified Disease | Limb girdle muscular dystrophy 2i [ICD-11:8C70.4] | ||||
| The Expression Level of Disease Section Compare with the Healthy Individual Tissue | p-value:0.0496031436326378; Fold-change:0.9846622836980587; Z-score:-0.831539434 | ||||
| DT expression in the diseased tissue of patients
DT expression in the normal tissue of healthy individuals
|
|||||
|
 Please Click the above Thumbnail to View/Download
the Expression Barchart for All Samples Please Click the above Thumbnail to View/Download
the Expression Barchart for All Samples
|
||||
| [+] ICD-11: 8C71.0 Myotonic dystrophy | Click to Show/Hide the Full List | ||||
| The Studied Tissue | Heart left ventricle | ||||
| The Specified Disease | Myotonic dystrophy [ICD-11:8C71.0] | ||||
| The Expression Level of Disease Section Compare with the Healthy Individual Tissue | p-value:0.482139035757041; Fold-change:0.3125; Z-score:-0.714460312 | ||||
| DT expression in the diseased tissue of patients
DT expression in the normal tissue of healthy individuals
|
|||||
|
 Please Click the above Thumbnail to View/Download
the Expression Barchart for All Samples Please Click the above Thumbnail to View/Download
the Expression Barchart for All Samples
|
||||
| [+] ICD-11: 8C81 Critical illness myopathy (acute quadriplegic myopathy) | Click to Show/Hide the Full List | ||||
| The Studied Tissue | Skeletal muscle | ||||
| The Specified Disease | Acute quadriplegic myopathy [ICD-11:8C81] | ||||
| The Expression Level of Disease Section Compare with the Healthy Individual Tissue | p-value:0.0001835659826017; Fold-change:0.9368472161056576; Z-score:-2.133284695 | ||||
| DT expression in the diseased tissue of patients
DT expression in the normal tissue of healthy individuals
|
|||||
|
 Please Click the above Thumbnail to View/Download
the Expression Barchart for All Samples Please Click the above Thumbnail to View/Download
the Expression Barchart for All Samples
|
||||
| ICD-11: 11 Disease of the circulatory system | |||||
| [+] ICD-11: BD10 Congestive heart failure | Click to Show/Hide the Full List | ||||
| The Studied Tissue | Skeletal muscle tissue | ||||
| The Specified Disease | Heart failure [ICD-11:BD10] | ||||
| The Expression Level of Disease Section Compare with the Healthy Individual Tissue | p-value:0.5882275400773602; Fold-change:1; Z-score:-0.251976315 | ||||
| DT expression in the diseased tissue of patients
DT expression in the normal tissue of healthy individuals
|
|||||
|
 Please Click the above Thumbnail to View/Download
the Expression Barchart for All Samples Please Click the above Thumbnail to View/Download
the Expression Barchart for All Samples
|
||||
| ICD-11: 13 Disease of the digestive system | |||||
| [+] ICD-11: DB91 Acute or subacute hepatic failure | Click to Show/Hide the Full List | ||||
| The Studied Tissue | Liver | ||||
| The Specified Disease | Acute liver failure [ICD-11:DB91.Z] | ||||
| The Expression Level of Disease Section Compare with the Healthy Individual Tissue | p-value:0.8270997394875244; Fold-change:1.0031470408637395; Z-score:0.1070702654367832 | ||||
| DT expression in the diseased tissue of patients
DT expression in the normal tissue of healthy individuals
|
|||||
|
 Please Click the above Thumbnail to View/Download
the Expression Barchart for All Samples Please Click the above Thumbnail to View/Download
the Expression Barchart for All Samples
|
||||
| [+] ICD-11: DB92.1 Non-alcoholic steatohepatitis | Click to Show/Hide the Full List | ||||
| The Studied Tissue | Liver | ||||
| The Specified Disease | Non alcoholic steatohepatitis [ICD-11:DB92.1] | ||||
| The Expression Level of Disease Section Compare with the Healthy Individual Tissue | p-value:0.0506297327002736; Fold-change:1.0552516305597262; Z-score:1.0811414538975666 | ||||
| DT expression in the diseased tissue of patients
DT expression in the normal tissue of healthy individuals
|
|||||
|
 Please Click the above Thumbnail to View/Download
the Expression Barchart for All Samples Please Click the above Thumbnail to View/Download
the Expression Barchart for All Samples
|
||||
| [+] ICD-11: DD70 Crohn disease | Click to Show/Hide the Full List | ||||
| The Studied Tissue | Ileum | ||||
| The Specified Disease | Crohn's disease [ICD-11:DD70.Z] | ||||
| The Expression Level of Disease Section Compare with the Healthy Individual Tissue | p-value:0.9768369158380732; Fold-change:1.0625; Z-score:-0.005047704 | ||||
| DT expression in the diseased tissue of patients
DT expression in the normal tissue of healthy individuals
|
|||||
|
 Please Click the above Thumbnail to View/Download
the Expression Barchart for All Samples Please Click the above Thumbnail to View/Download
the Expression Barchart for All Samples
|
||||
| [+] ICD-11: DD7Z Inflammatory bowel disease, unspecified | Click to Show/Hide the Full List | ||||
| The Studied Tissue | Colon | ||||
| The Specified Disease | Inflammatory bowel disease [ICD-11:DD7Z] | ||||
| The Expression Level of Disease Section Compare with the Healthy Individual Tissue | p-value:0.0845292995624591; Fold-change:0.9746405977203426; Z-score:-1.150255049 | ||||
| DT expression in the diseased tissue of patients
DT expression in the normal tissue of healthy individuals
|
|||||
|
 Please Click the above Thumbnail to View/Download
the Expression Barchart for All Samples Please Click the above Thumbnail to View/Download
the Expression Barchart for All Samples
|
||||
| The Studied Tissue | Sigmoid colon | ||||
| The Specified Disease | Inflammatory bowel disease [ICD-11:DD7Z] | ||||
| The Expression Level of Disease Section Compare with the Healthy Individual Tissue | p-value:0.804924053218601; Fold-change:1.0070954953329467; Z-score:0.0492737629435033 | ||||
| DT expression in the diseased tissue of patients
DT expression in the normal tissue of healthy individuals
|
|||||
|
 Please Click the above Thumbnail to View/Download
the Expression Barchart for All Samples Please Click the above Thumbnail to View/Download
the Expression Barchart for All Samples
|
||||
| ICD-11: 14 Disease of the skin | |||||
| [+] ICD-11: EA80 Atopic dermatitis | Click to Show/Hide the Full List | ||||
| The Studied Tissue | Skin | ||||
| The Specified Disease | Atopic eczema [ICD-11:EA80] | ||||
| The Expression Level of Disease Section Compare with the Healthy Individual Tissue | p-value:0.1283327604697946; Fold-change:1.025867100036744; Z-score:1.738926240750048 | ||||
| DT expression in the diseased tissue of patients
DT expression in the normal tissue of healthy individuals
|
|||||
|
 Please Click the above Thumbnail to View/Download
the Expression Barchart for All Samples Please Click the above Thumbnail to View/Download
the Expression Barchart for All Samples
|
||||
| [+] ICD-11: ED90.0 Rosacea | Click to Show/Hide the Full List | ||||
| The Studied Tissue | Skin | ||||
| The Specified Disease | Rosacea [ICD-11:ED90.0] | ||||
| The Expression Level of Disease Section Compare with the Healthy Individual Tissue | p-value:9.271833138375827e-11; Fold-change:1.1603272338314432; Z-score:2.3611755750486765 | ||||
| DT expression in the diseased tissue of patients
DT expression in the normal tissue of healthy individuals
|
|||||
|
 Please Click the above Thumbnail to View/Download
the Expression Barchart for All Samples Please Click the above Thumbnail to View/Download
the Expression Barchart for All Samples
|
||||
| [+] ICD-11: EK90.0 Actinic keratosis | Click to Show/Hide the Full List | ||||
| The Studied Tissue | Skin | ||||
| The Specified Disease | Actinic keratosis [ICD-11:EK90.0] | ||||
| The Expression Level of Disease Section Compare with the Healthy Individual Tissue | p-value:0.2886132454317472; Fold-change:0.5644171779141104; Z-score:-0.495837655 | ||||
| DT expression in the diseased tissue of patients
DT expression in the normal tissue of healthy individuals
|
|||||
|
 Please Click the above Thumbnail to View/Download
the Expression Barchart for All Samples Please Click the above Thumbnail to View/Download
the Expression Barchart for All Samples
|
||||
| ICD-11: 15 Disease of the musculoskeletal system/connective tissue | |||||
| [+] ICD-11: FA0Z Osteoarthritis, unspecified site | Click to Show/Hide the Full List | ||||
| The Studied Tissue | Bone | ||||
| The Specified Disease | Osteoarthritis [ICD-11:FA0Z] | ||||
| The Expression Level of Disease Section Compare with the Healthy Individual Tissue | p-value:0.0408729318308634; Fold-change:1.1223608672269447; Z-score:0.9472511767855198 | ||||
| DT expression in the diseased tissue of patients
DT expression in the normal tissue of healthy individuals
|
|||||
|
 Please Click the above Thumbnail to View/Download
the Expression Barchart for All Samples Please Click the above Thumbnail to View/Download
the Expression Barchart for All Samples
|
||||
| ICD-11: 16 Disease of the genitourinary system | |||||
| [+] ICD-11: GB61 Chronic kidney disease | Click to Show/Hide the Full List | ||||
| The Studied Tissue | Kidney | ||||
| The Specified Disease | Chronic kidney disease [ICD-11:GB61.Z] | ||||
| The Expression Level of Disease Section Compare with the Healthy Individual Tissue | p-value:0.2111643281837762; Fold-change:0.9618648026103688; Z-score:-0.575383152 | ||||
| DT expression in the diseased tissue of patients
DT expression in the normal tissue of healthy individuals
|
|||||
|
 Please Click the above Thumbnail to View/Download
the Expression Barchart for All Samples Please Click the above Thumbnail to View/Download
the Expression Barchart for All Samples
|
||||
| ICD-11: 20 Developmental anomaly | |||||
| [+] ICD-11: LA88.2 Tetralogy of Fallot | Click to Show/Hide the Full List | ||||
| The Studied Tissue | Heart ventricle | ||||
| The Specified Disease | Tetralogy of fallot [ICD-11:LA88.2] | ||||
| The Expression Level of Disease Section Compare with the Healthy Individual Tissue | p-value:0.1658455480666084; Fold-change:1.6666666666666667; Z-score:1.1950680823156226 | ||||
| DT expression in the diseased tissue of patients
DT expression in the normal tissue of healthy individuals
|
|||||
|
 Please Click the above Thumbnail to View/Download
the Expression Barchart for All Samples Please Click the above Thumbnail to View/Download
the Expression Barchart for All Samples
|
||||
| [+] ICD-11: LB70.00 Unicoronal craniosynostosis | Click to Show/Hide the Full List | ||||
| The Studied Tissue | Skull | ||||
| The Specified Disease | Coronal craniosynostosis [ICD-11:LB70.00] | ||||
| The Expression Level of Disease Section Compare with the Healthy Individual Tissue | p-value:0.4892201380779646; Fold-change:2.231884057971014; Z-score:0.6846192999225464 | ||||
| DT expression in the diseased tissue of patients
DT expression in the normal tissue of healthy individuals
|
|||||
|
 Please Click the above Thumbnail to View/Download
the Expression Barchart for All Samples Please Click the above Thumbnail to View/Download
the Expression Barchart for All Samples
|
||||
| [+] ICD-11: LB70.02 Lambdoid craniosynostosis | Click to Show/Hide the Full List | ||||
| The Studied Tissue | Skull | ||||
| The Specified Disease | Lambdoid craniosynostosis [ICD-11:LB70.3] | ||||
| The Expression Level of Disease Section Compare with the Healthy Individual Tissue | p-value:0.2951303658148668; Fold-change:2.6666666666666665; Z-score:0.9929407576890832 | ||||
| DT expression in the diseased tissue of patients
DT expression in the normal tissue of healthy individuals
|
|||||
|
 Please Click the above Thumbnail to View/Download
the Expression Barchart for All Samples Please Click the above Thumbnail to View/Download
the Expression Barchart for All Samples
|
||||
| [+] ICD-11: LB70.03 Metopic craniosynostosis | Click to Show/Hide the Full List | ||||
| The Studied Tissue | Skull | ||||
| The Specified Disease | Metopic craniosynostosis [ICD-11:LB70.2] | ||||
| The Expression Level of Disease Section Compare with the Healthy Individual Tissue | p-value:0.7934981953663524; Fold-change:0.6666666666666666; Z-score:-0.223697796 | ||||
| DT expression in the diseased tissue of patients
DT expression in the normal tissue of healthy individuals
|
|||||
|
 Please Click the above Thumbnail to View/Download
the Expression Barchart for All Samples Please Click the above Thumbnail to View/Download
the Expression Barchart for All Samples
|
||||
| [+] ICD-11: LB70.0Y Sagittal craniosynostosis | Click to Show/Hide the Full List | ||||
| The Studied Tissue | Skull | ||||
| The Specified Disease | Sagittal craniosynostosis [ICD-11:LB70.1] | ||||
| The Expression Level of Disease Section Compare with the Healthy Individual Tissue | p-value:0.8526499794461264; Fold-change:1.0434782608695652; Z-score:0.1849928746599221 | ||||
| DT expression in the diseased tissue of patients
DT expression in the normal tissue of healthy individuals
|
|||||
|
 Please Click the above Thumbnail to View/Download
the Expression Barchart for All Samples Please Click the above Thumbnail to View/Download
the Expression Barchart for All Samples
|
||||
| [+] ICD-11: LC02 Sebaceous naevus (nevus sebaceus of Jadassohn) | Click to Show/Hide the Full List | ||||
| The Studied Tissue | Skin | ||||
| The Specified Disease | Sebaceous of jadassohn nevus [ICD-11:LD2D.Y] | ||||
| The Expression Level of Disease Section Compare with the Healthy Individual Tissue | p-value:0.3981349057184541; Fold-change:0.661042944785276; Z-score:-0.490652425 | ||||
| DT expression in the diseased tissue of patients
DT expression in the normal tissue of healthy individuals
|
|||||
|
 Please Click the above Thumbnail to View/Download
the Expression Barchart for All Samples Please Click the above Thumbnail to View/Download
the Expression Barchart for All Samples
|
||||
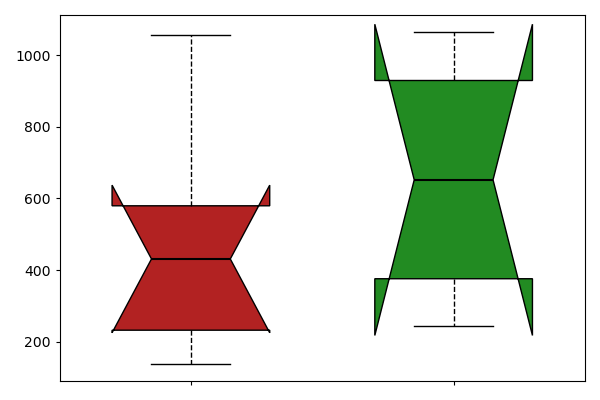
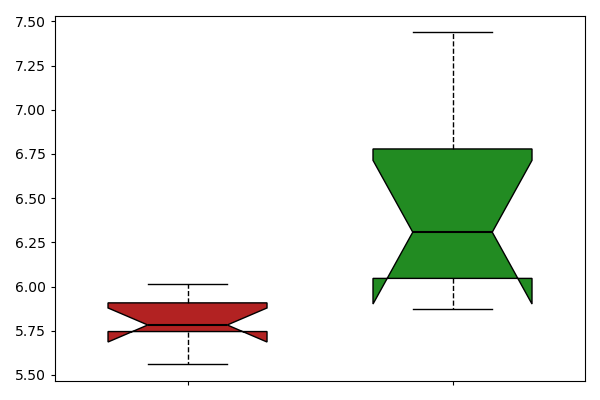
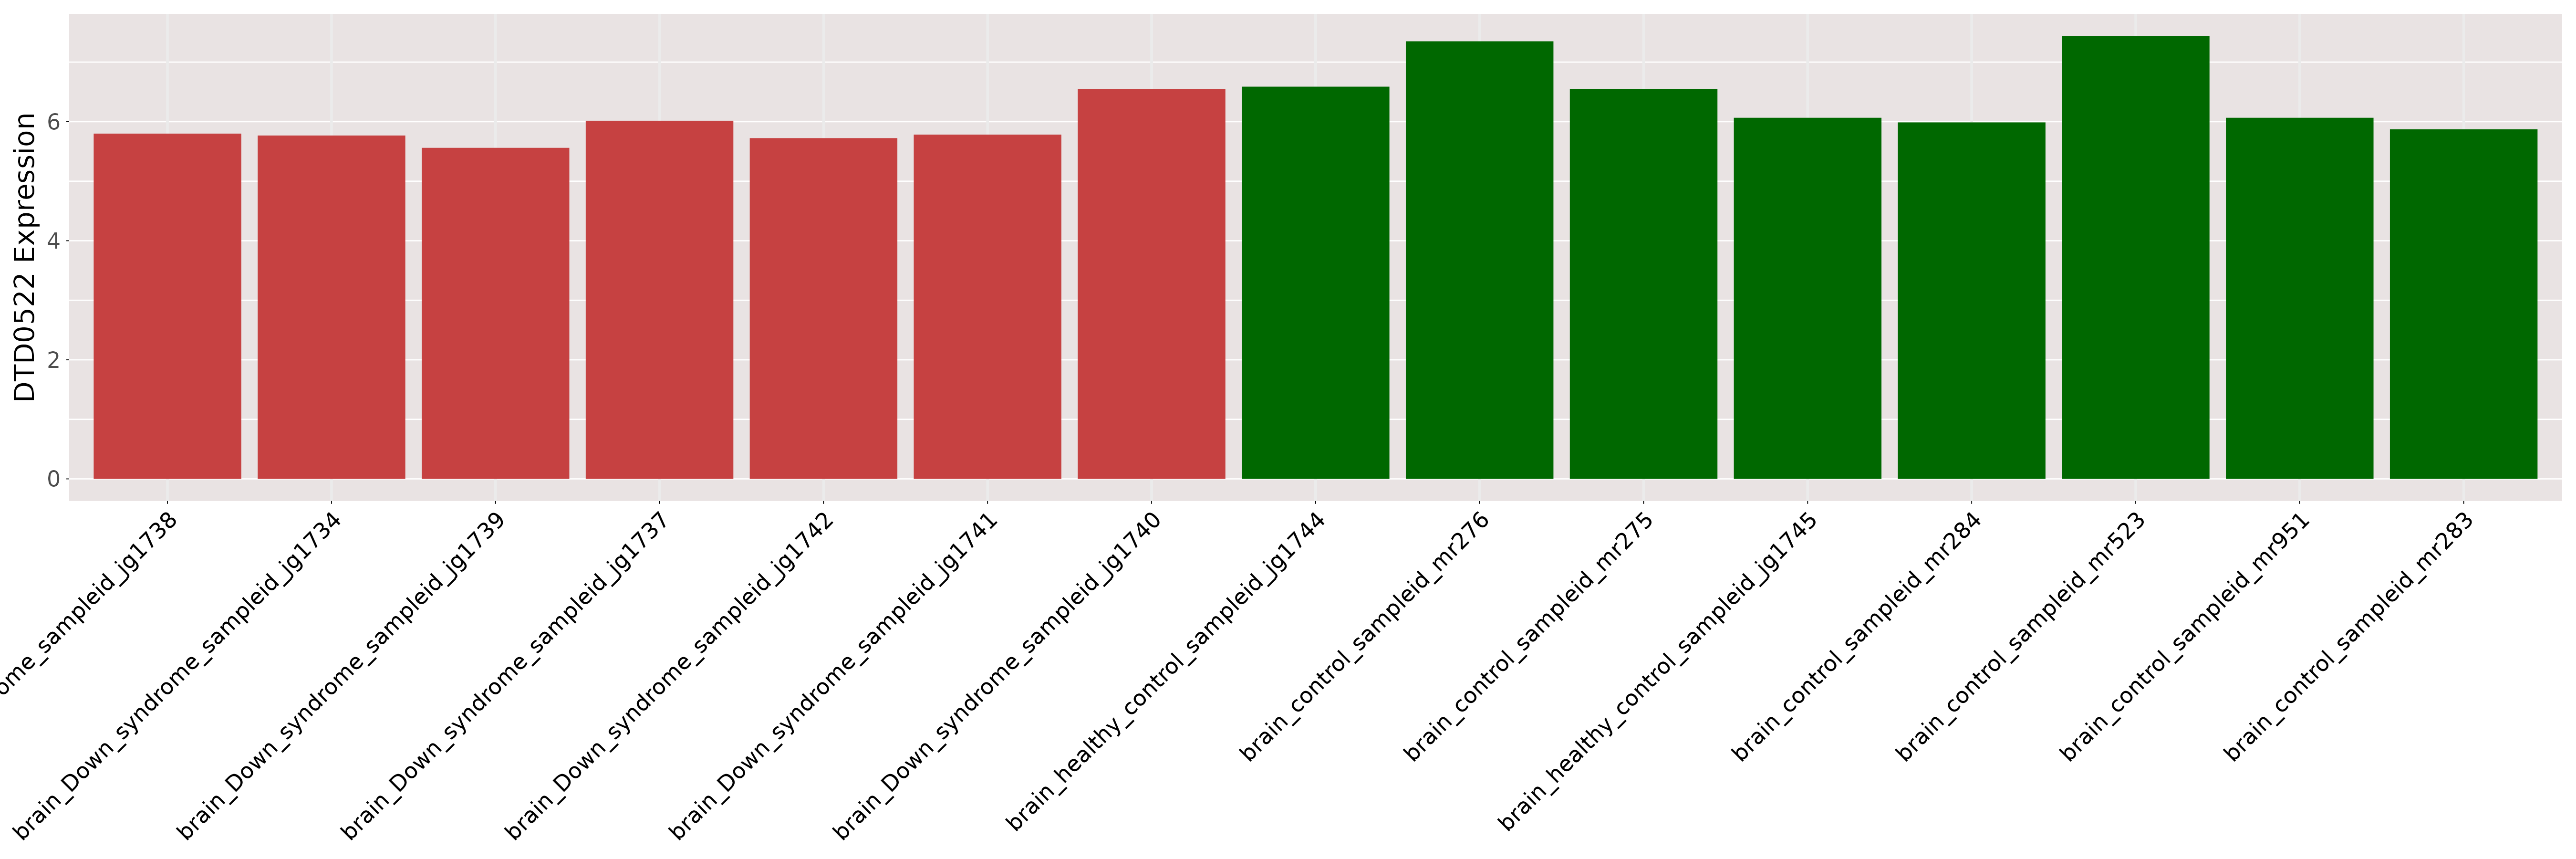
| [+] ICD-11: LD40.0 Complete trisomy 21 (Down syndrome) | Click to Show/Hide the Full List | ||||
| The Studied Tissue | Brain | ||||
| The Specified Disease | Down syndrome [ICD-11:LD40.0] | ||||
| The Expression Level of Disease Section Compare with the Healthy Individual Tissue | p-value:0.0368187110866306; Fold-change:0.9167731272400922; Z-score:-0.981775868 | ||||
| DT expression in the diseased tissue of patients
DT expression in the normal tissue of healthy individuals
|
|||||
|
 Please Click the above Thumbnail to View/Download
the Expression Barchart for All Samples Please Click the above Thumbnail to View/Download
the Expression Barchart for All Samples
|
||||
| ICD-11: 25 Codes for special purposes | |||||
| [+] ICD-11: RA01 COVID-19 | Click to Show/Hide the Full List | ||||
| The Studied Tissue | Lung | ||||
| The Specified Disease | Covid [ICD-11:RA01.0] | ||||
| The Expression Level of Disease Section Compare with the Healthy Individual Tissue | p-value:0.0328383157267728; Fold-change:0.5029797377830751; Z-score:-0.806129732 | ||||
| DT expression in the diseased tissue of patients
DT expression in the normal tissue of healthy individuals
|
|||||
|
 Please Click the above Thumbnail to View/Download
the Expression Barchart for All Samples Please Click the above Thumbnail to View/Download
the Expression Barchart for All Samples
|
||||
| The Studied Tissue | Colon | ||||
| The Specified Disease | Covid [ICD-11:RA01.0] | ||||
| The Expression Level of Disease Section Compare with the Healthy Individual Tissue | p-value:0.824218302459756; Fold-change:0.8170212765957446; Z-score:0.214002682666006 | ||||
| DT expression in the diseased tissue of patients
DT expression in the normal tissue of healthy individuals
|
|||||
|
 Please Click the above Thumbnail to View/Download
the Expression Barchart for All Samples Please Click the above Thumbnail to View/Download
the Expression Barchart for All Samples
|
||||
| ICD-11: 28 Extension Codes | |||||
| [+] ICD-11: XH12D2 Pilocytic astrocytoma | Click to Show/Hide the Full List | ||||
| The Studied Tissue | Brain | ||||
| The Specified Disease | Astrocytoma, pilocytic [ICD-11:XH12D2] | ||||
| The Expression Level of Disease Section Compare with the Healthy Individual Tissue | p-value:2.2608662150651997e-09; Fold-change:0.7752093062465292; Z-score:-3.138481137 | ||||
| DT expression in the diseased tissue of patients
DT expression in the normal tissue of healthy individuals
|
|||||
|
 Please Click the above Thumbnail to View/Download
the Expression Barchart for All Samples Please Click the above Thumbnail to View/Download
the Expression Barchart for All Samples
|
||||
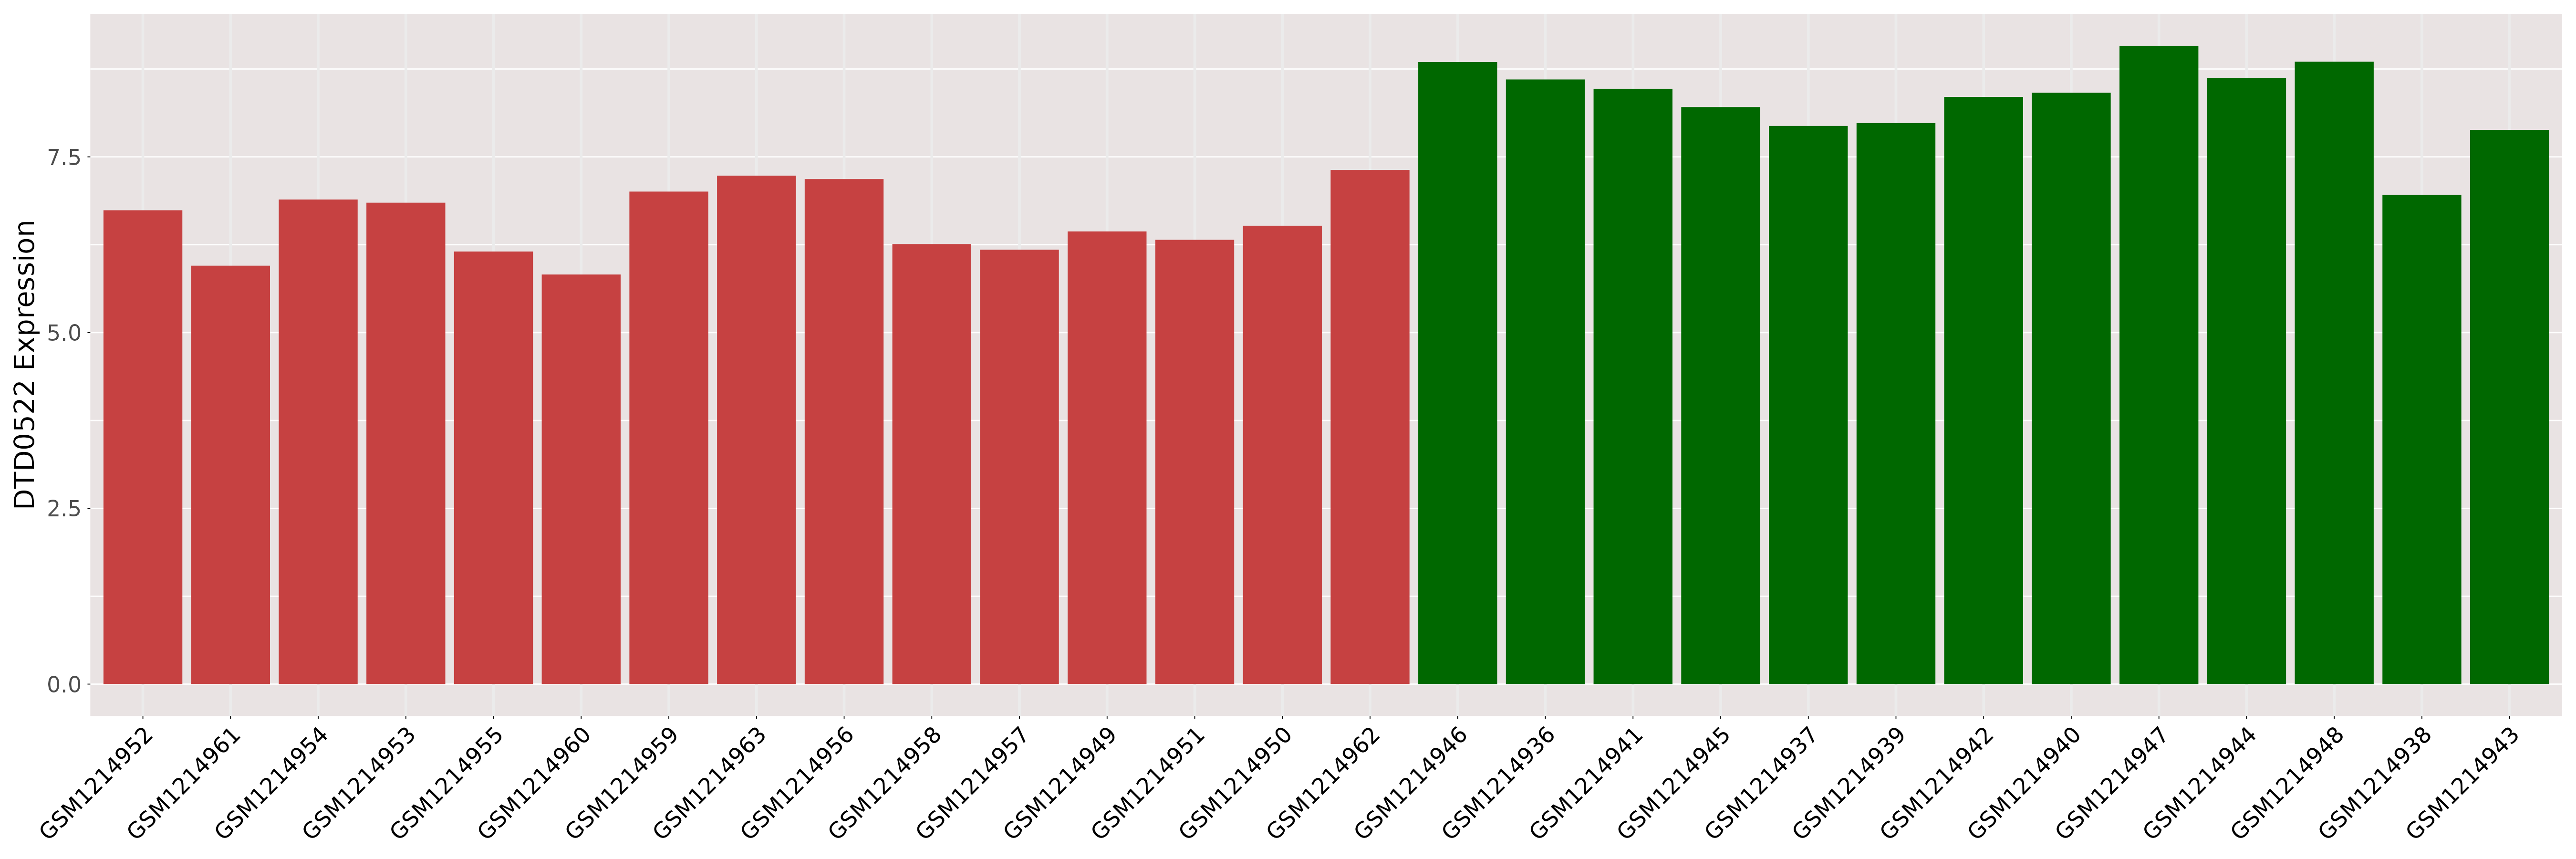
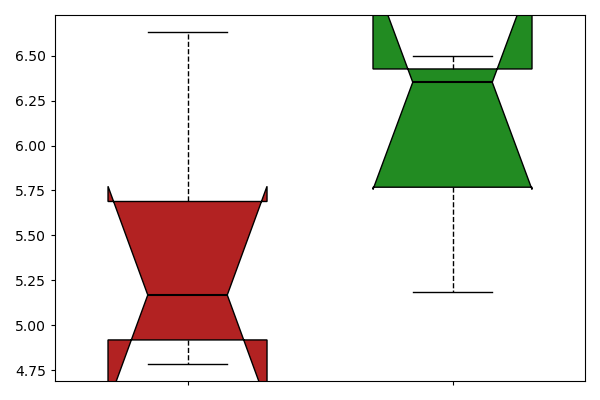
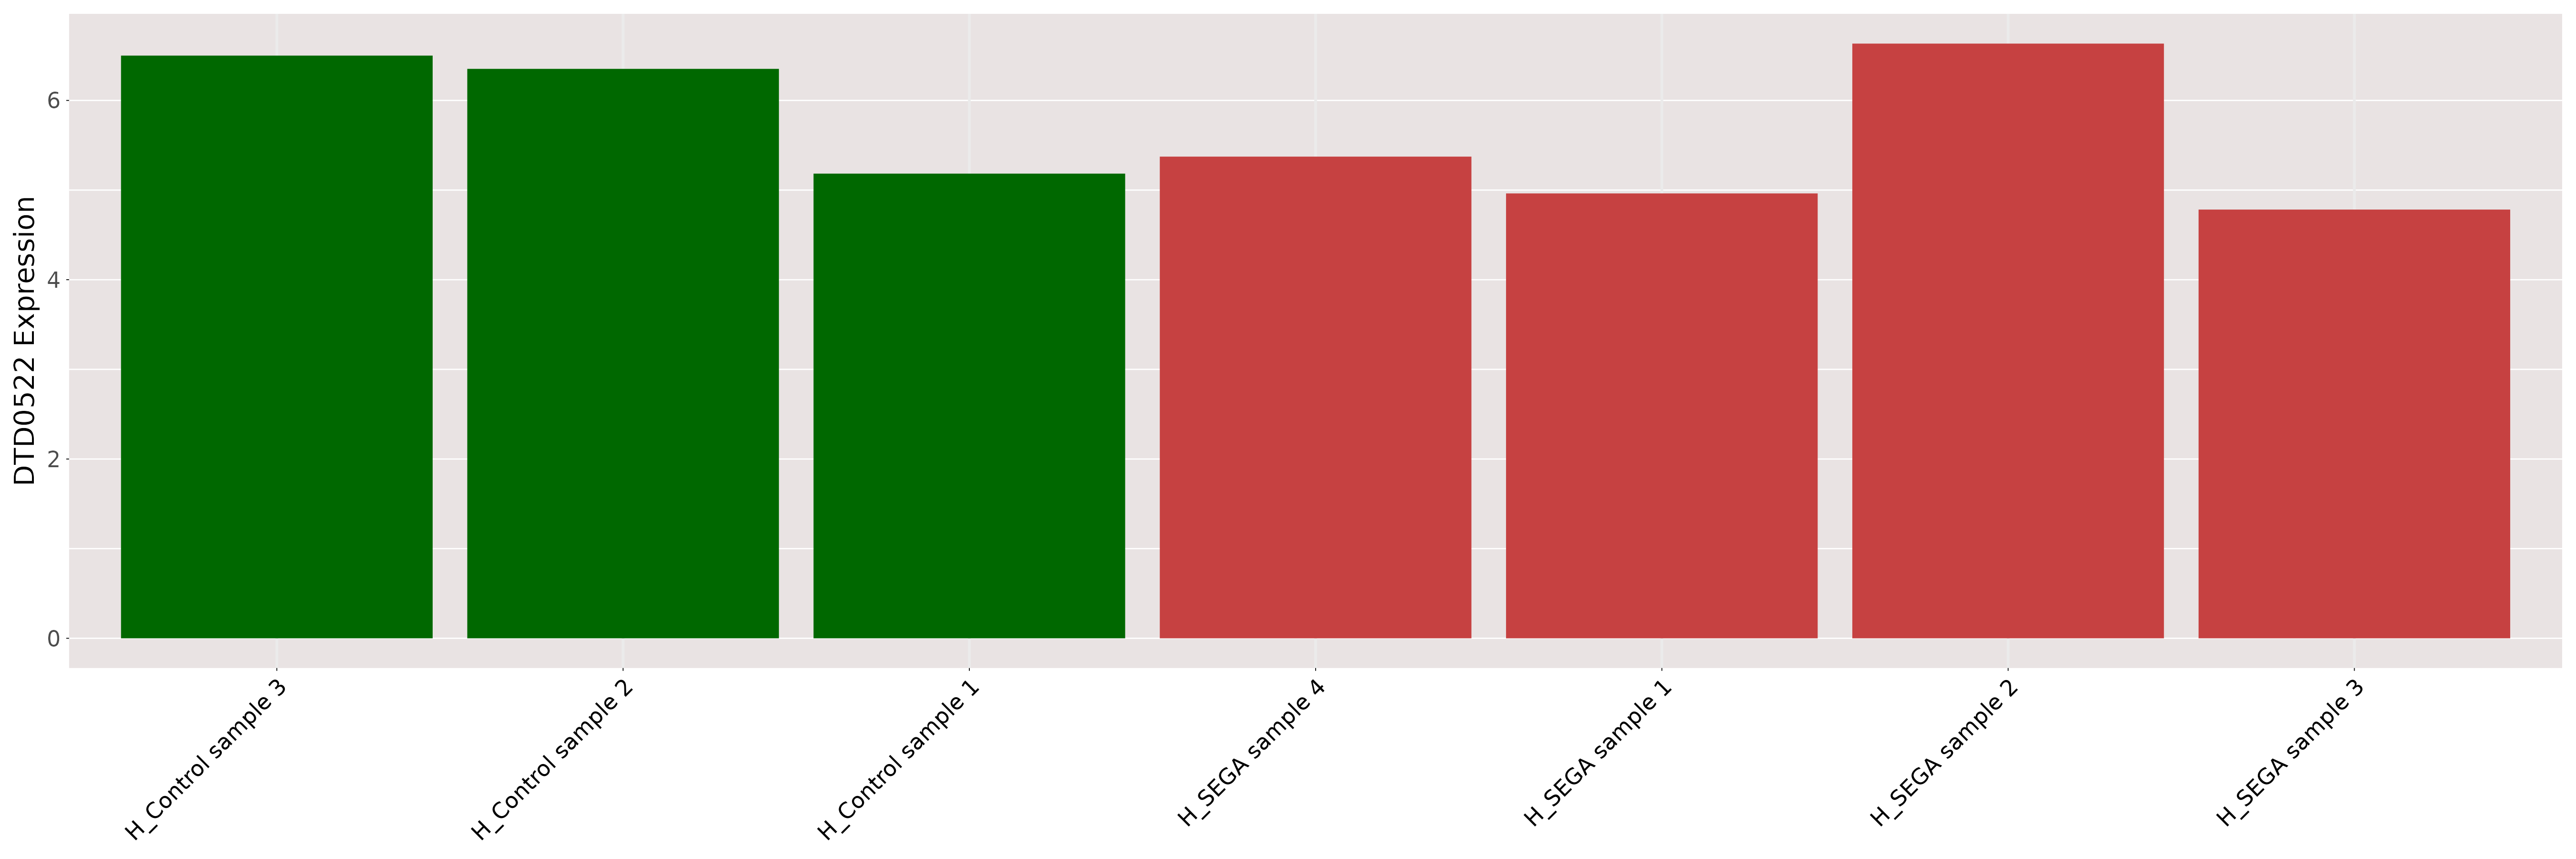
| [+] ICD-11: XH1L48 Subependymal giant cell astrocytoma | Click to Show/Hide the Full List | ||||
| The Studied Tissue | Brain | ||||
| The Specified Disease | Subependymal giant cell astrocytoma [ICD-11:XH1L48] | ||||
| The Expression Level of Disease Section Compare with the Healthy Individual Tissue | p-value:0.3859048847862178; Fold-change:0.8135622642700192; Z-score:-0.795795096 | ||||
| DT expression in the diseased tissue of patients
DT expression in the normal tissue of healthy individuals
|
|||||
|
 Please Click the above Thumbnail to View/Download
the Expression Barchart for All Samples Please Click the above Thumbnail to View/Download
the Expression Barchart for All Samples
|
||||
| [+] ICD-11: XH77N6 Clear cell sarcoma, NOS (soft tissue) | Click to Show/Hide the Full List | ||||
| The Studied Tissue | Kidney | ||||
| The Specified Disease | Clear cell sarcoma [ICD-11:XH77N6] | ||||
| The Expression Level of Disease Section Compare with the Healthy Individual Tissue | p-value:0.0002702819909237; Fold-change:0.8013392523215962; Z-score:-5.178914673 | ||||
| DT expression in the diseased tissue of patients
DT expression in the normal tissue of healthy individuals
|
|||||
|
|
|
||||
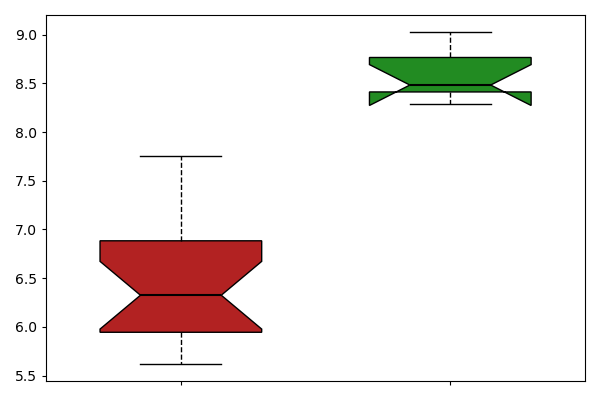
| [+] ICD-11: XH7ZQ4 Atypical teratoid/rhabdoid tumour | Click to Show/Hide the Full List | ||||
| The Studied Tissue | Brain | ||||
| The Specified Disease | Atypical teratoid rhabdoid tumor [ICD-11:XH7ZQ4] | ||||
| The Expression Level of Disease Section Compare with the Healthy Individual Tissue | p-value:4.616371024872691e-08; Fold-change:0.7457248592891631; Z-score:-7.985807956 | ||||
| DT expression in the diseased tissue of patients
DT expression in the normal tissue of healthy individuals
|
|||||
|
 Please Click the above Thumbnail to View/Download
the Expression Barchart for All Samples Please Click the above Thumbnail to View/Download
the Expression Barchart for All Samples
|
||||
If you find any error in data or bug in web service, please kindly report it to Dr. Li and Dr. Fu.