
Detail Information of Disease-specific Protein Abundances
| General Information of Drug Transporter (DT) | |||||
|---|---|---|---|---|---|
| DT ID | DTD0520 Transporter Info | ||||
| Gene Name | CACNA1E | ||||
| Protien Name | Voltage-gated calcium channel alpha Cav2.3 | ||||
| Gene ID | |||||
| UniProt ID | |||||
| Disease-specific Protein Abundances of DT (DPAD) | |||||
|---|---|---|---|---|---|
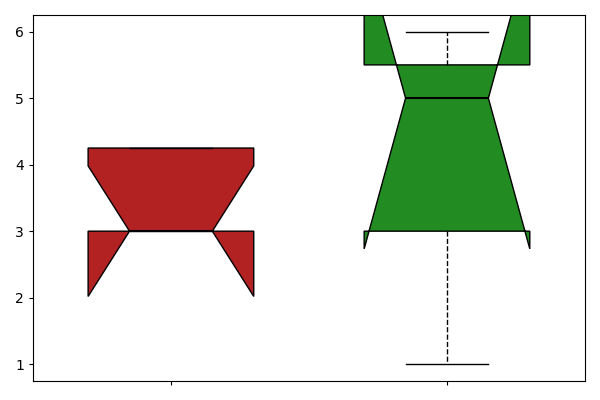
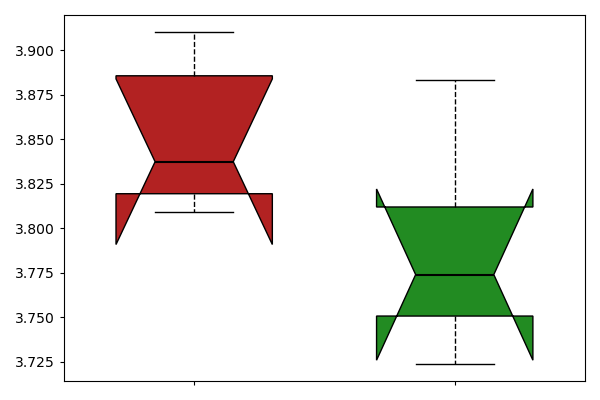
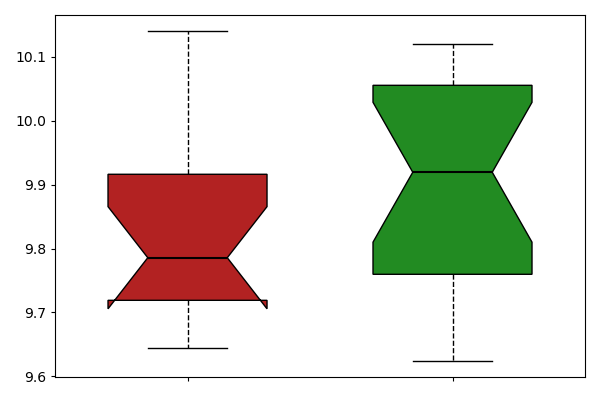
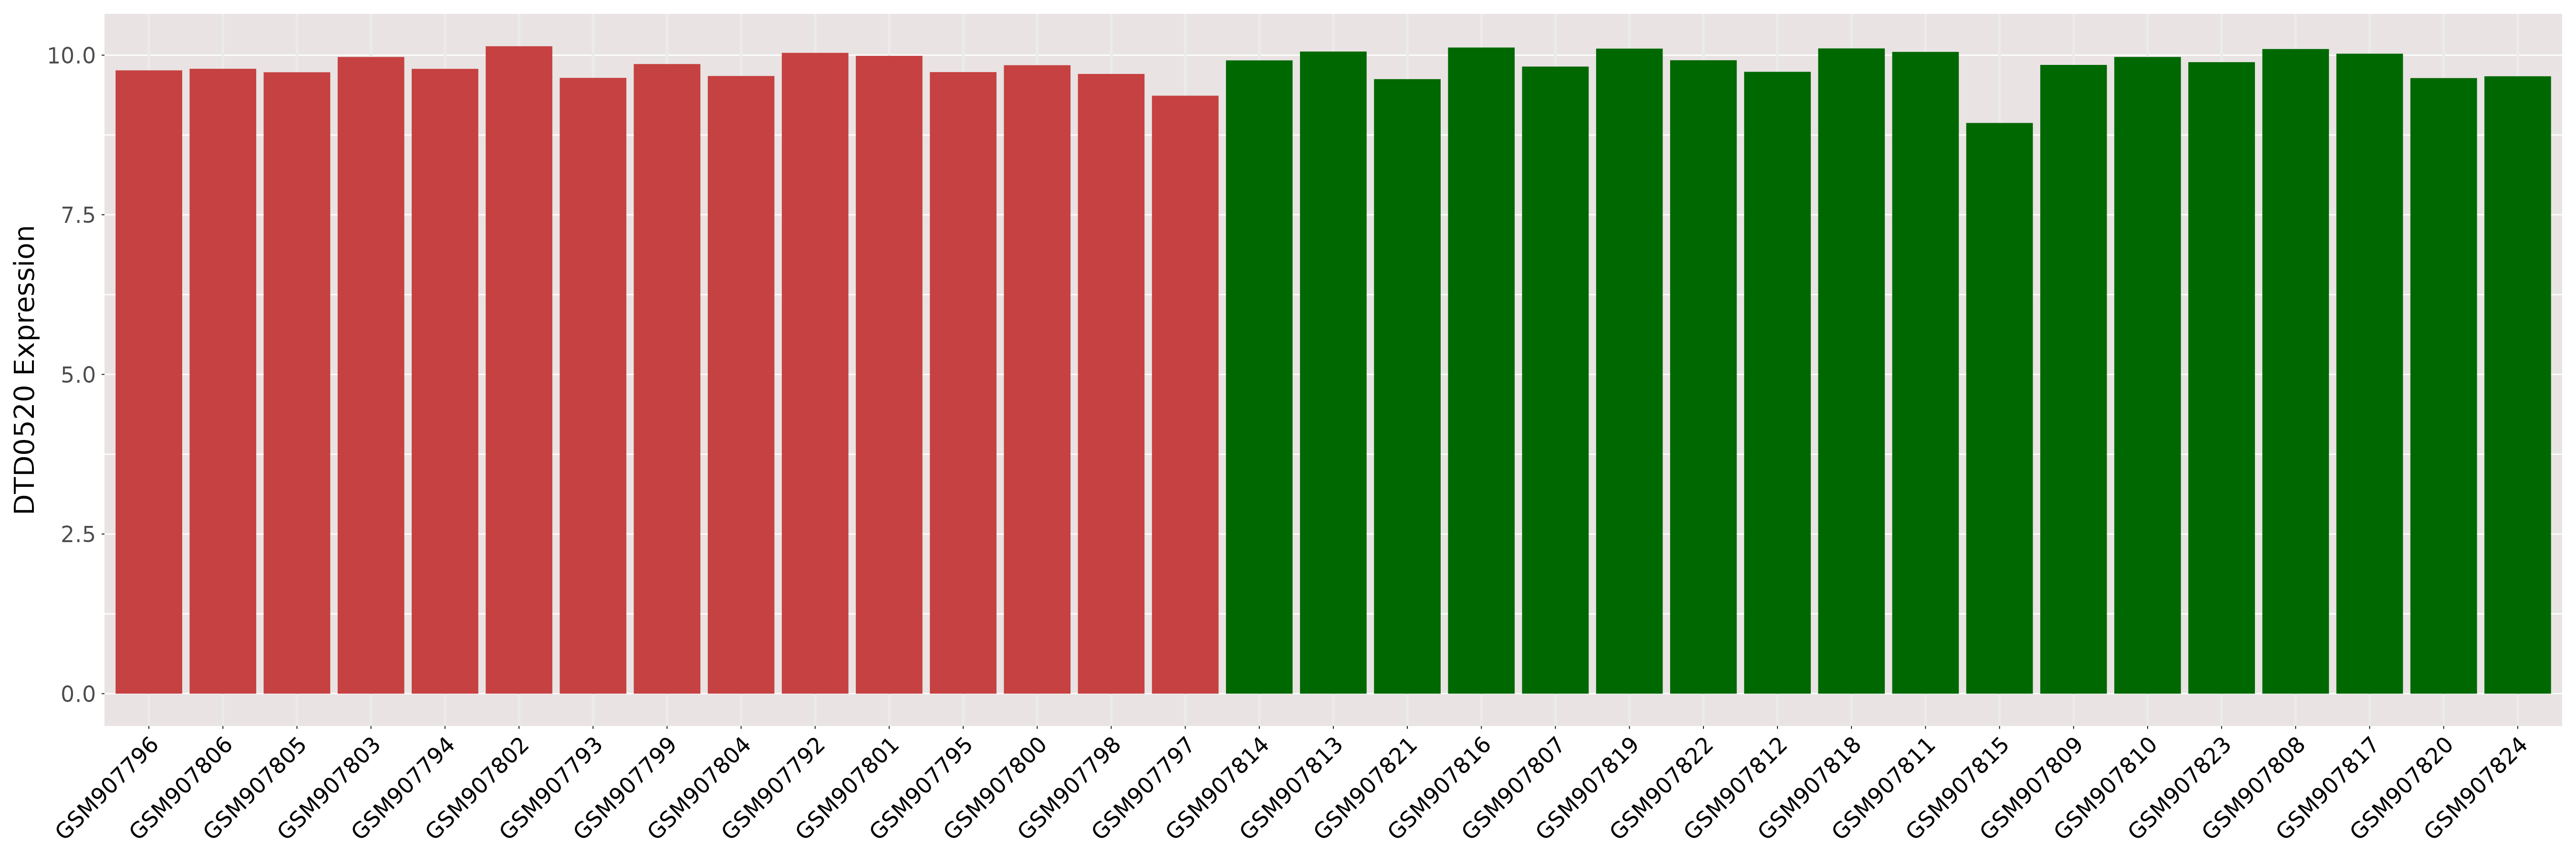
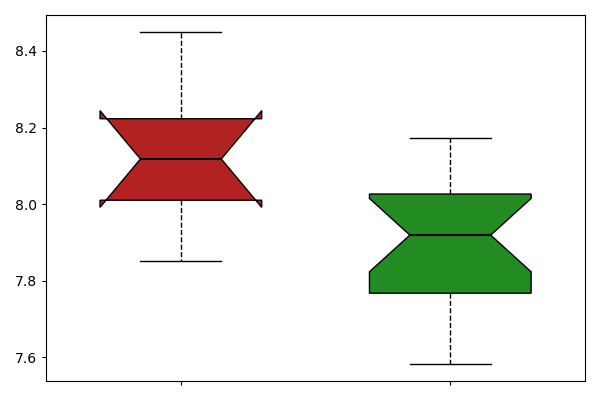
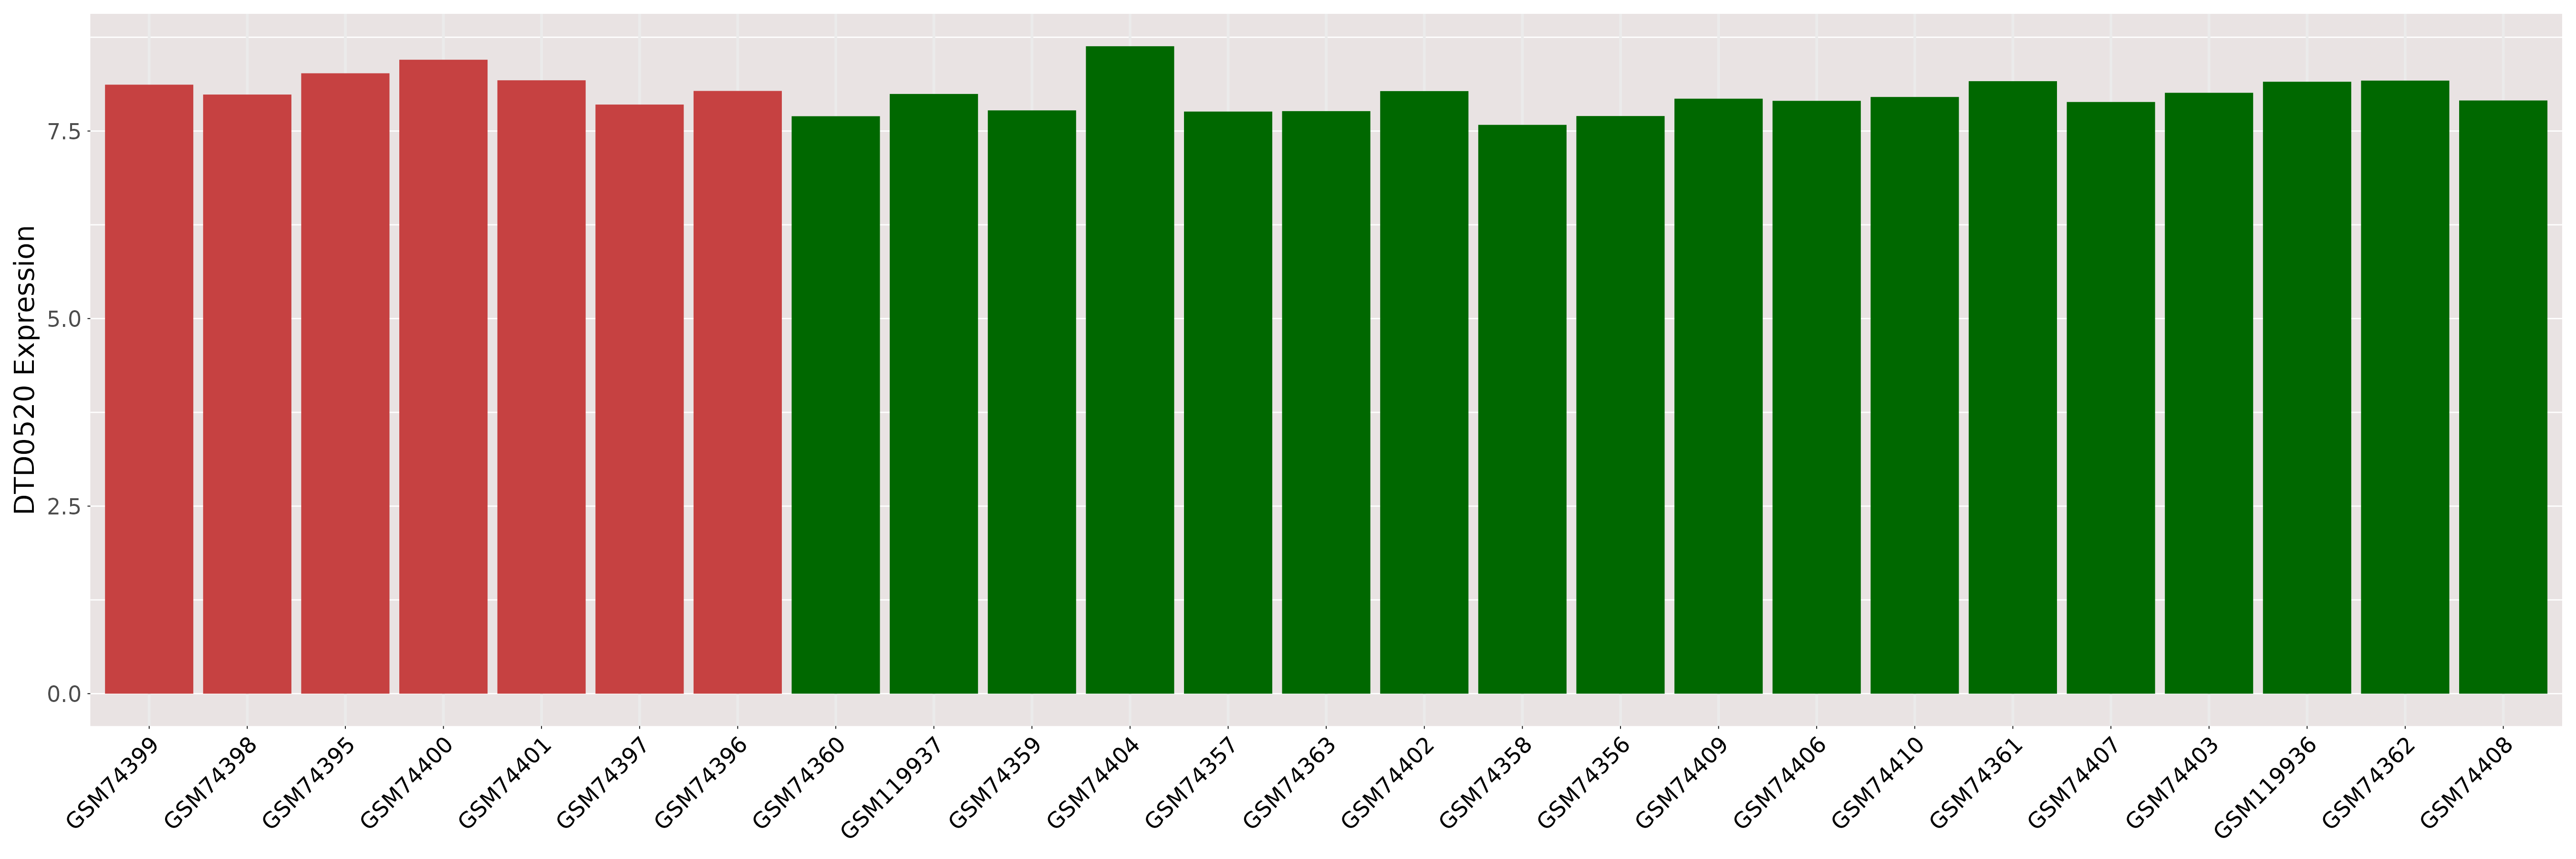
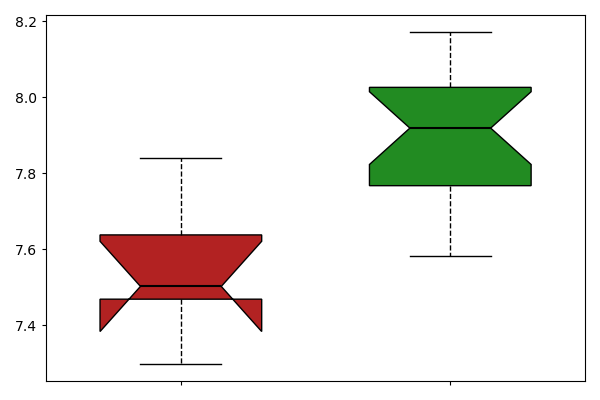
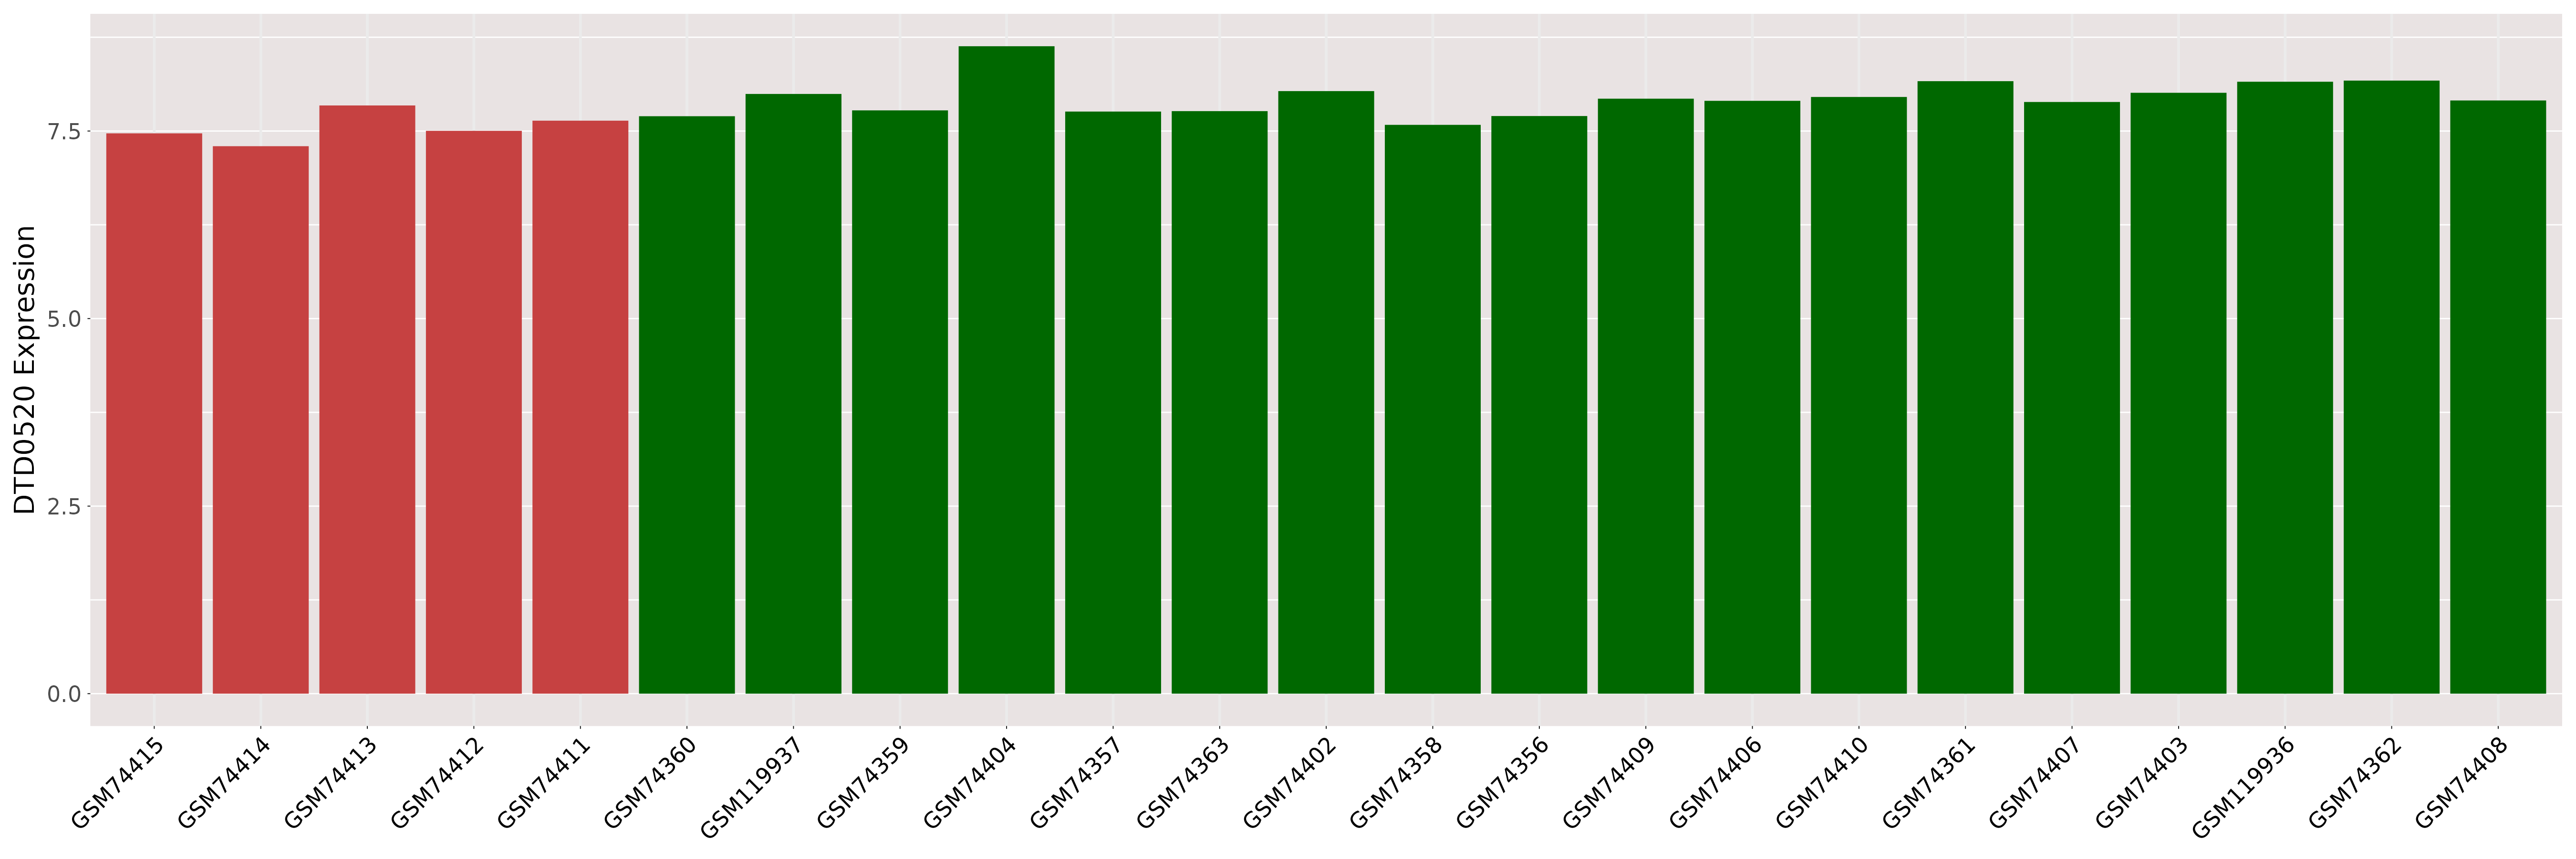
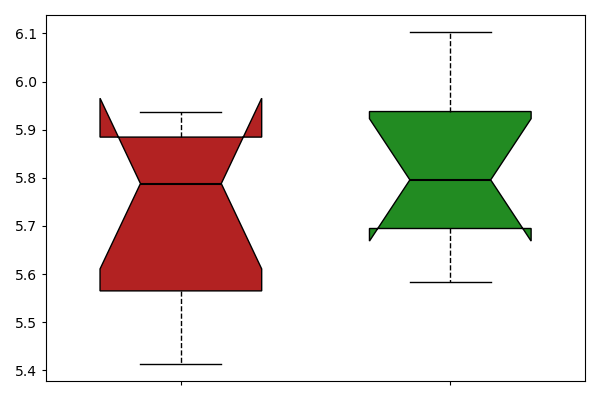
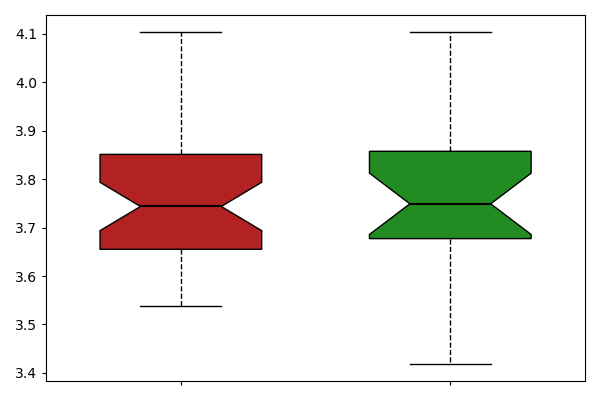
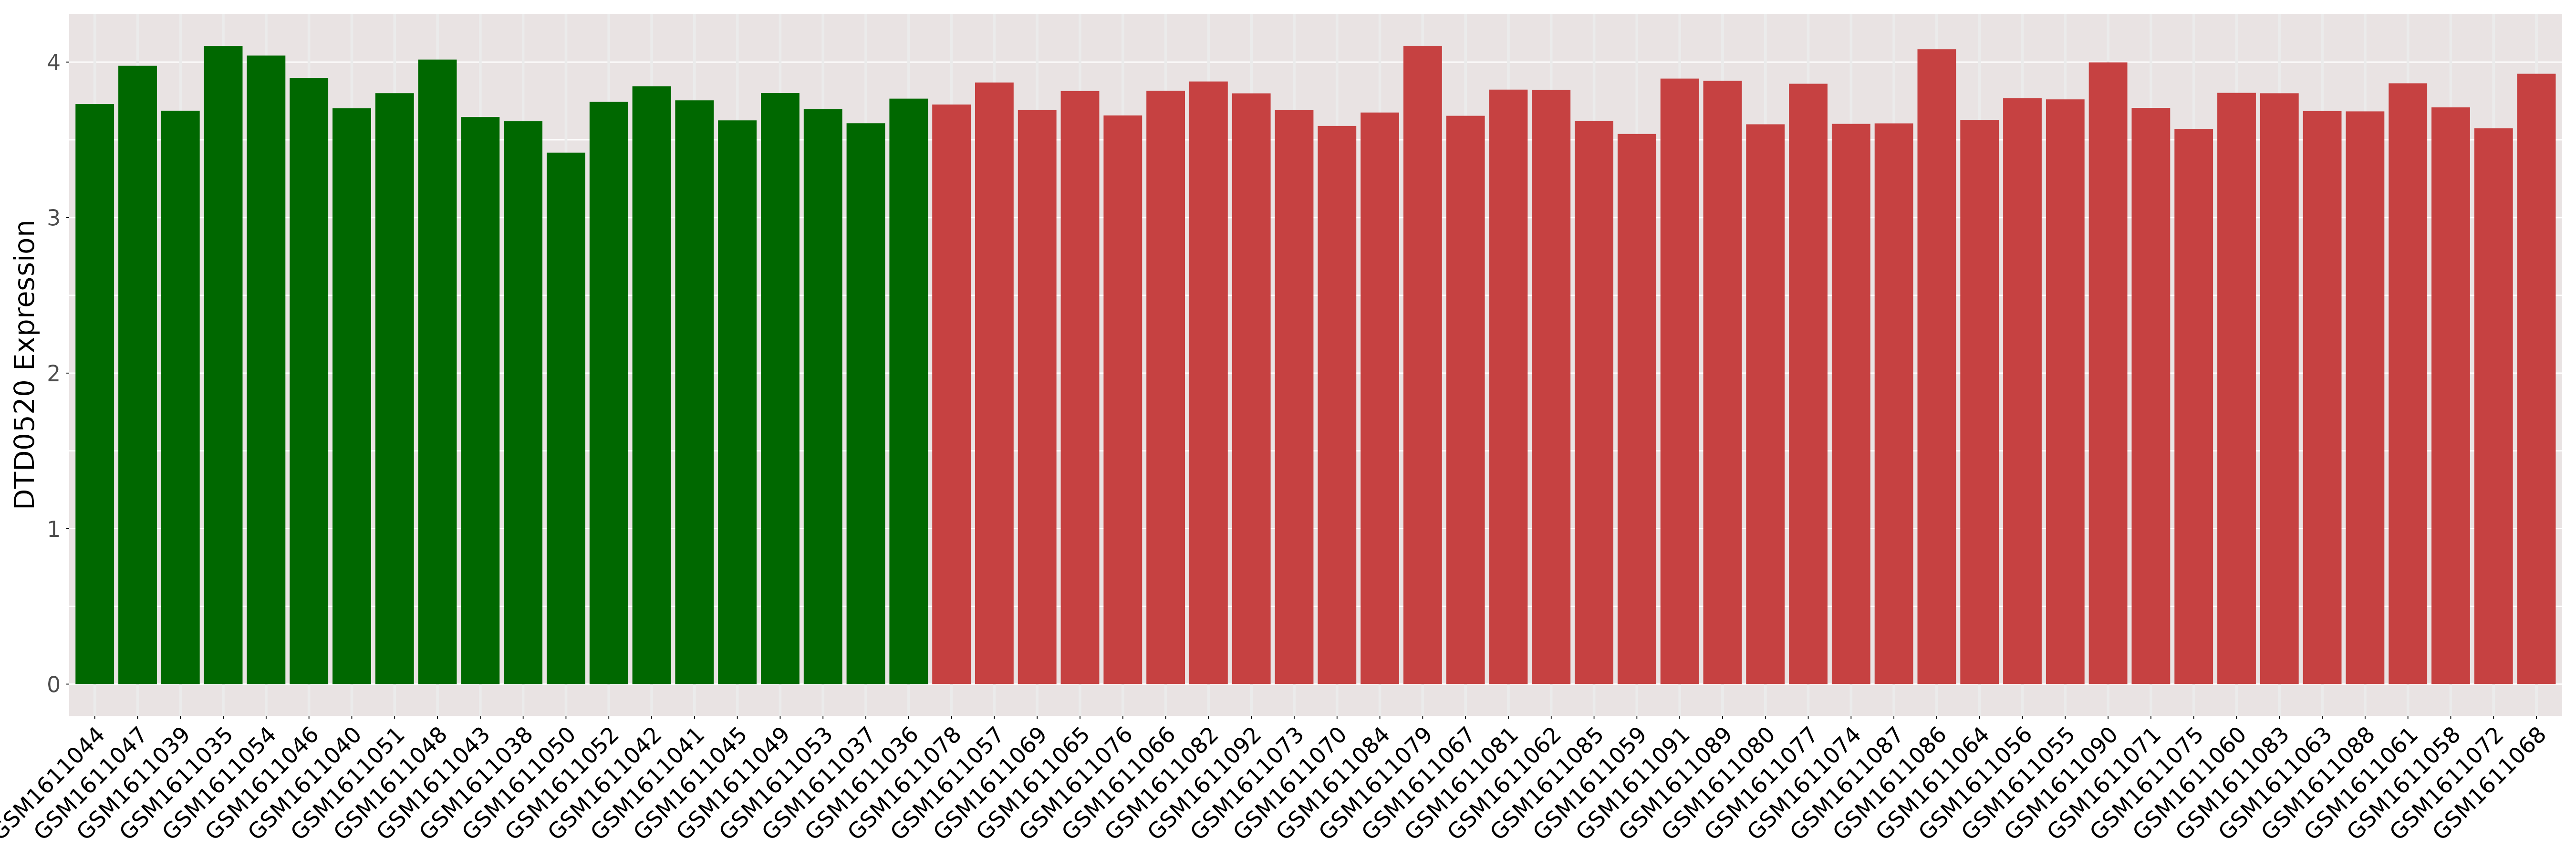
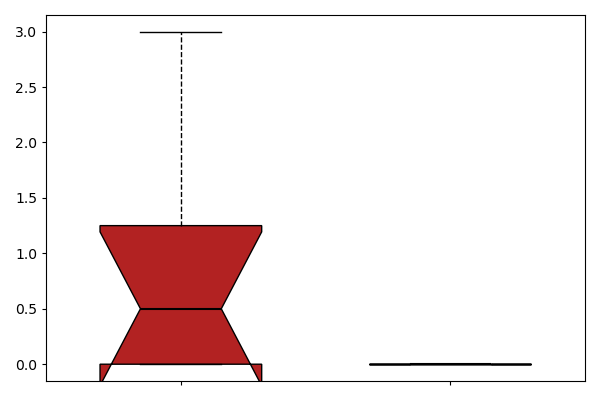
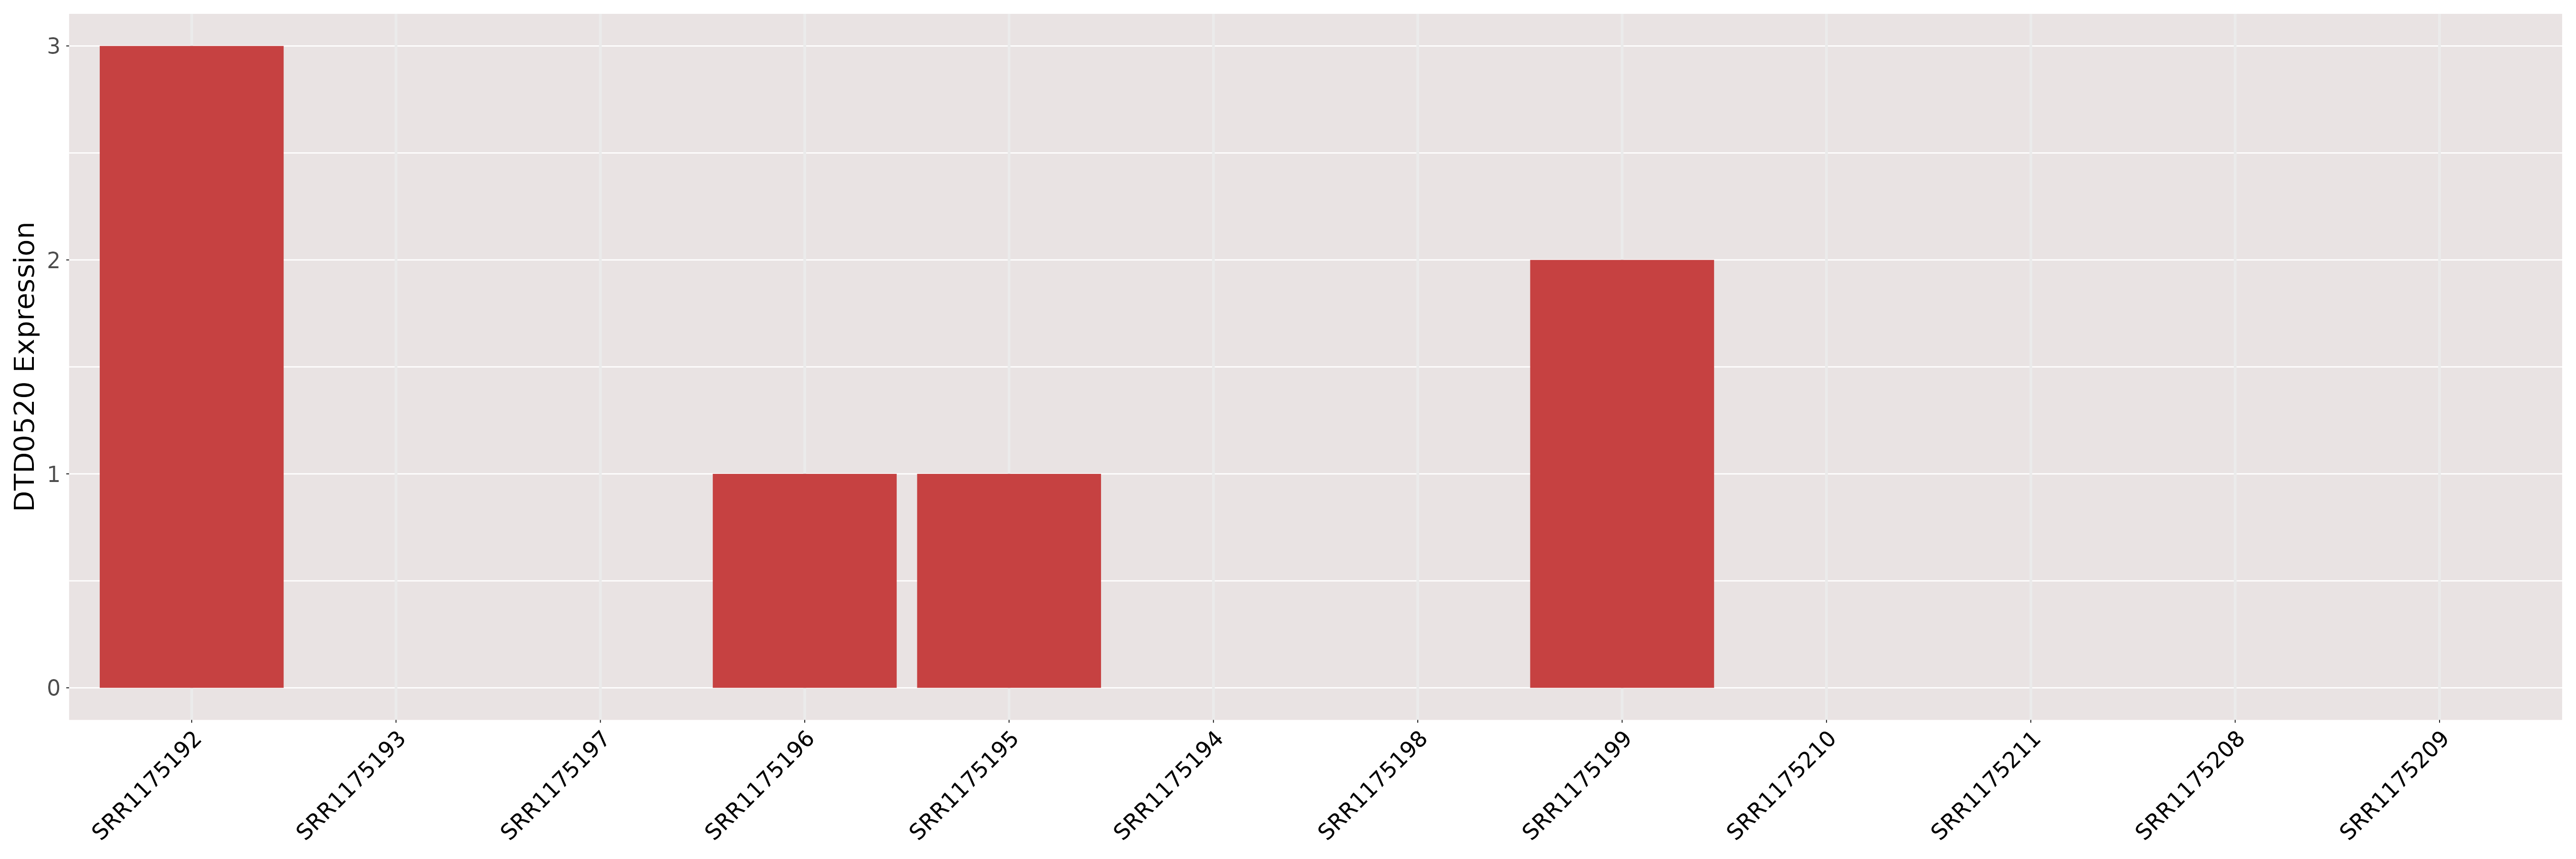
| ICD-11: 01 Certain infectious or parasitic disease | |||||
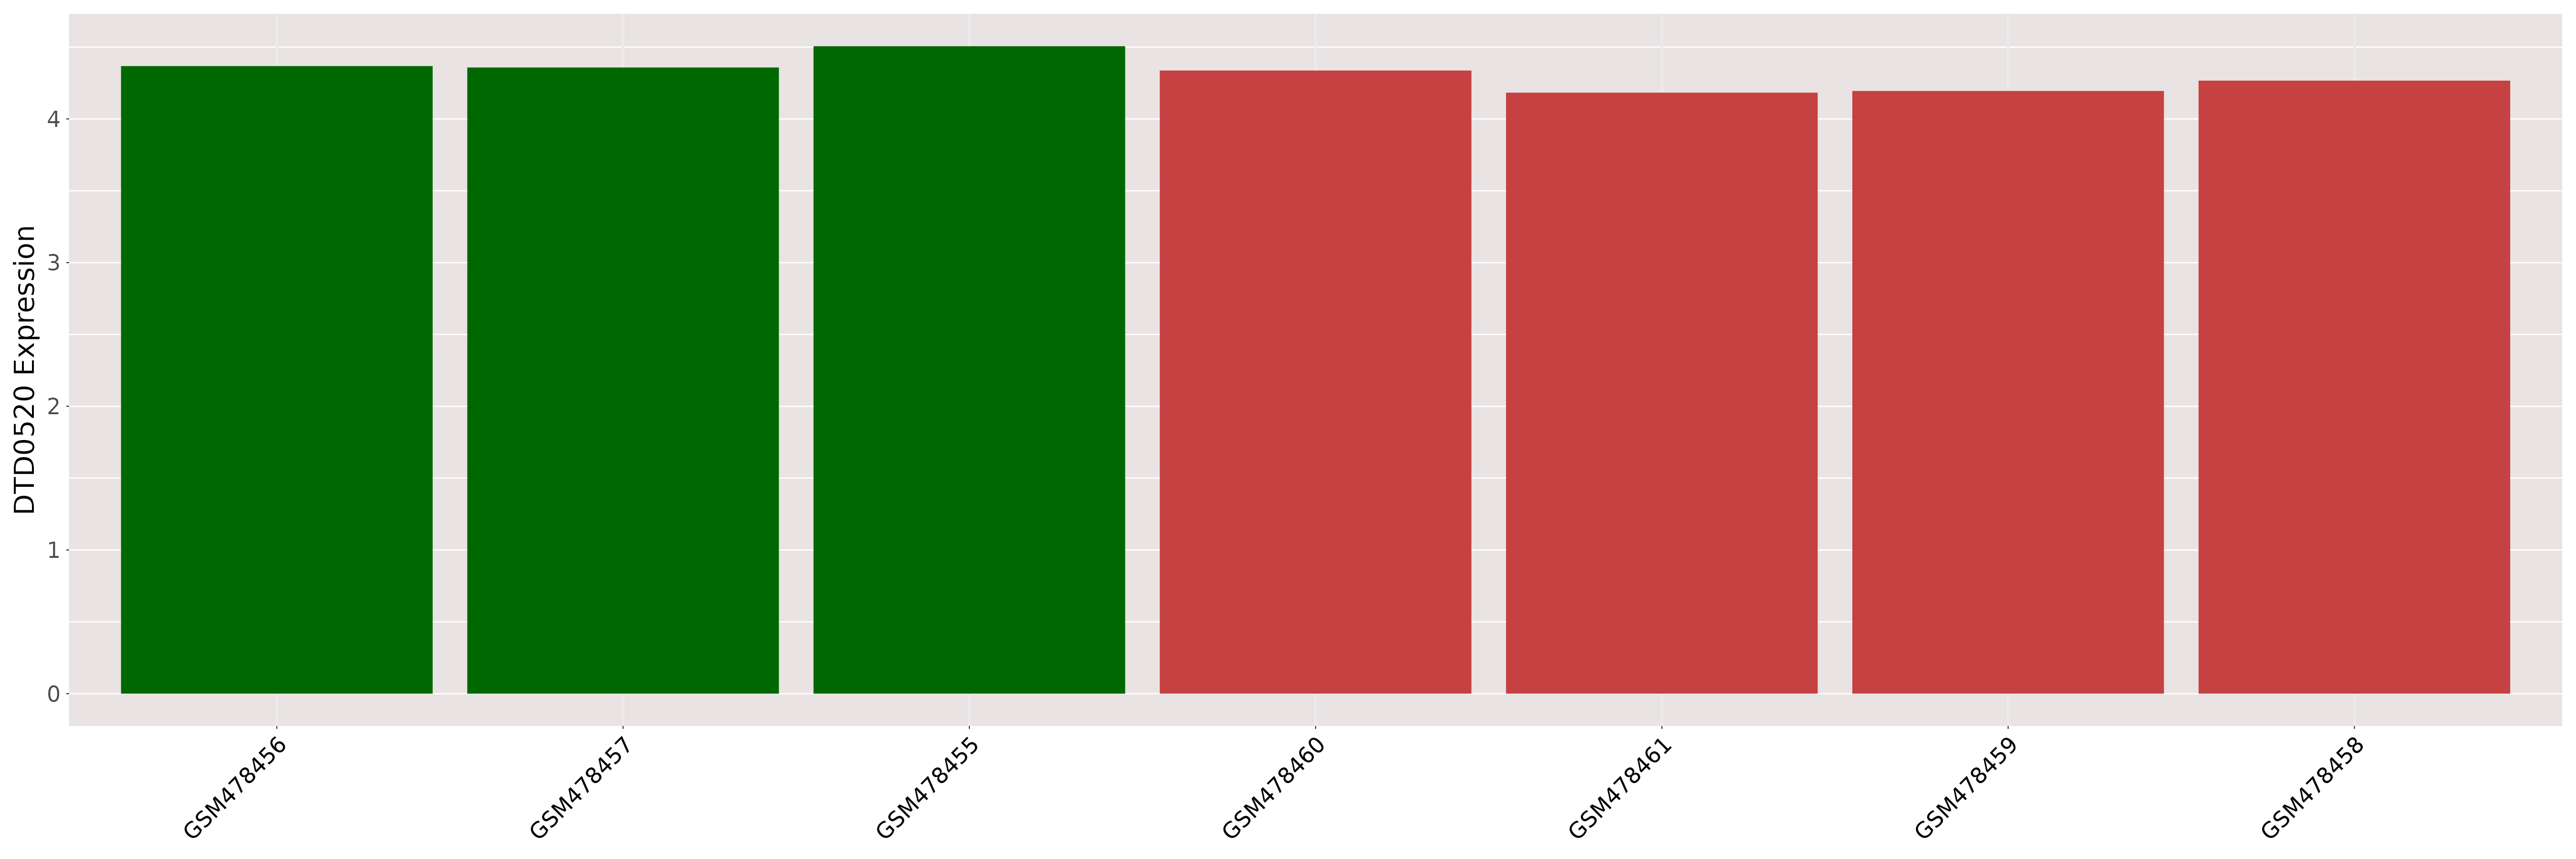
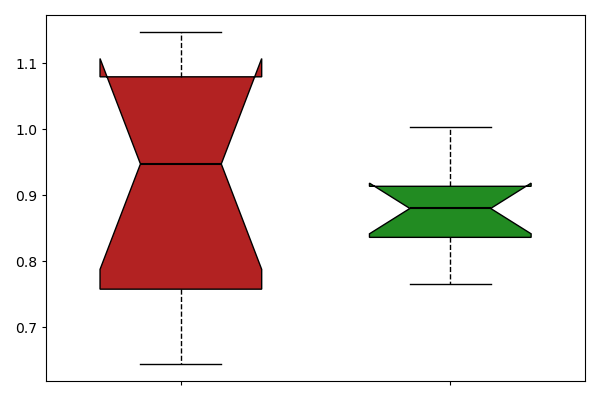
| [+] ICD-11: 1E50.1 Acute hepatitis B (viral hepatitis B) | Click to Show/Hide the Full List | ||||
| The Studied Tissue | Liver | ||||
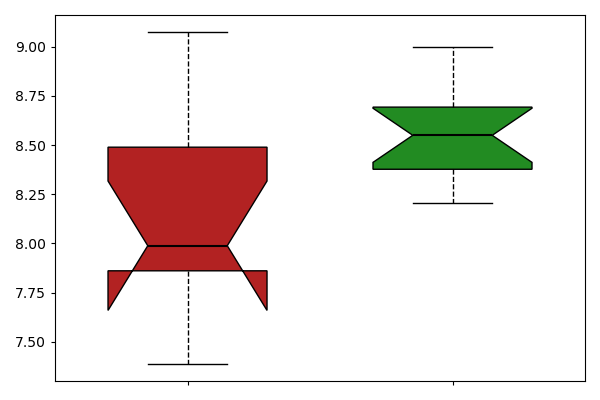
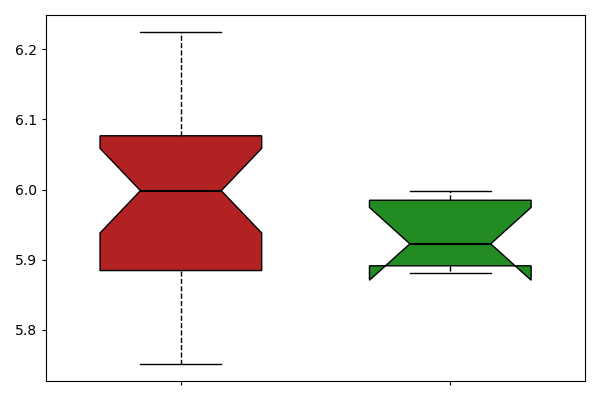
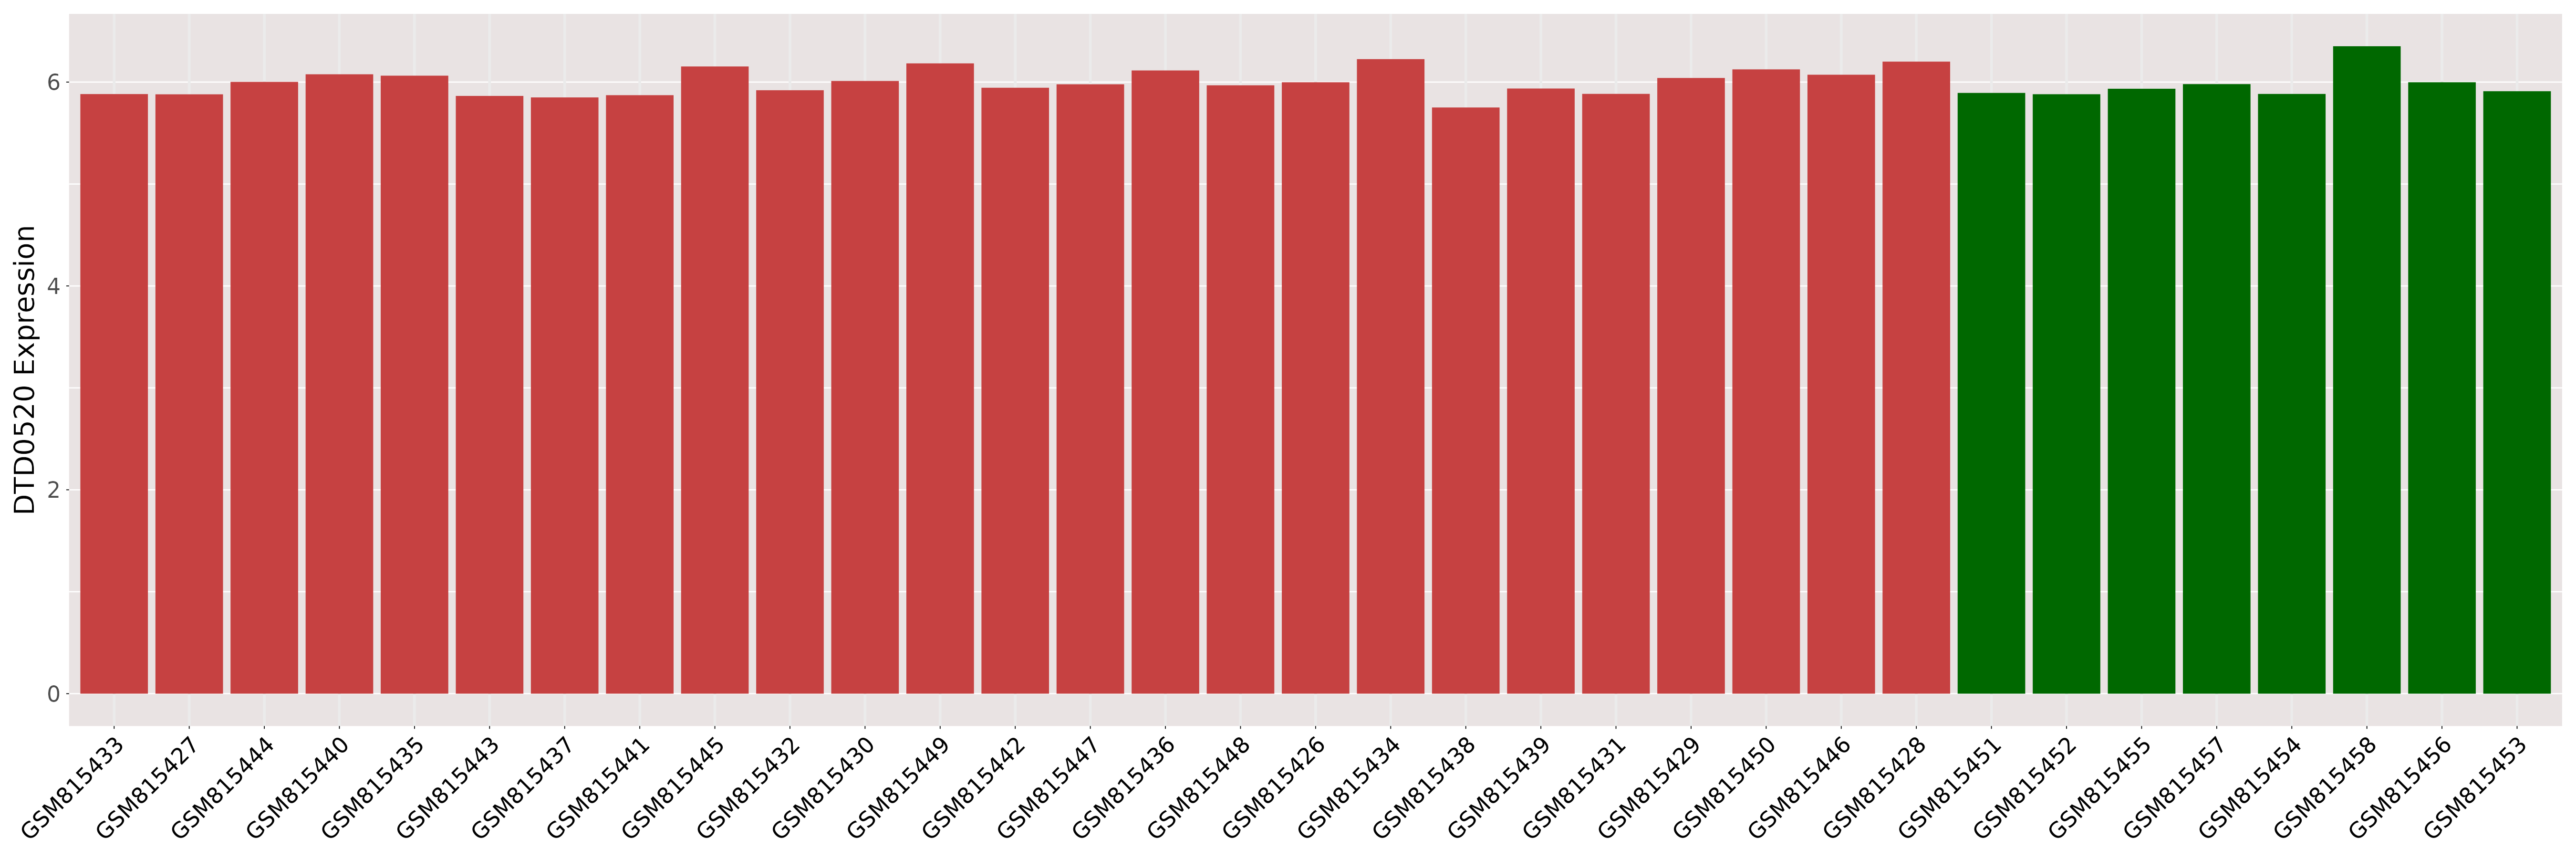
| The Specified Disease | Hepatitis b virus infection [ICD-11:1E50.1] | ||||
| The Expression Level of Disease Section Compare with the Healthy Individual Tissue | p-value:0.0076858096001952; Fold-change:1.096757943277774; Z-score:2.0660756488832392 | ||||
|
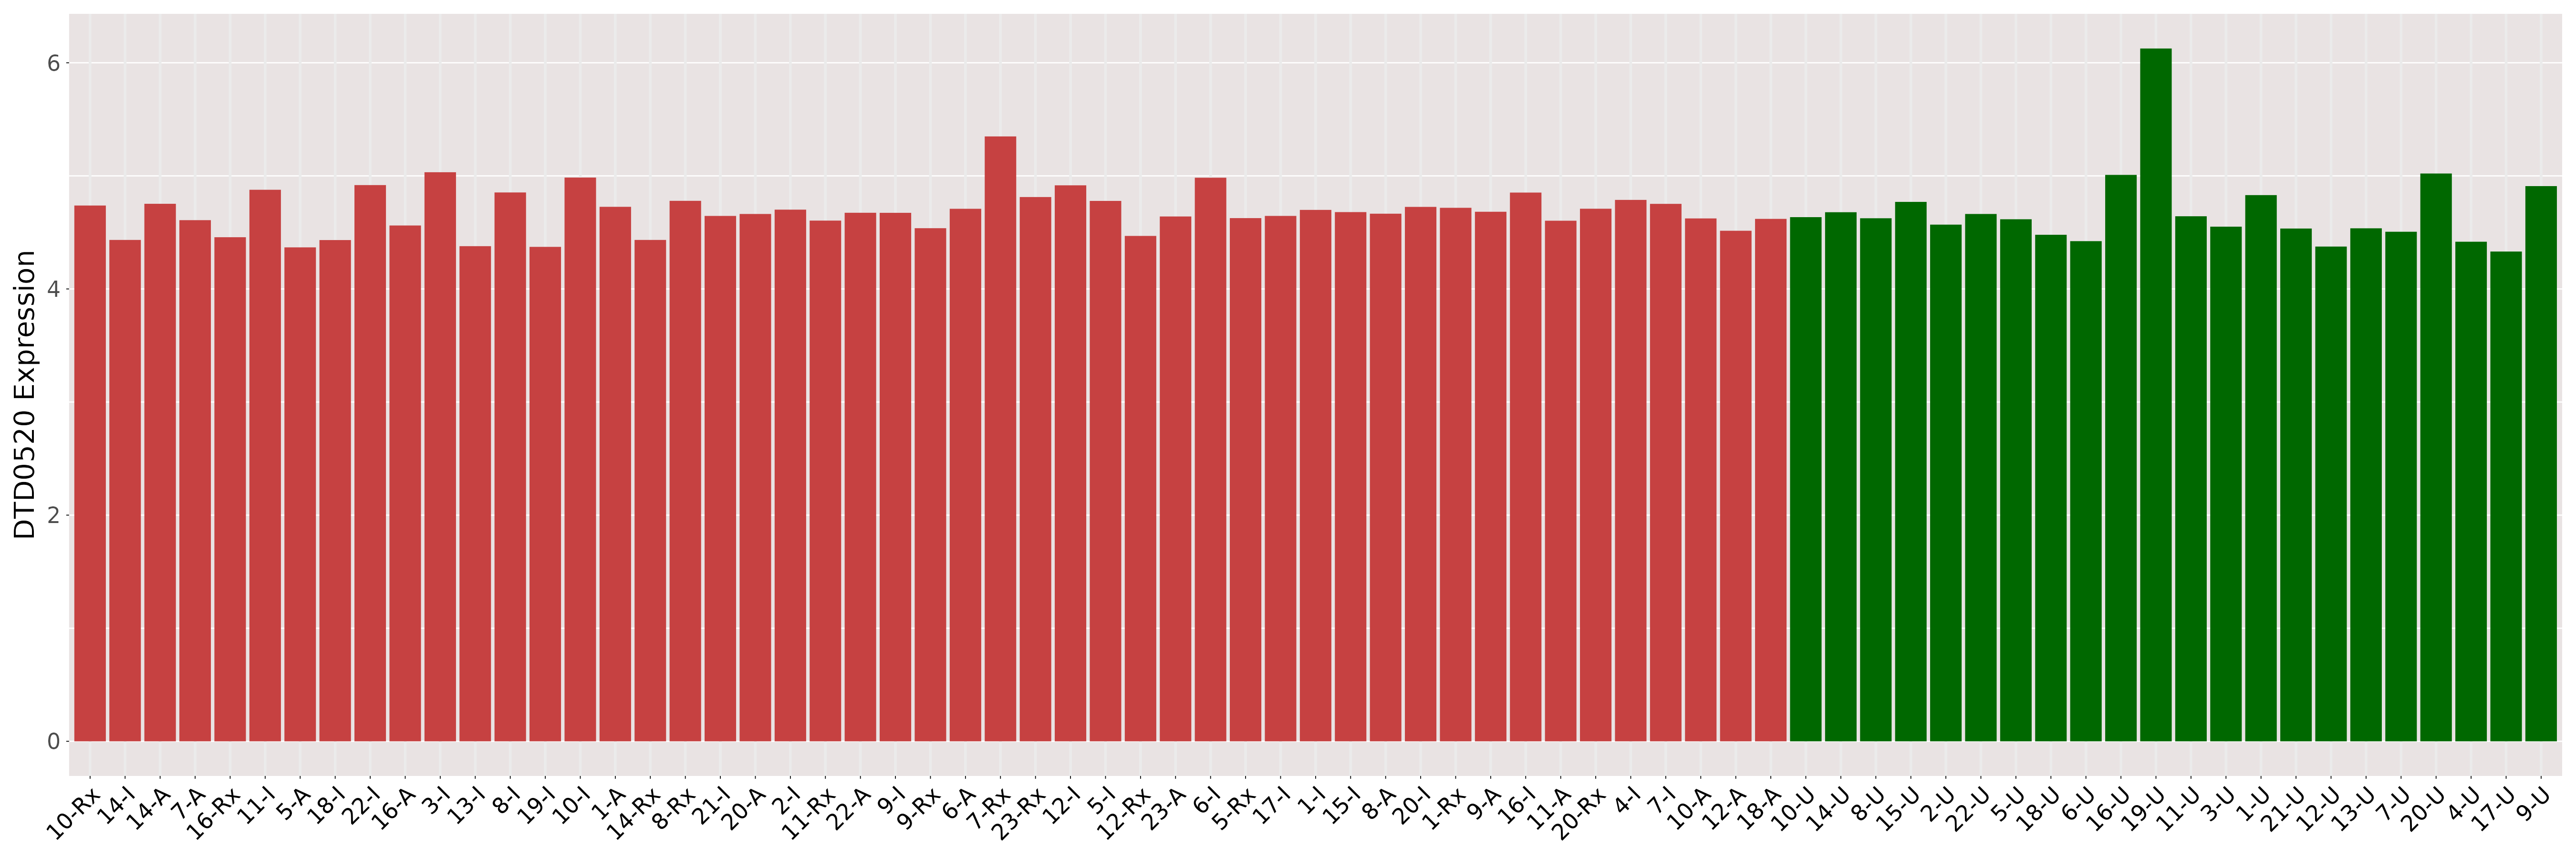
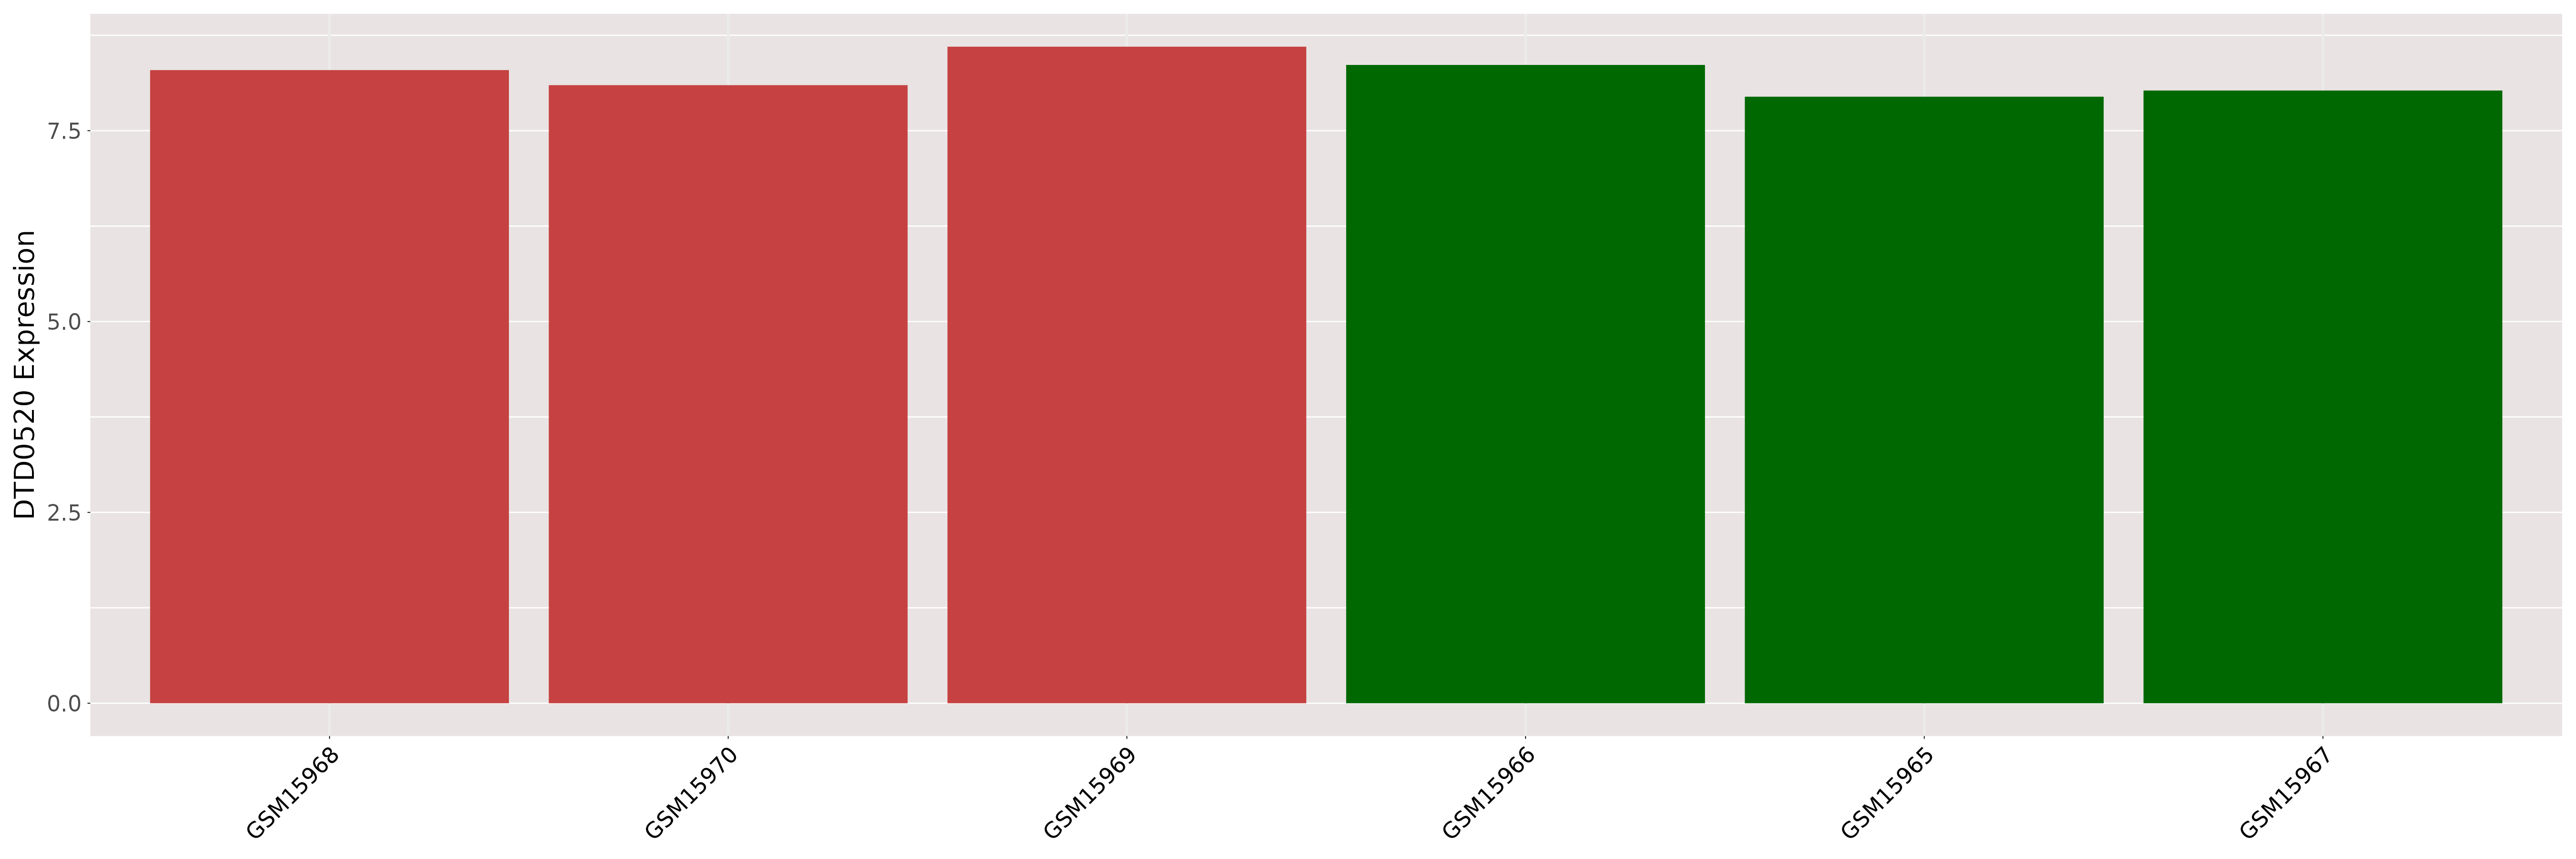
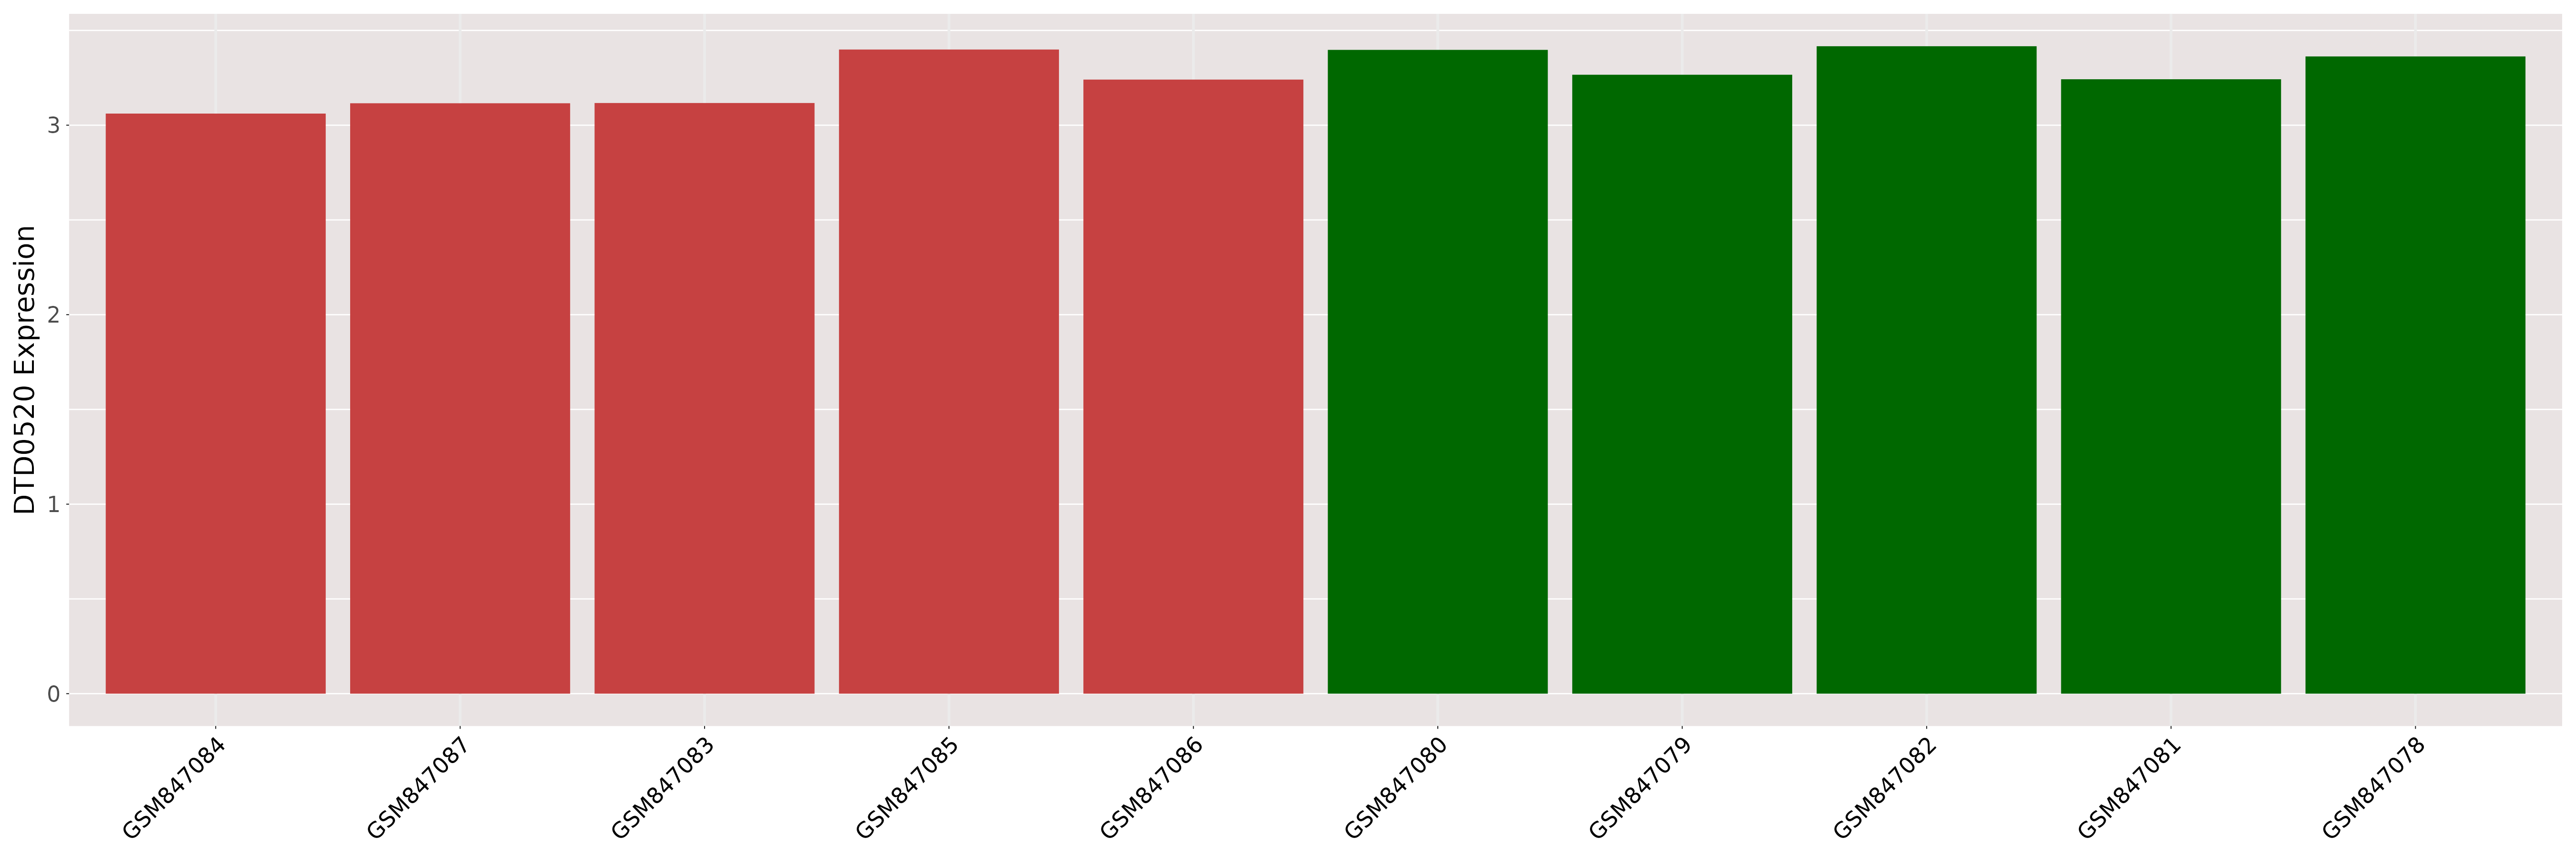
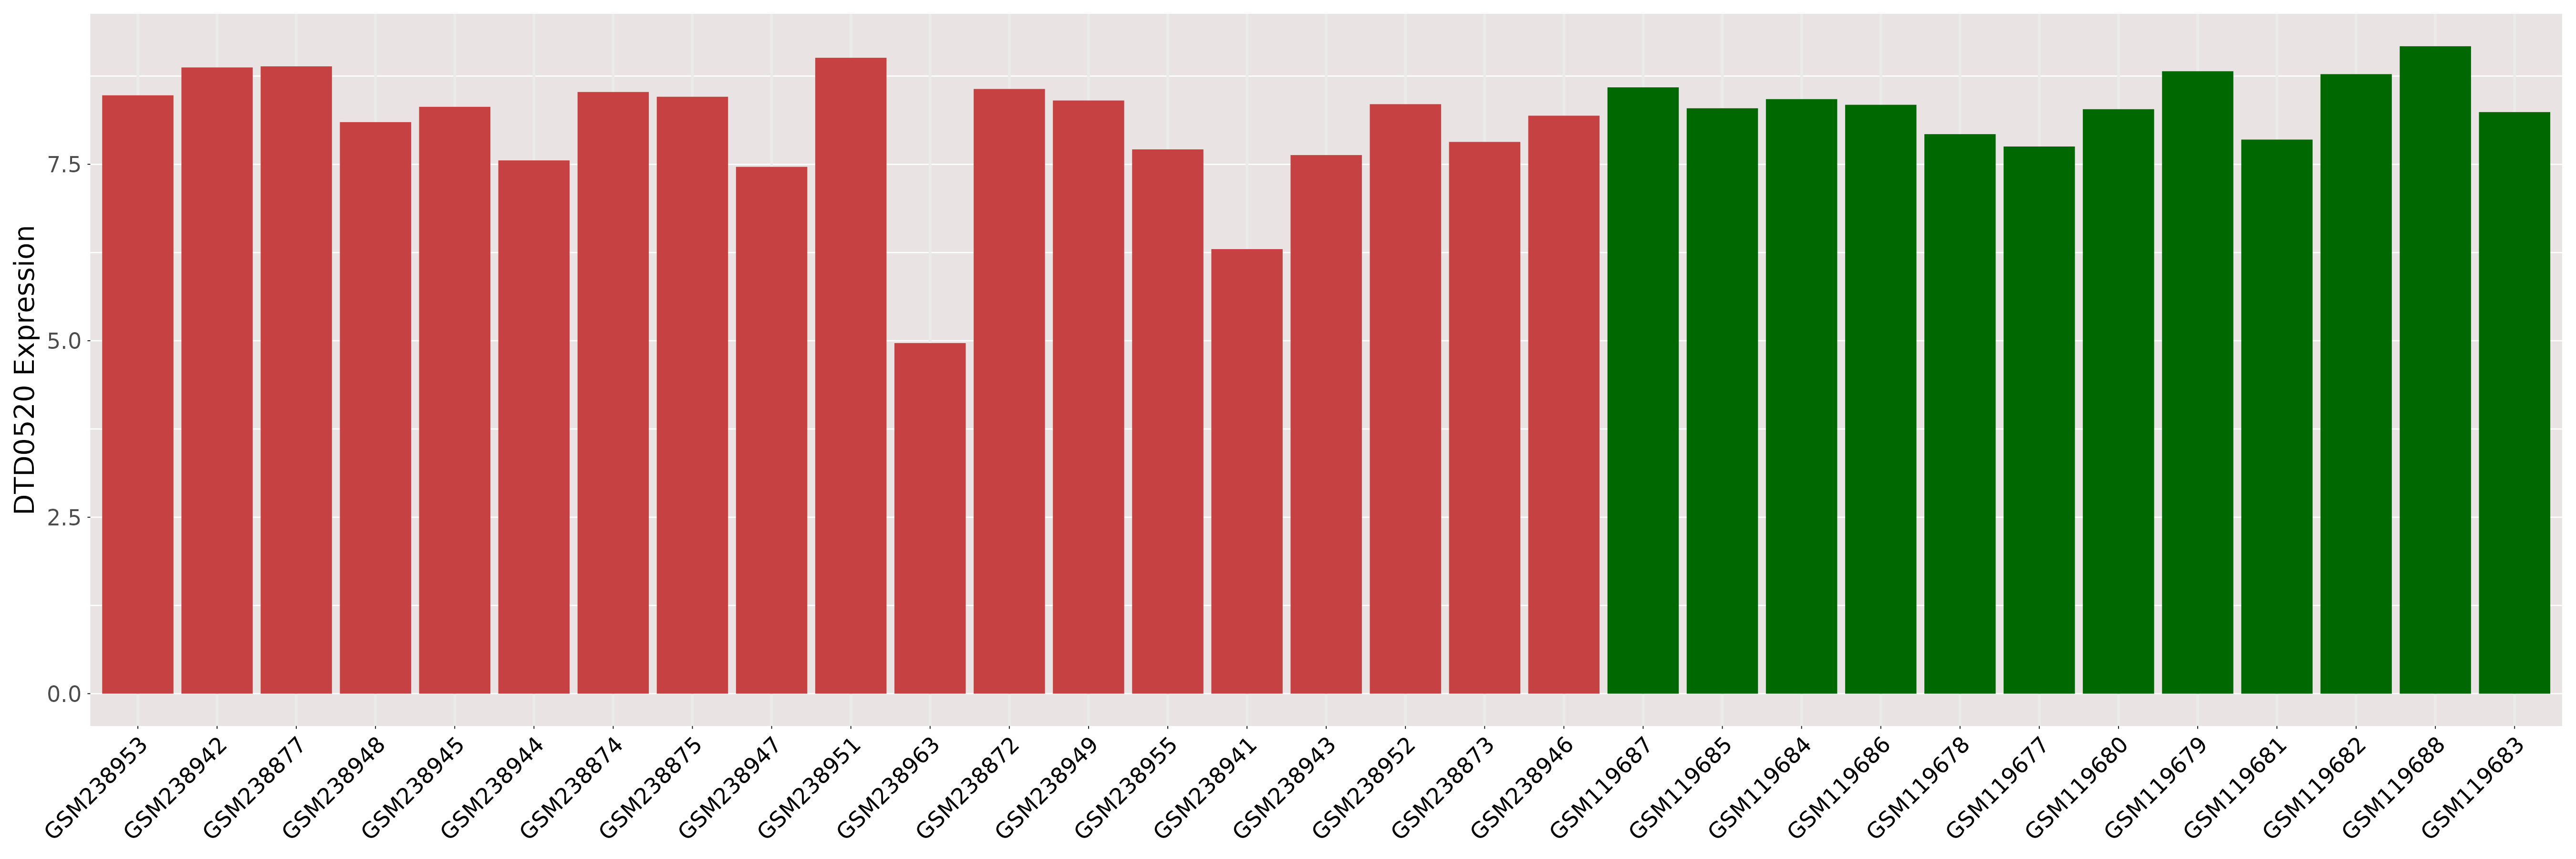
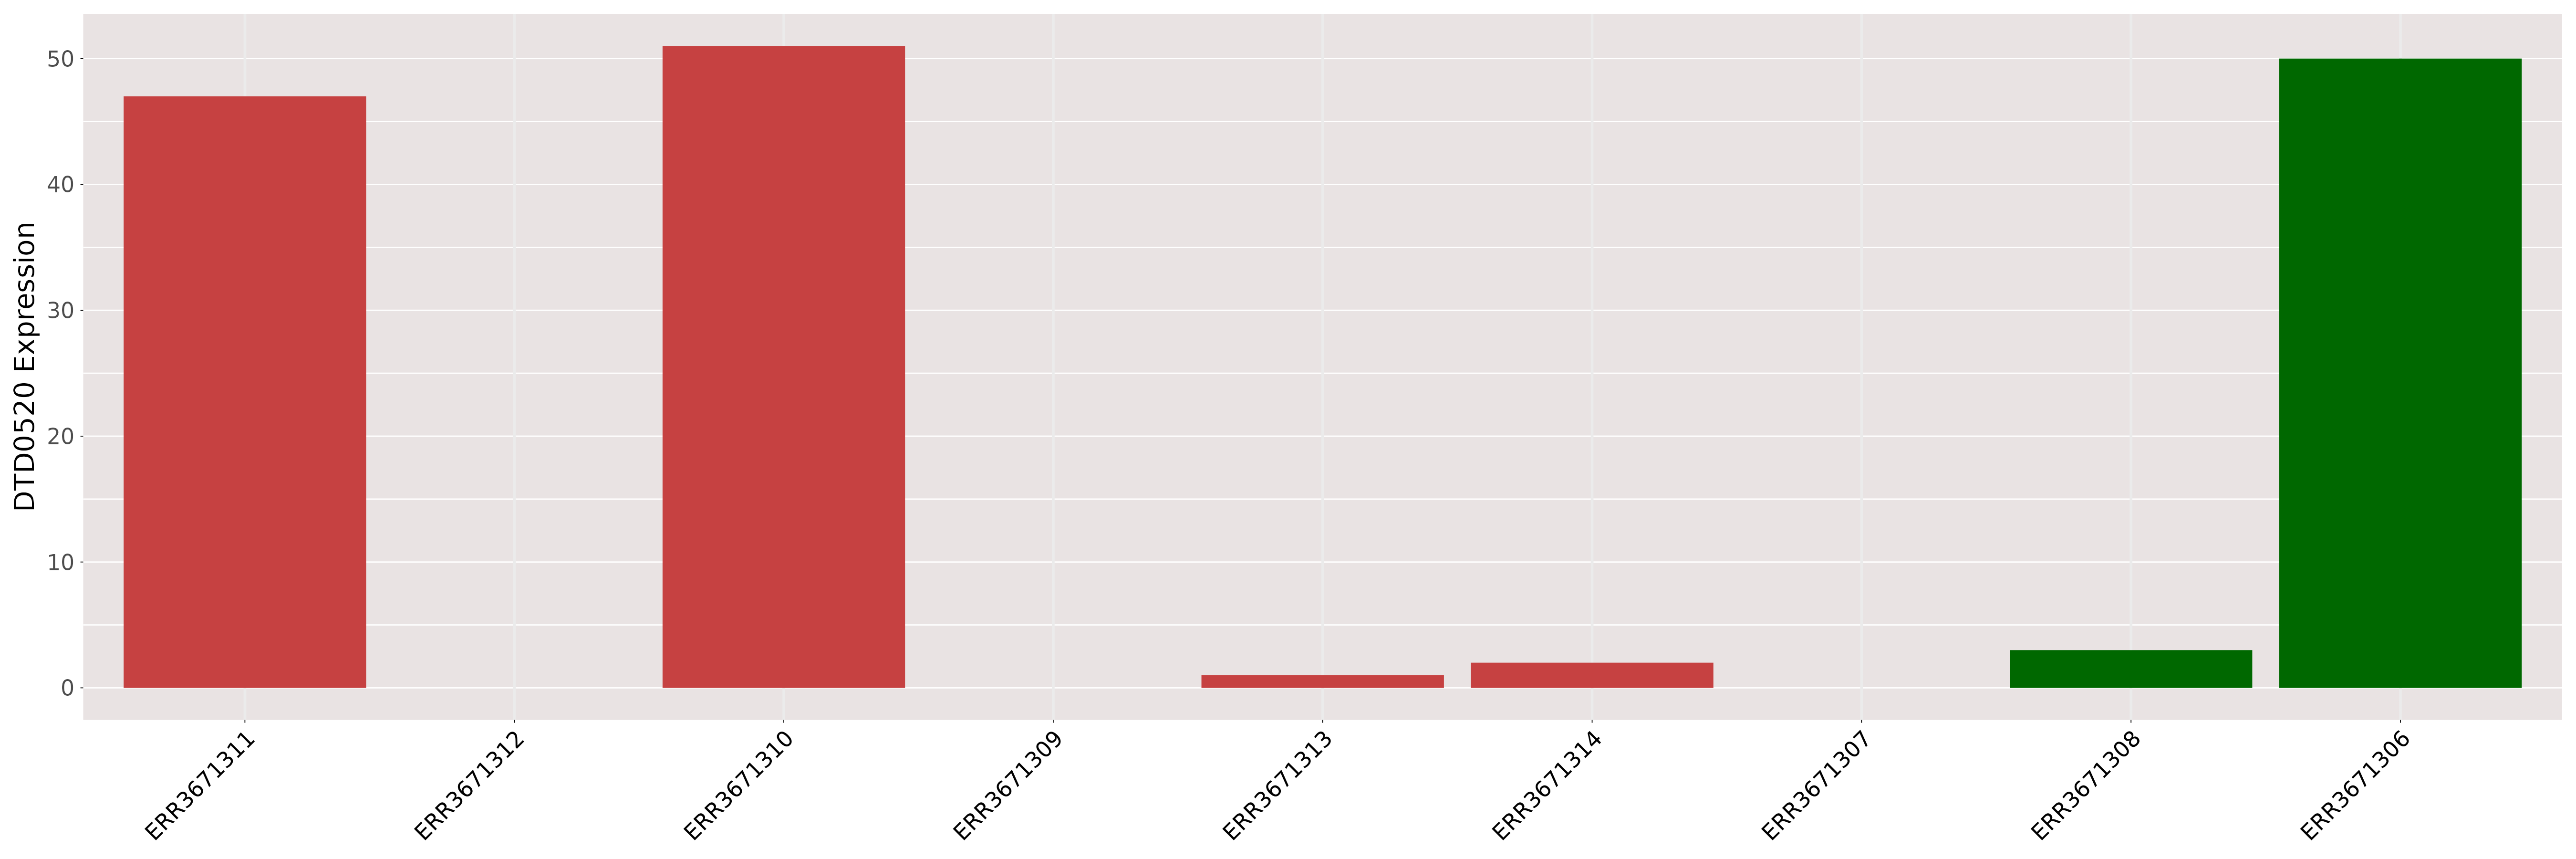
Please Click the above Thumbnail to View/Download the Expression Barchart for All Samples | ||||
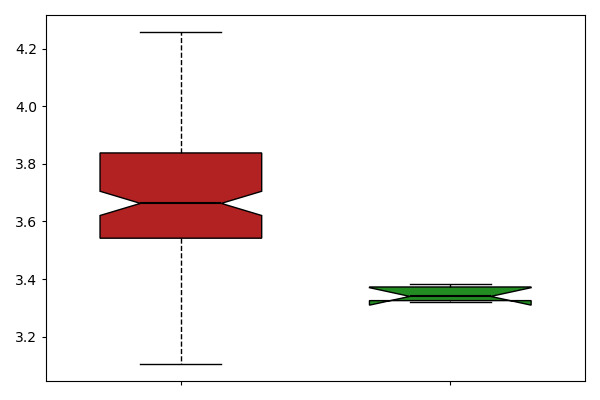
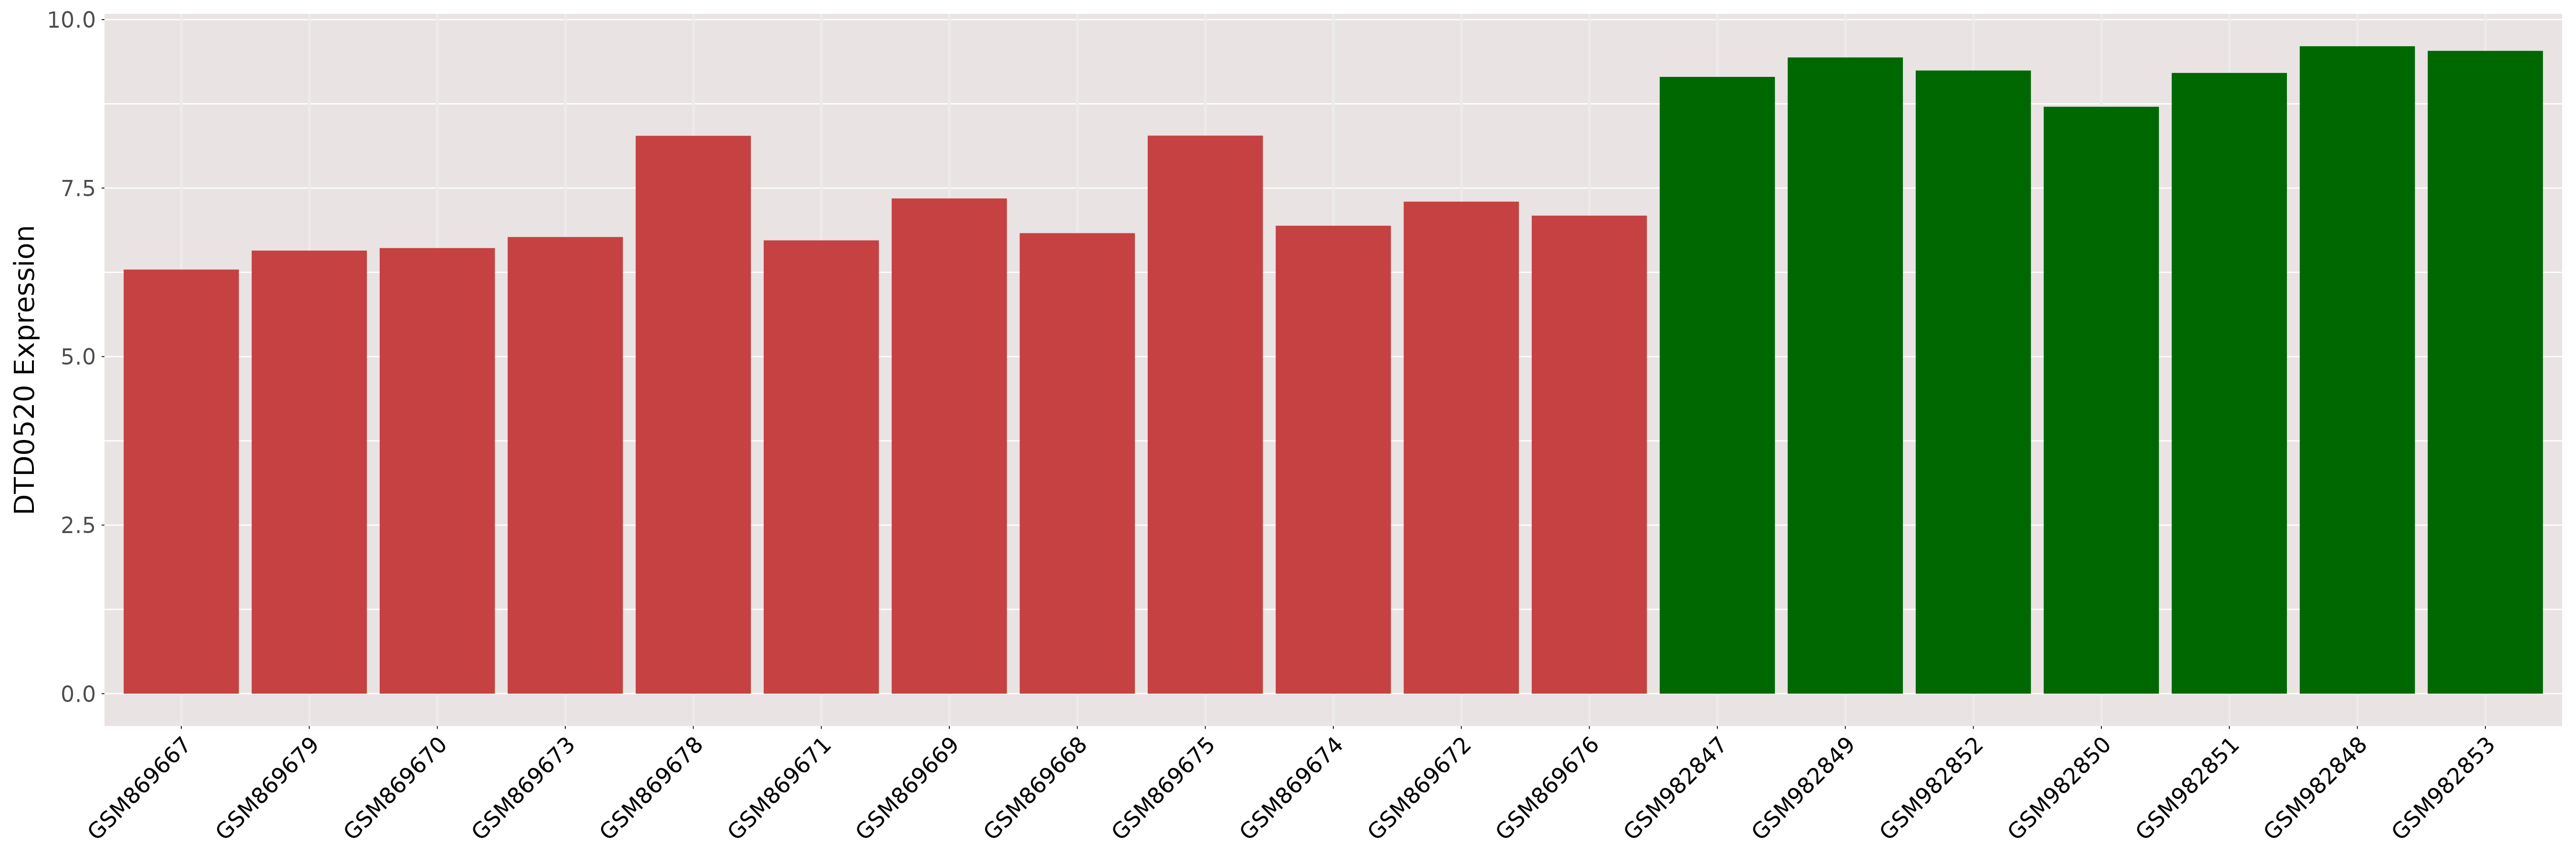
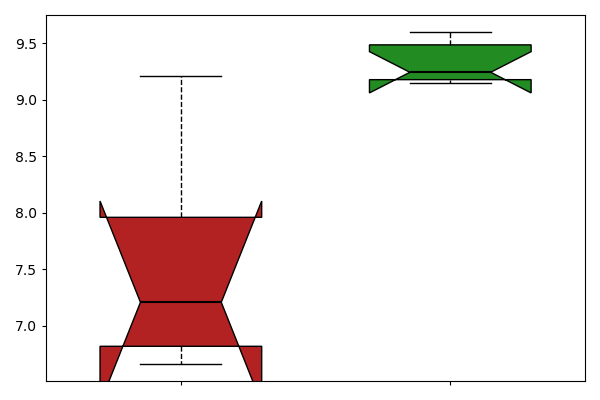
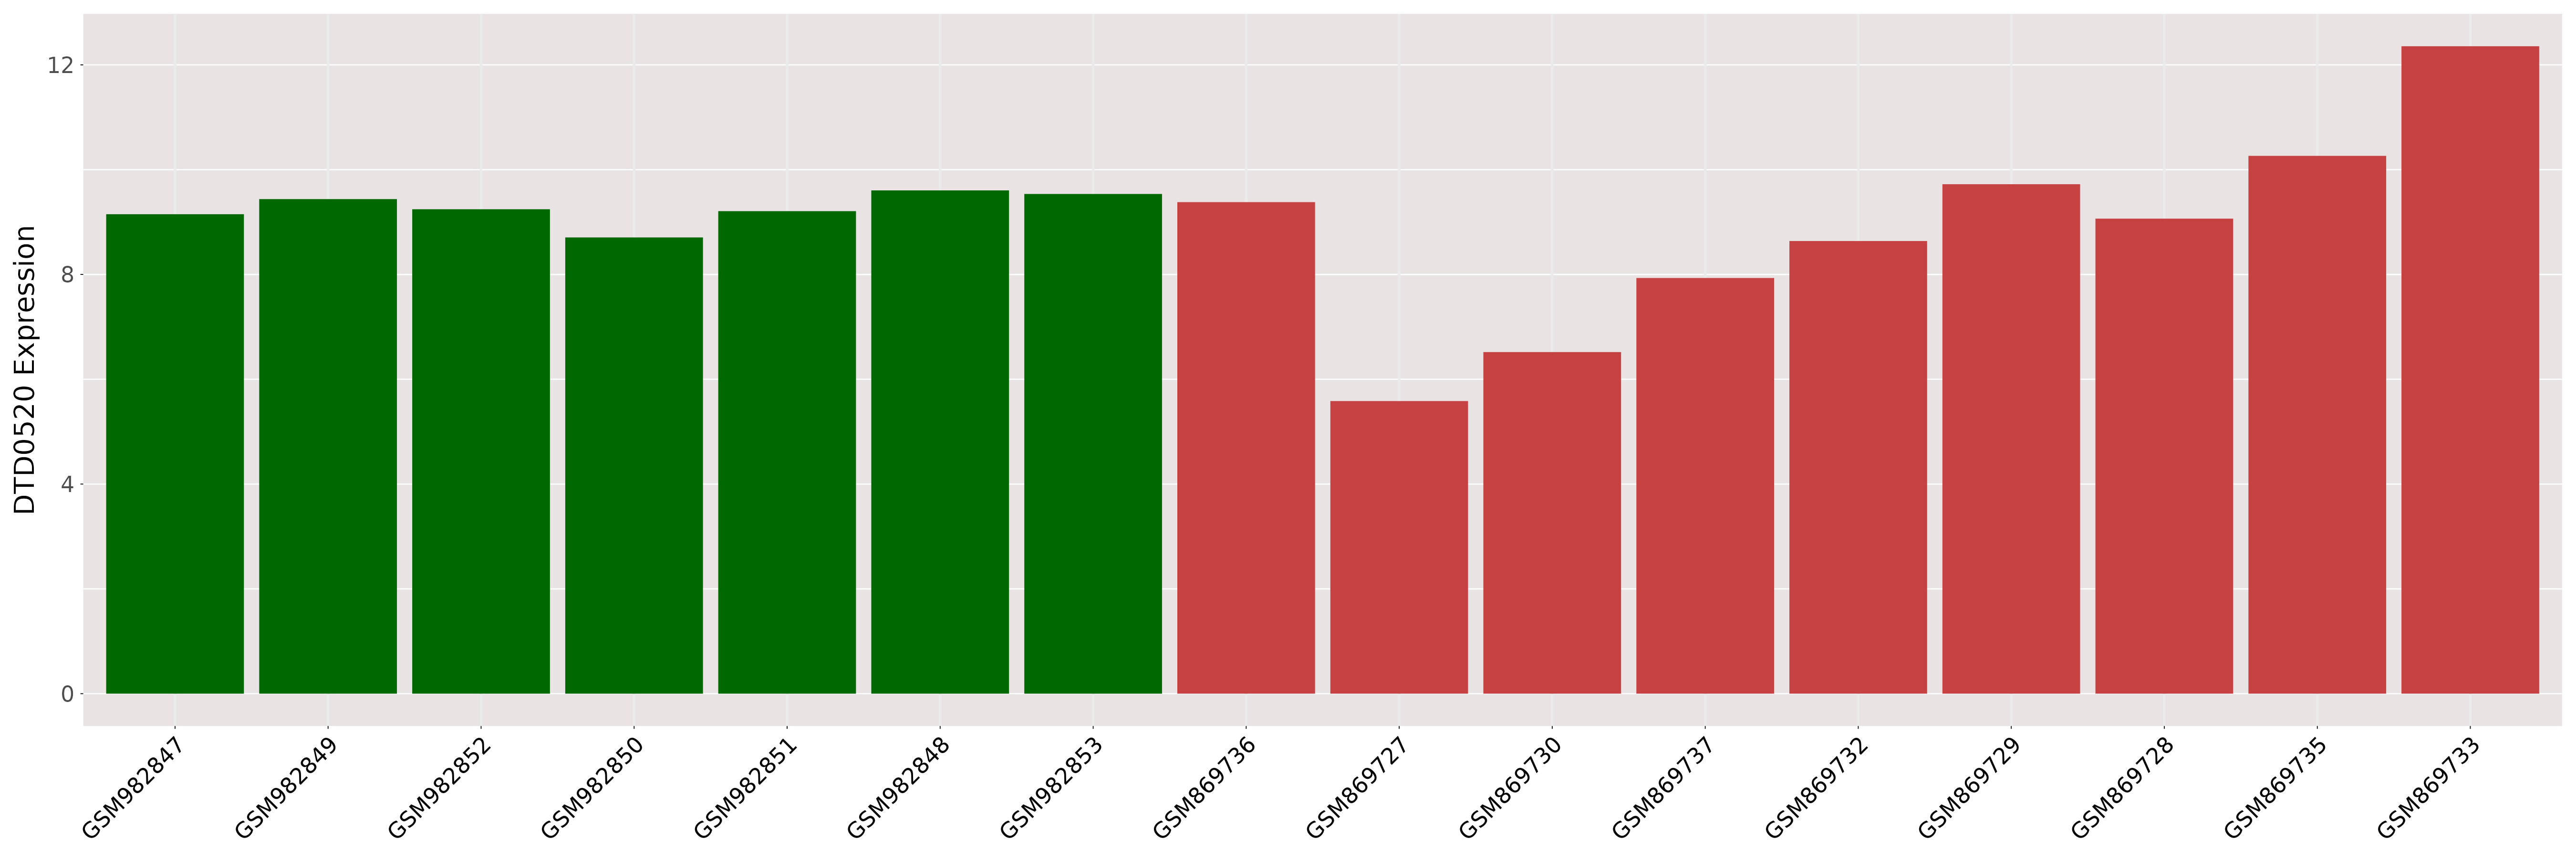
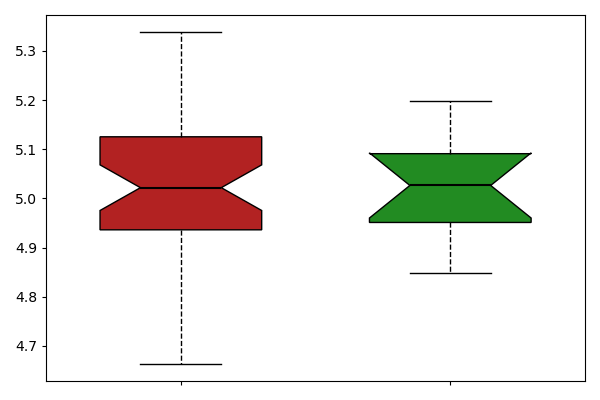
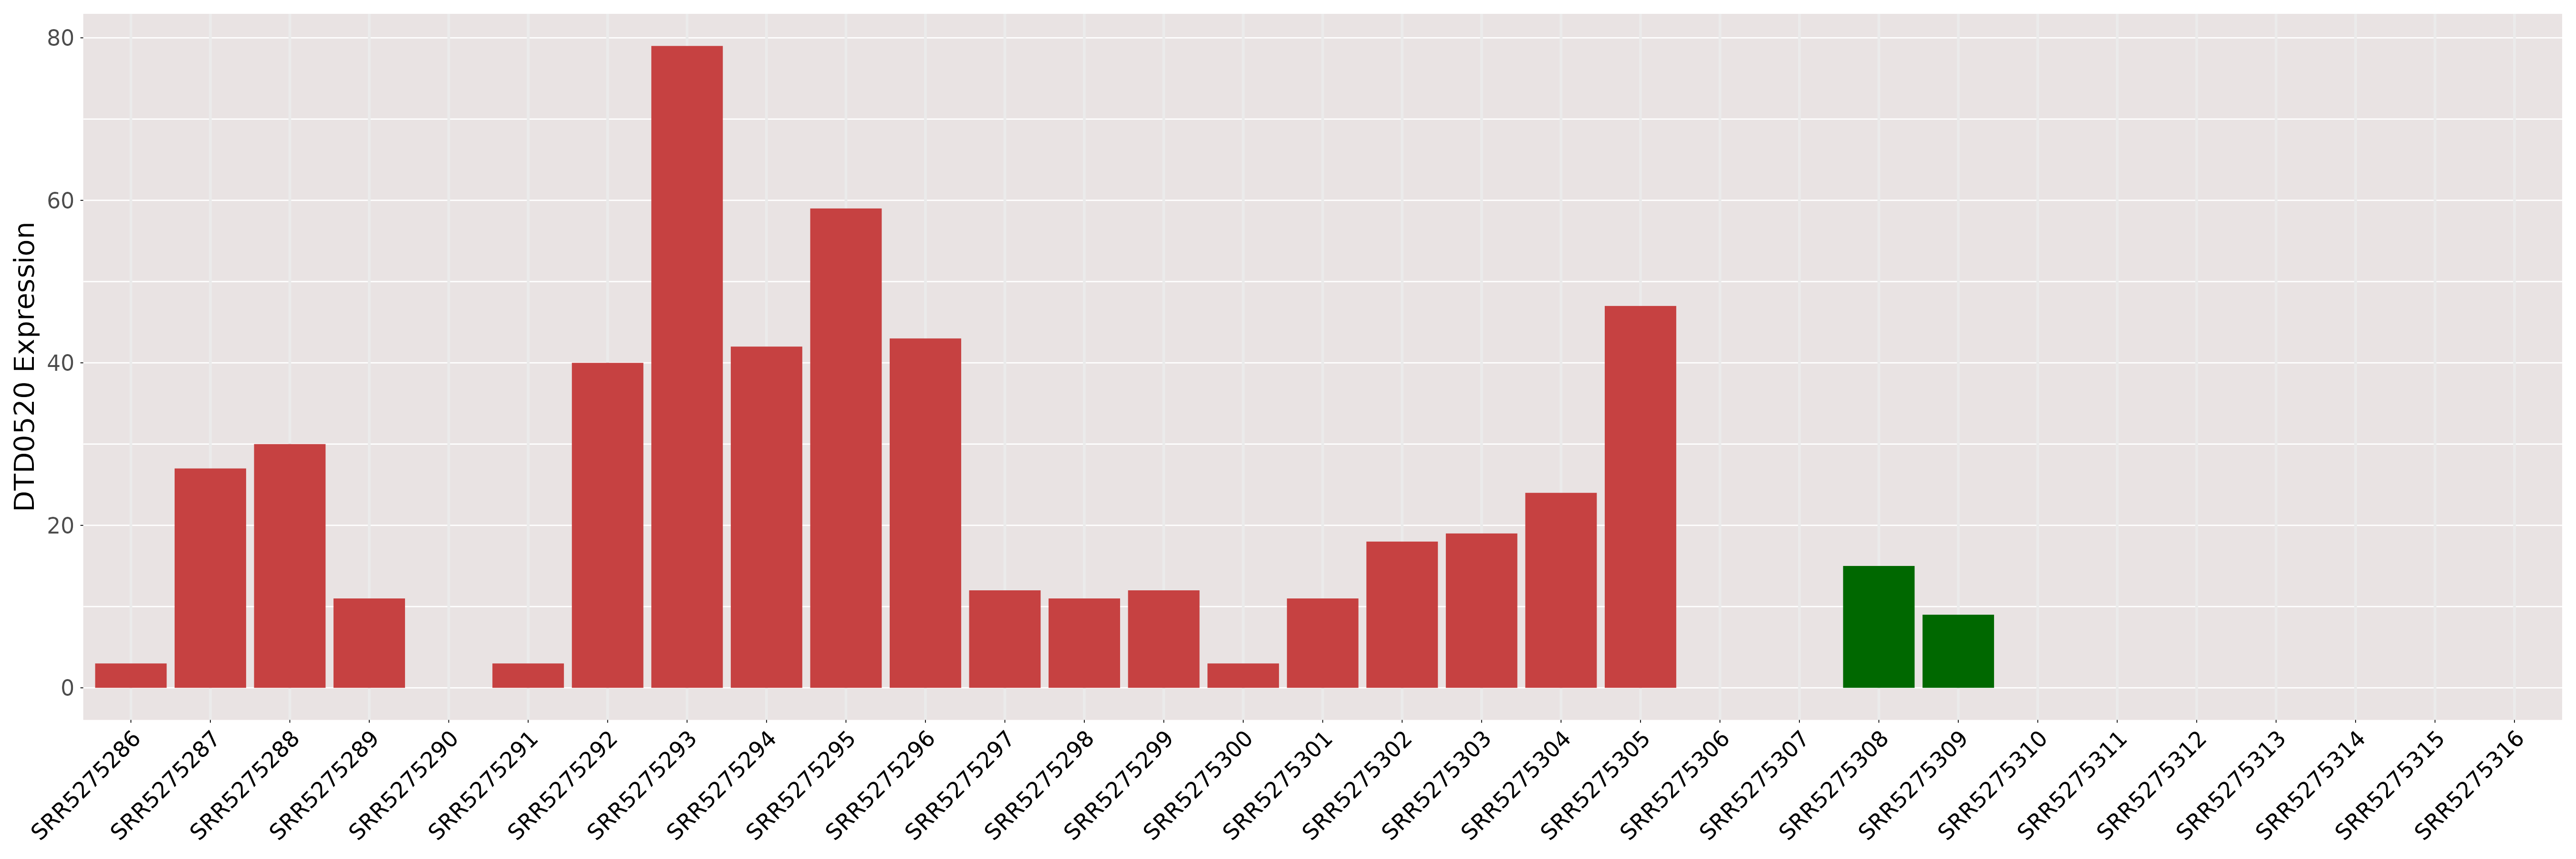
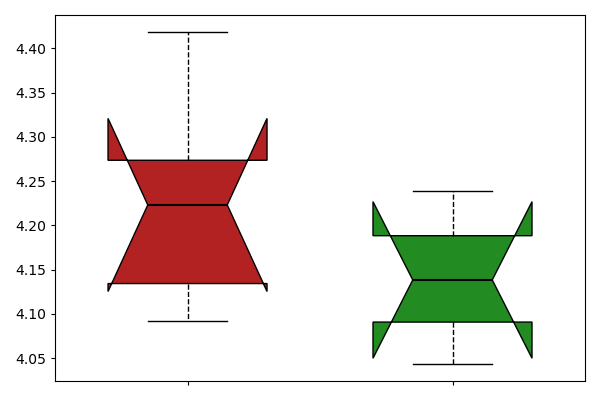
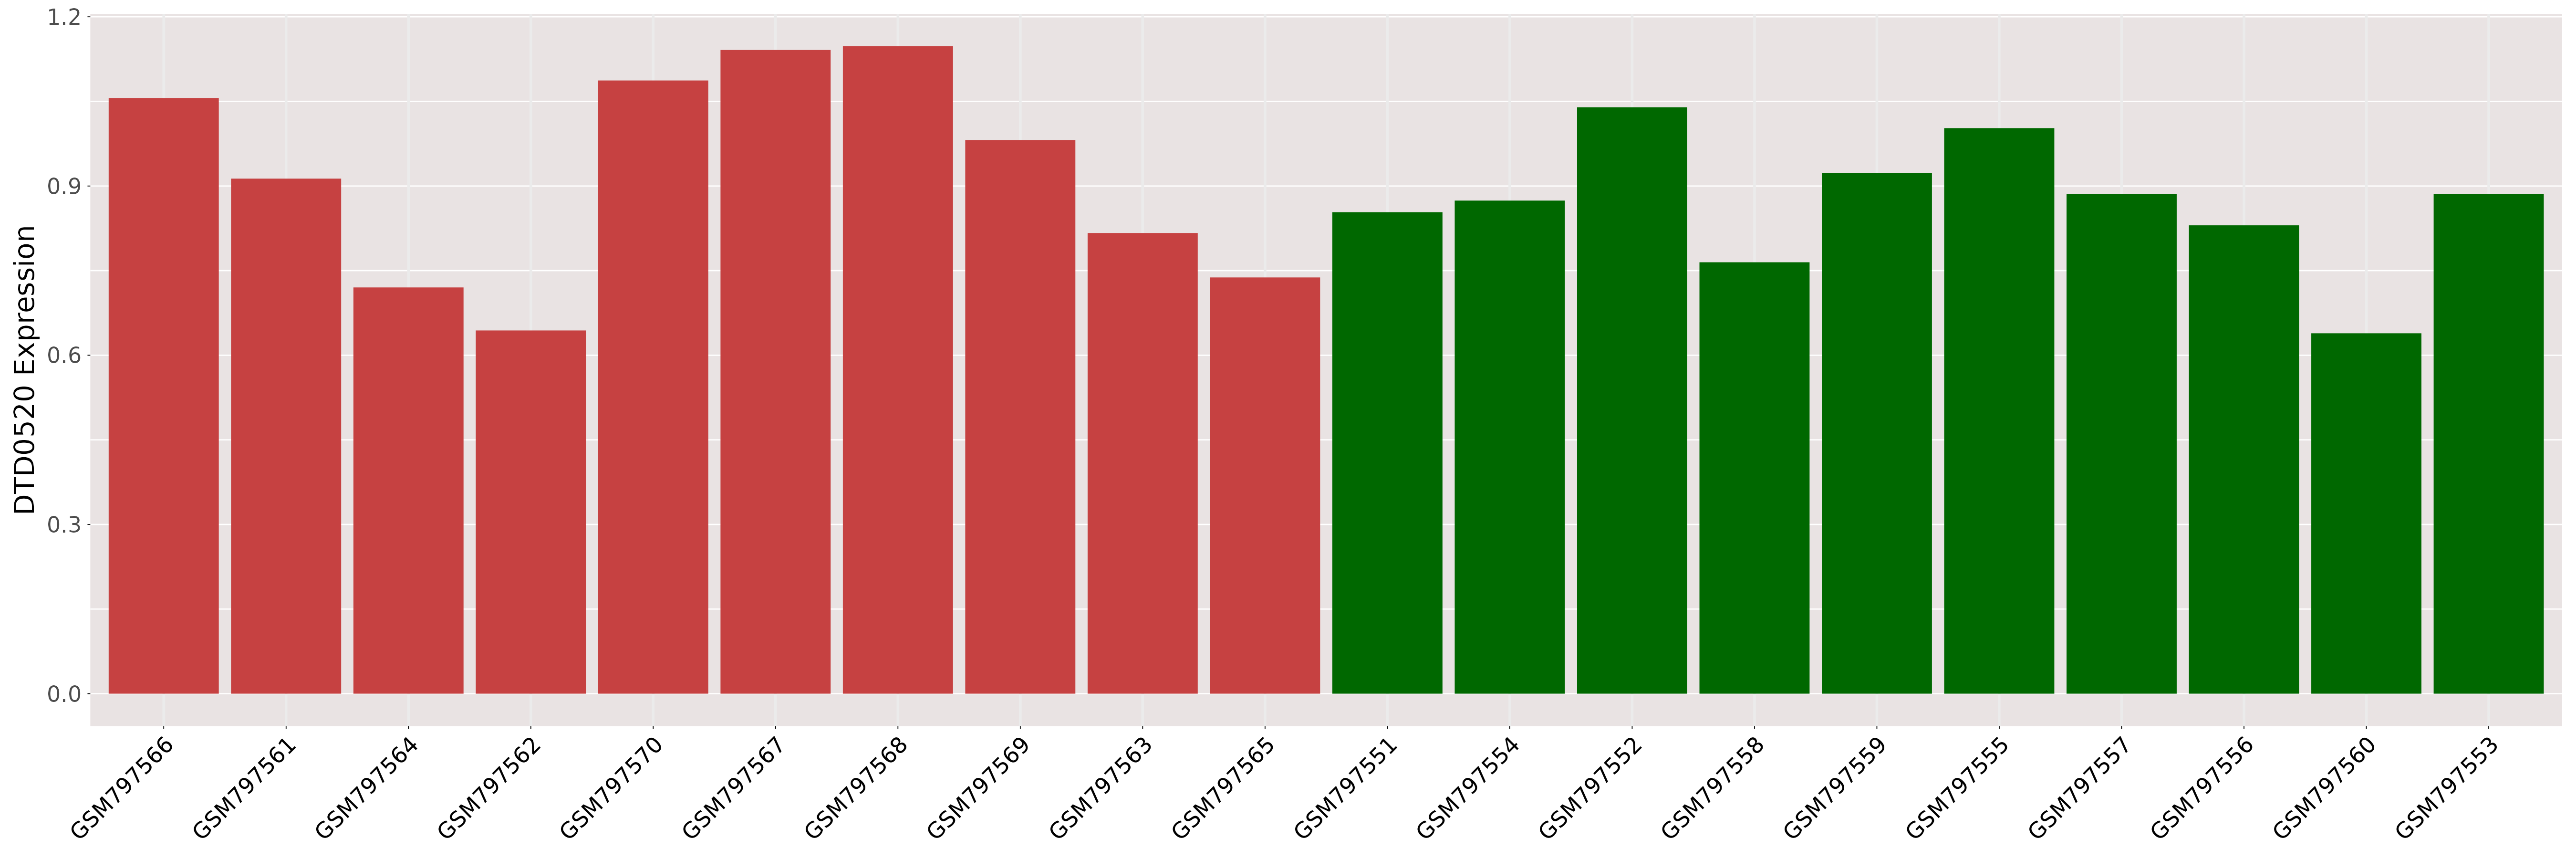
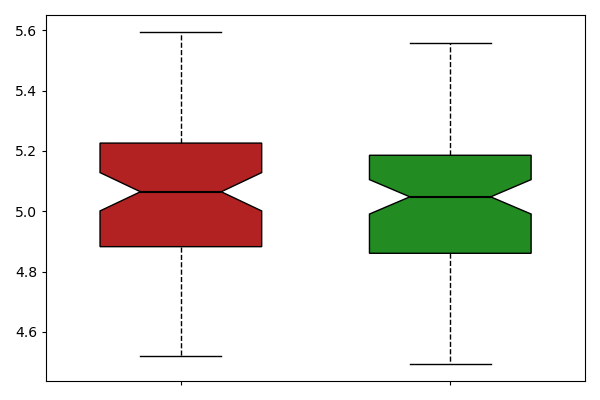
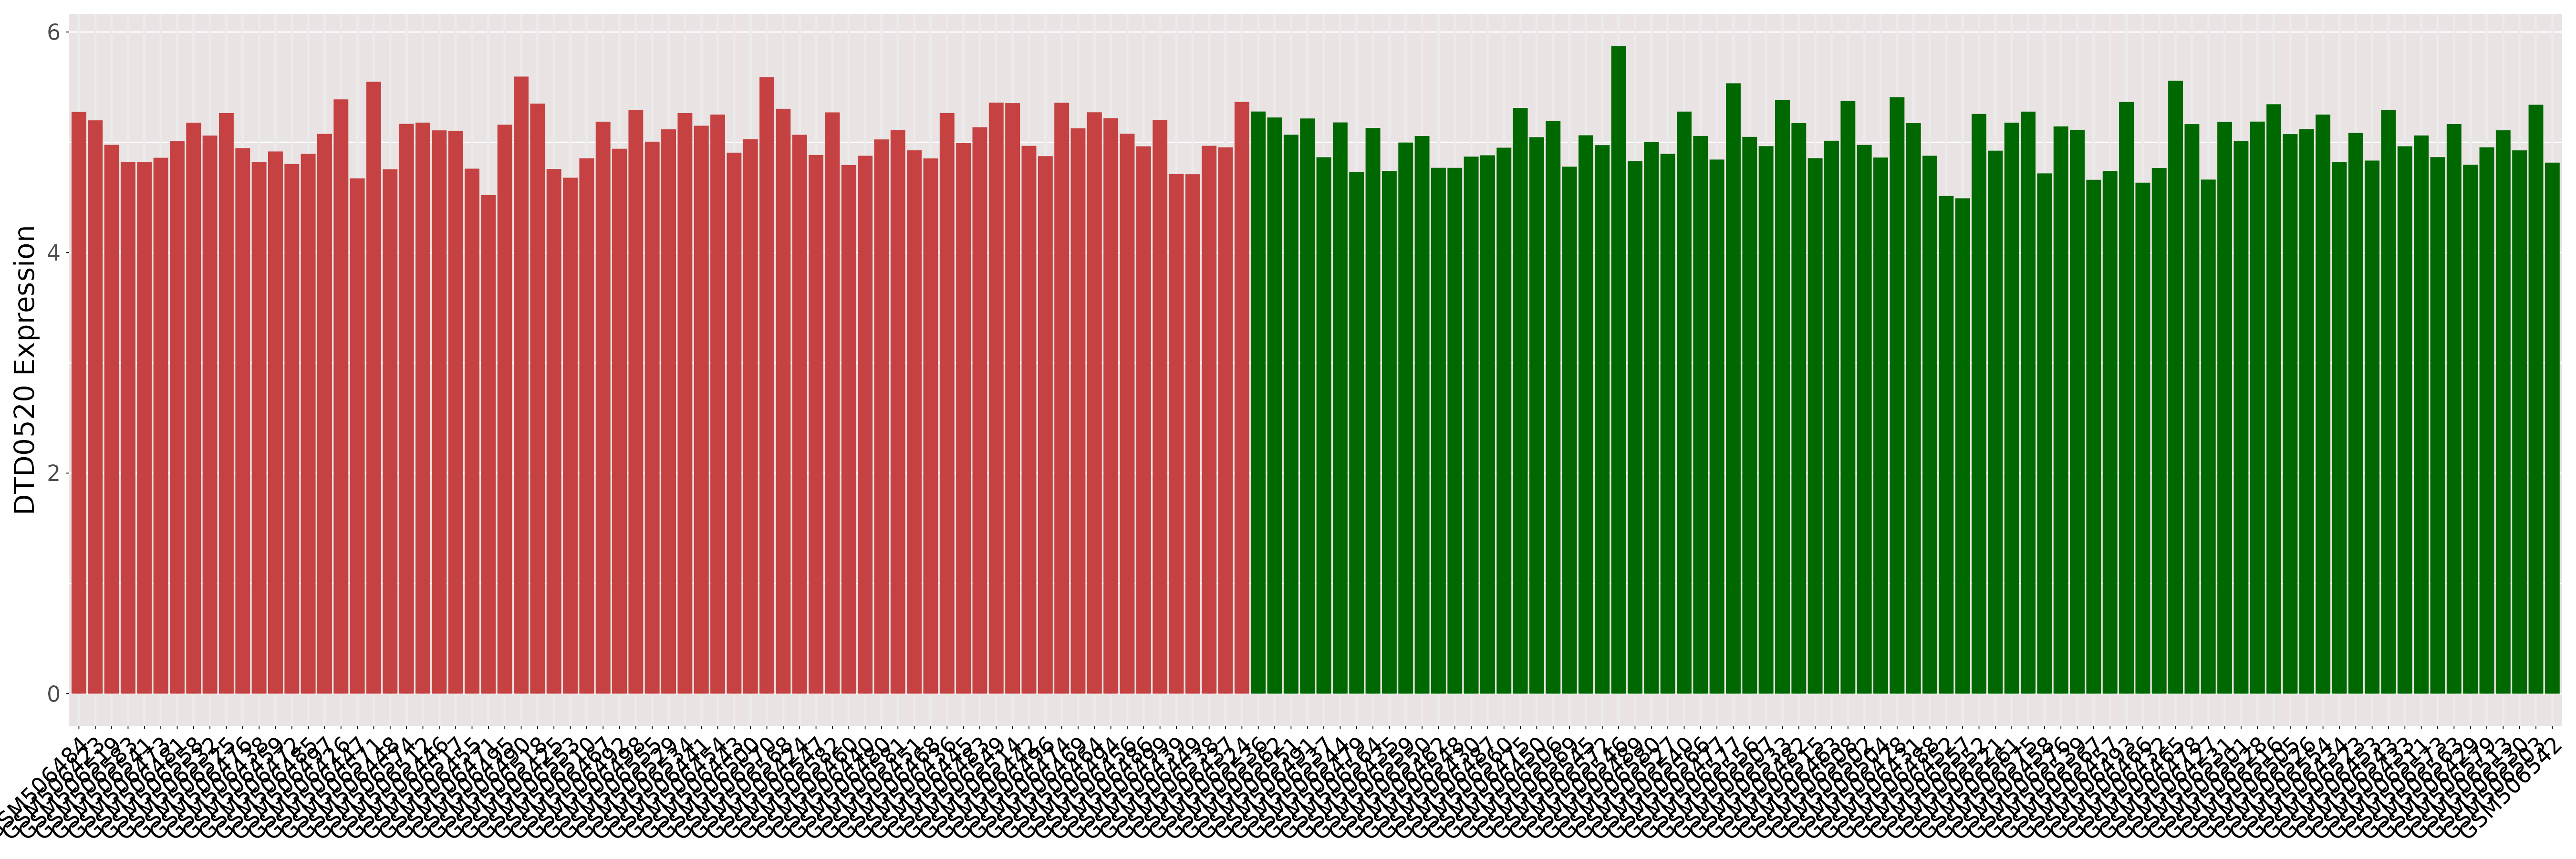
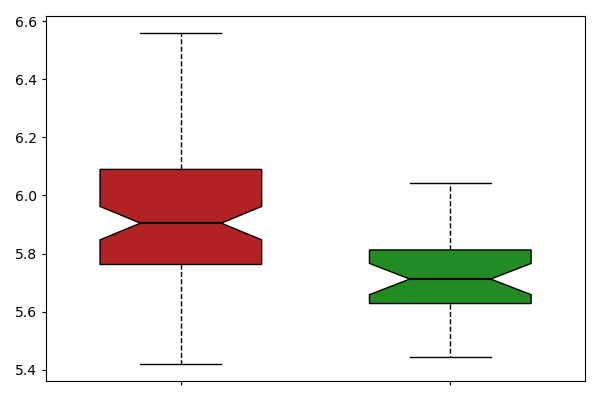
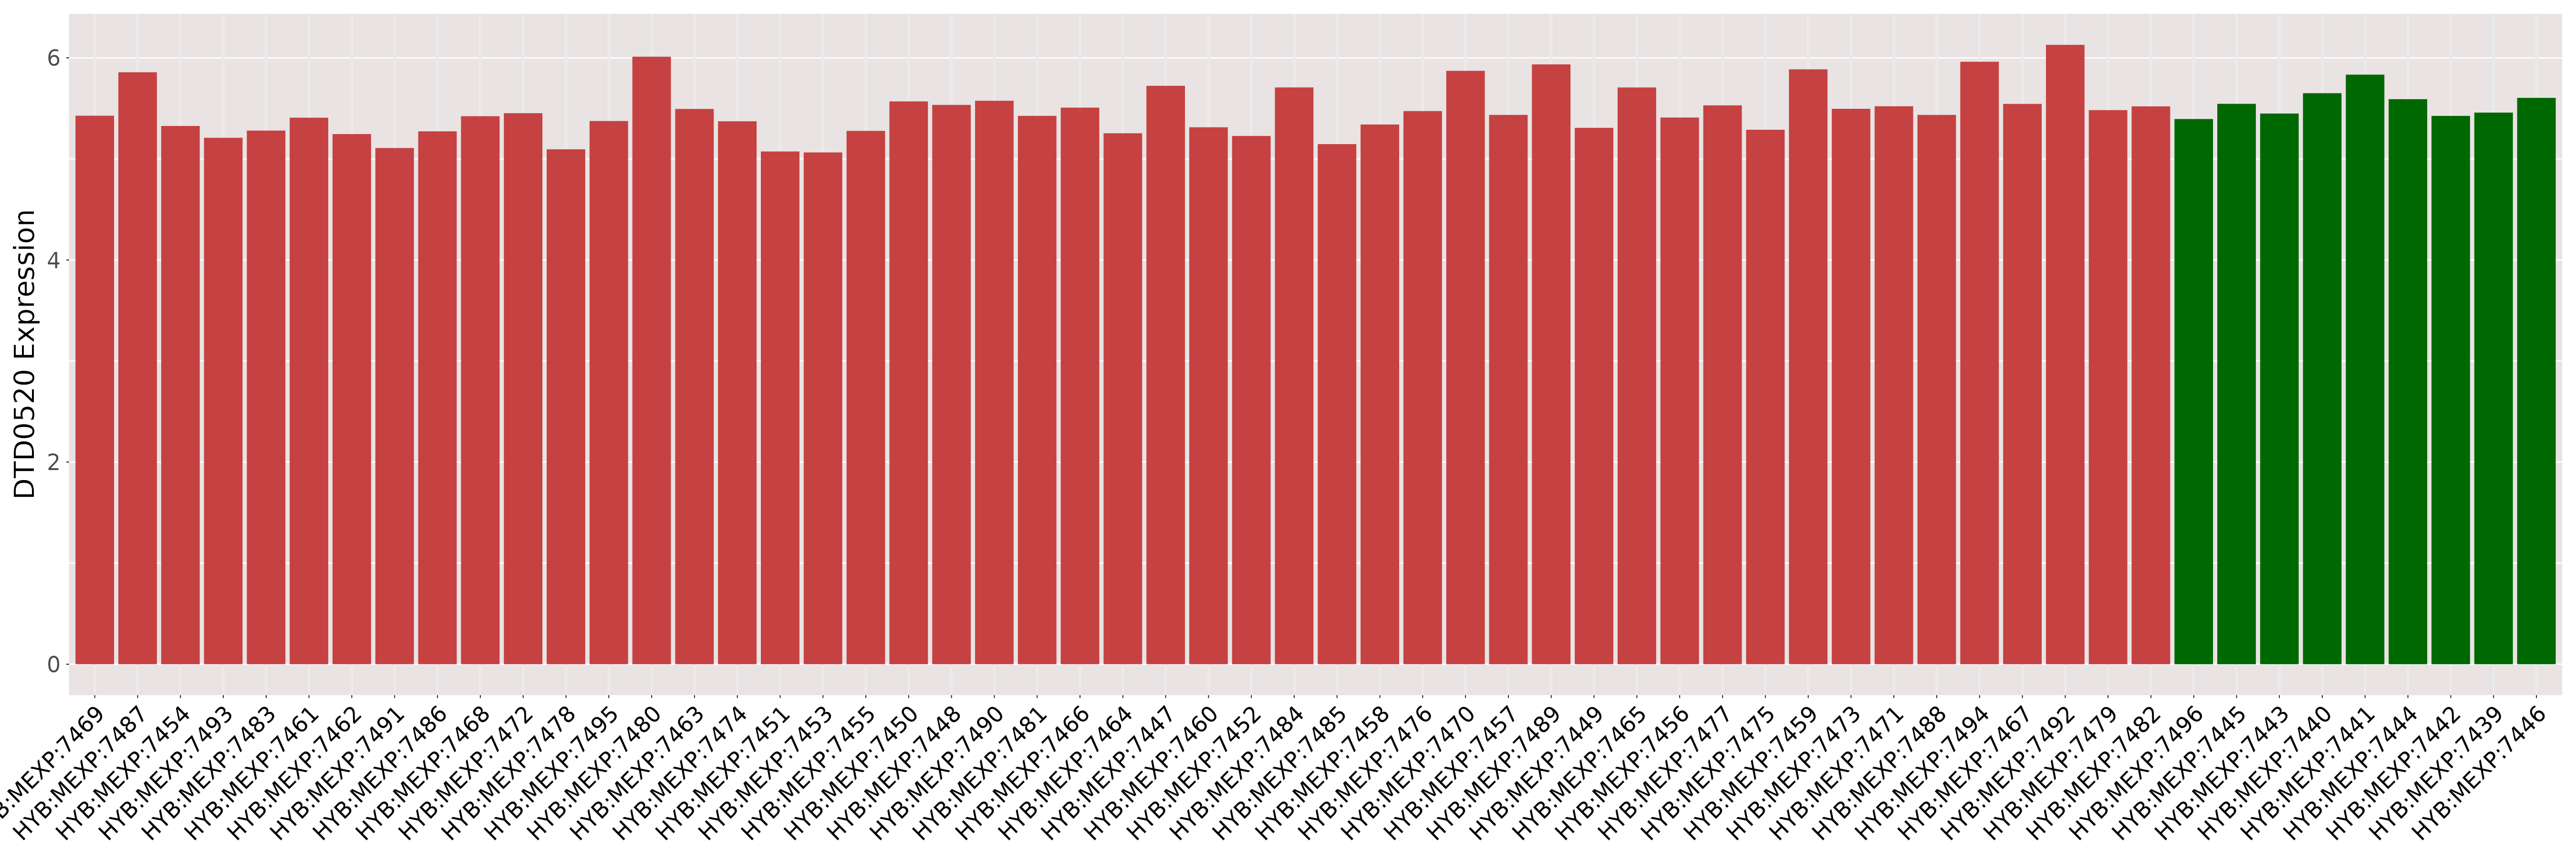
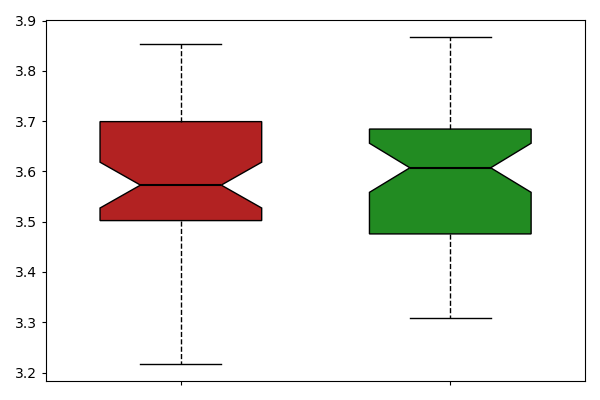
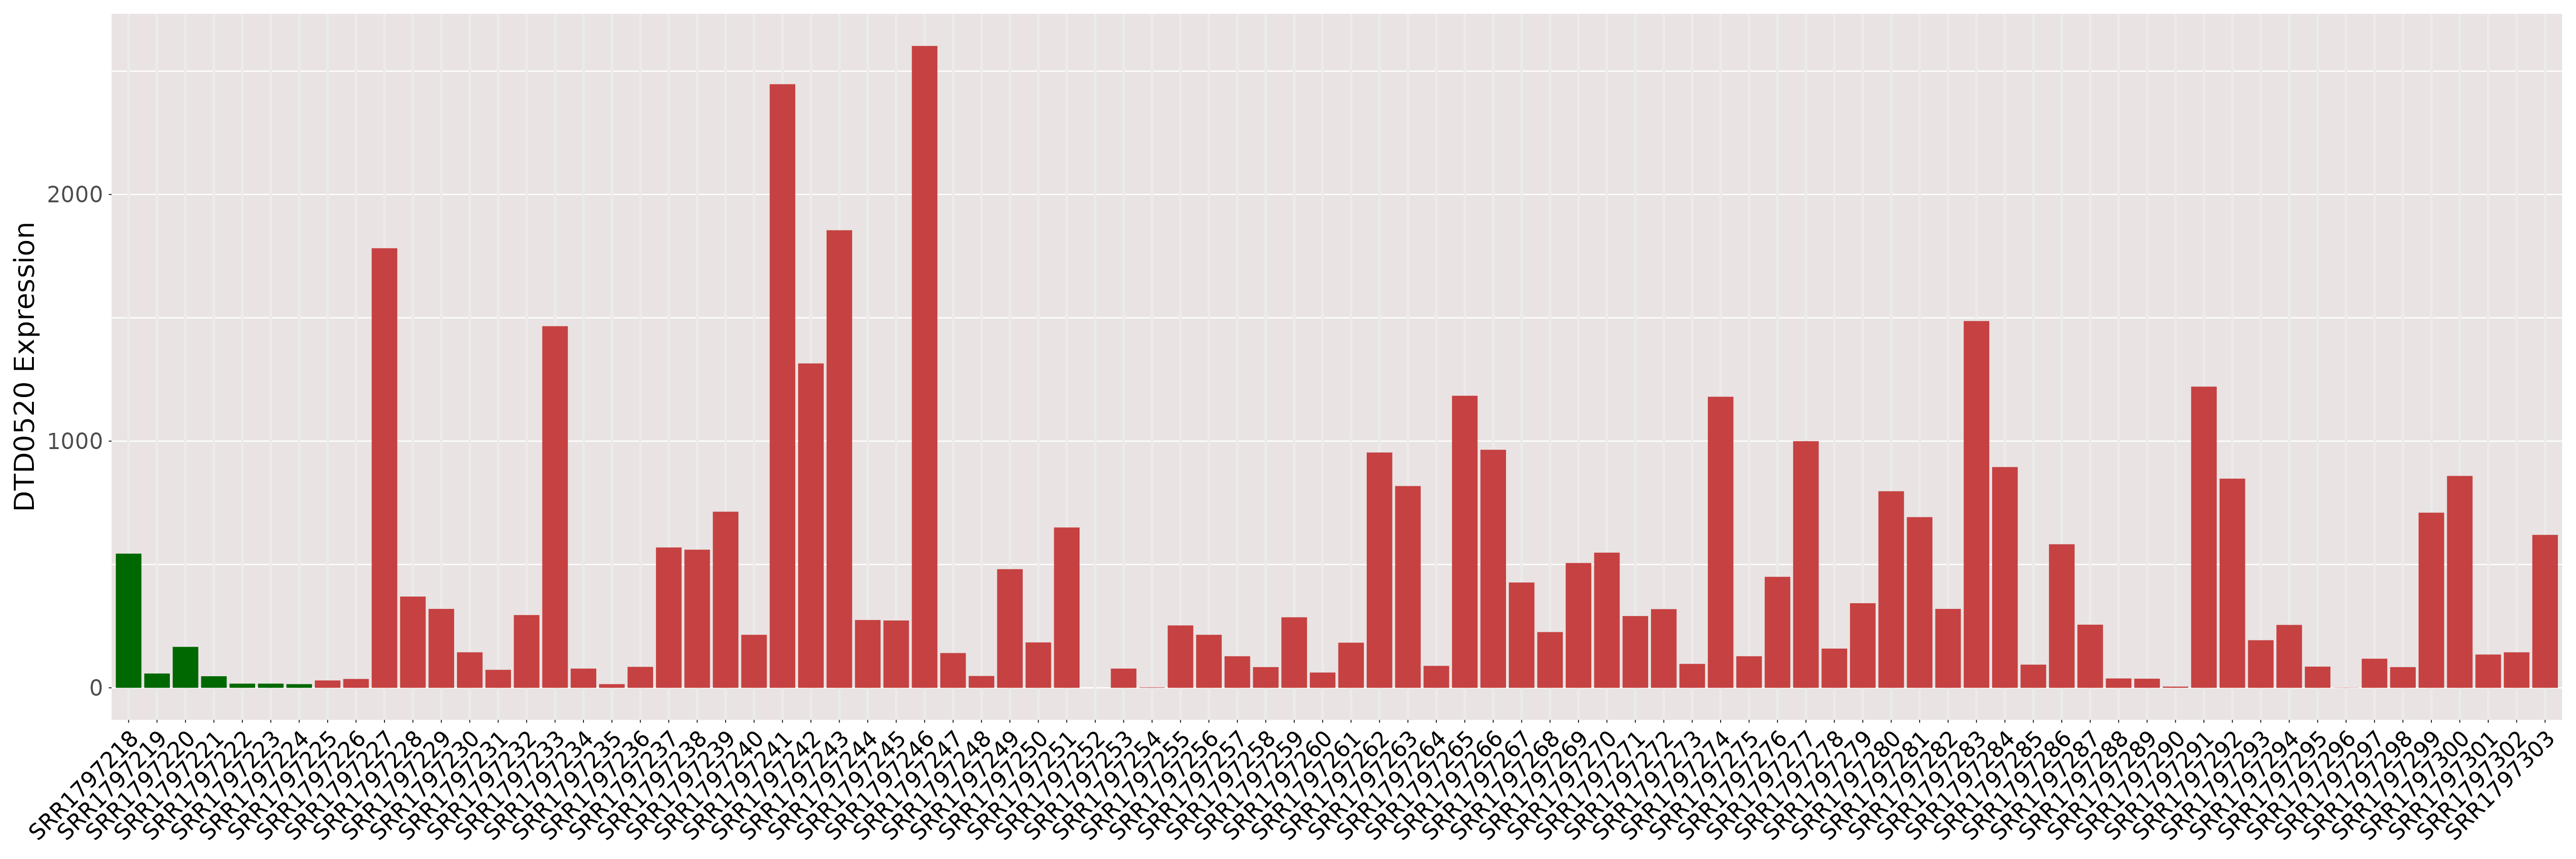
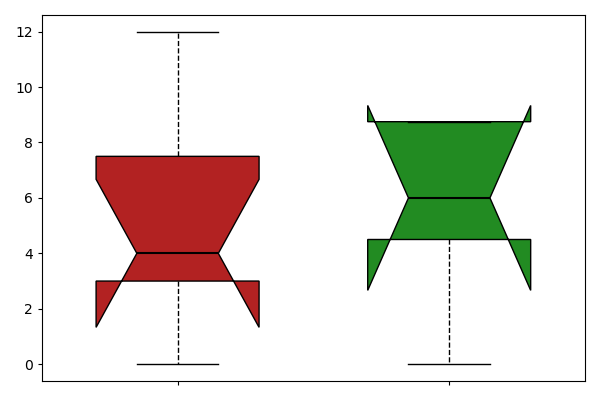
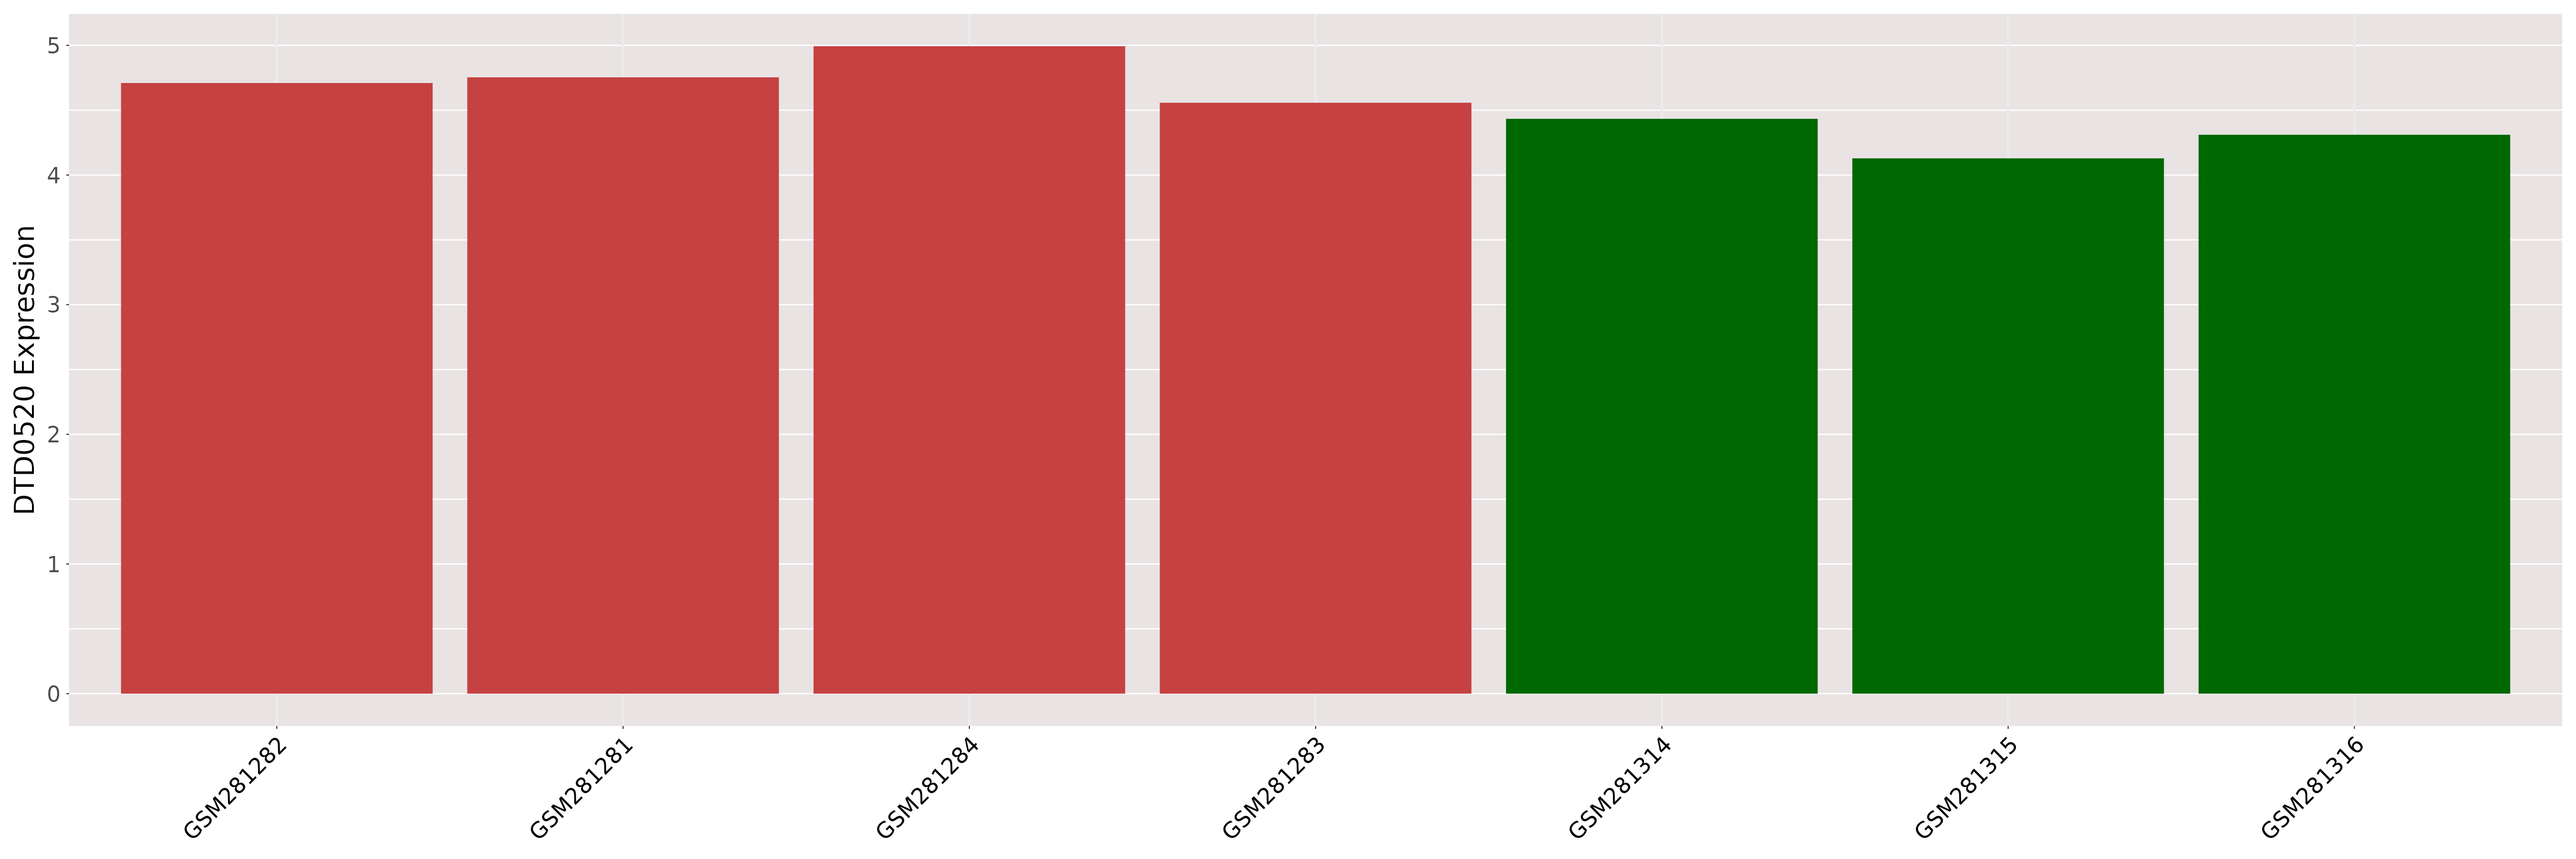
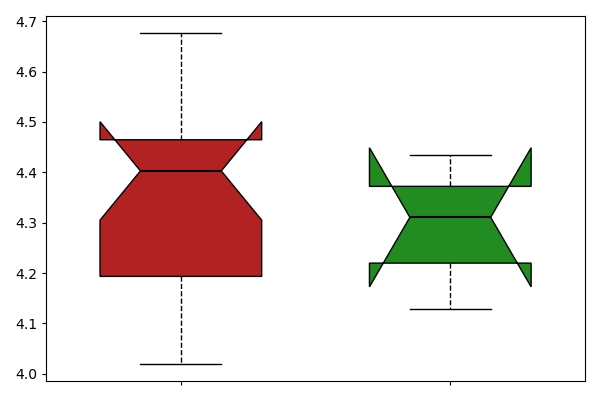
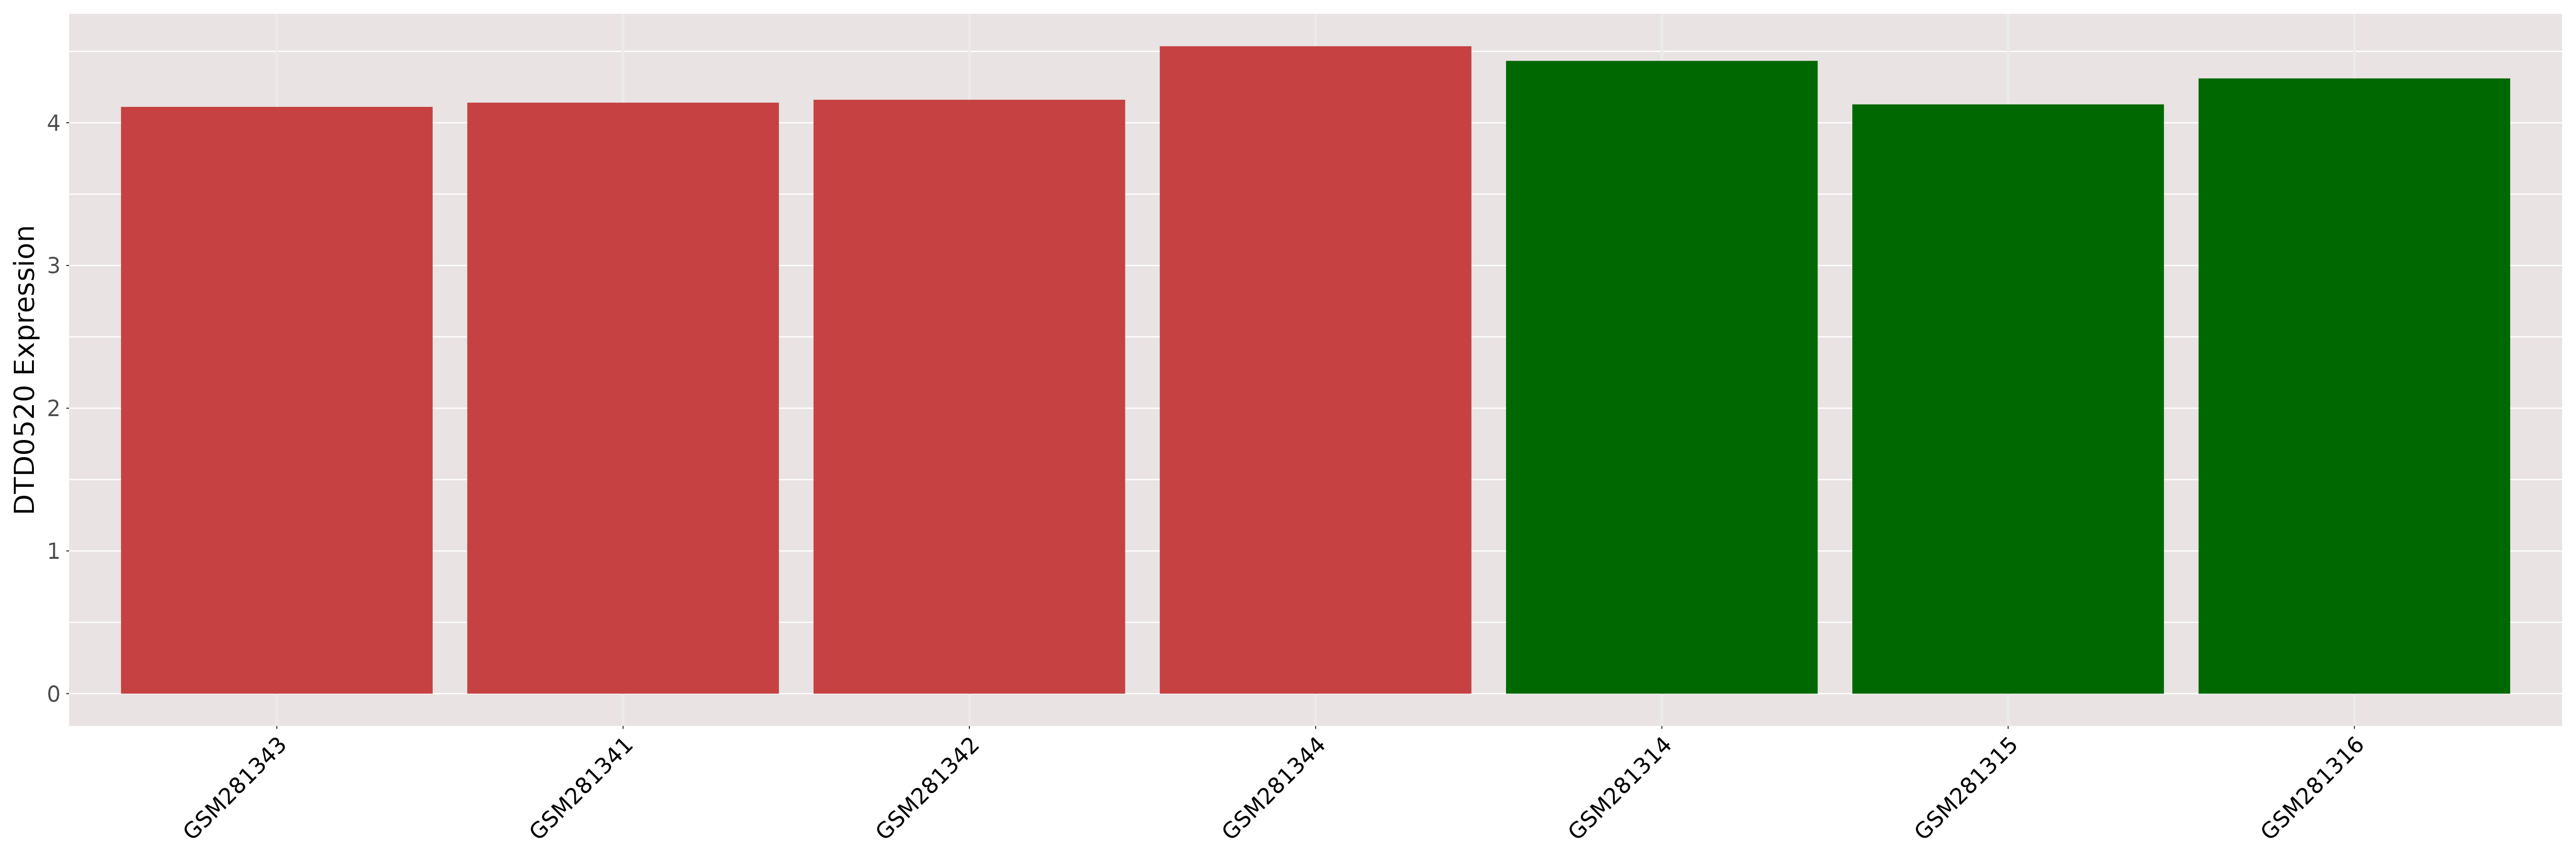
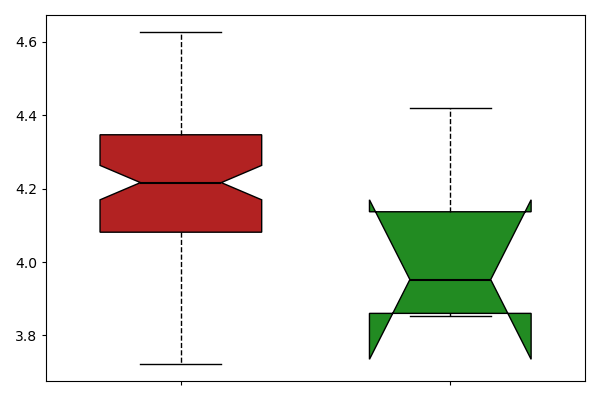
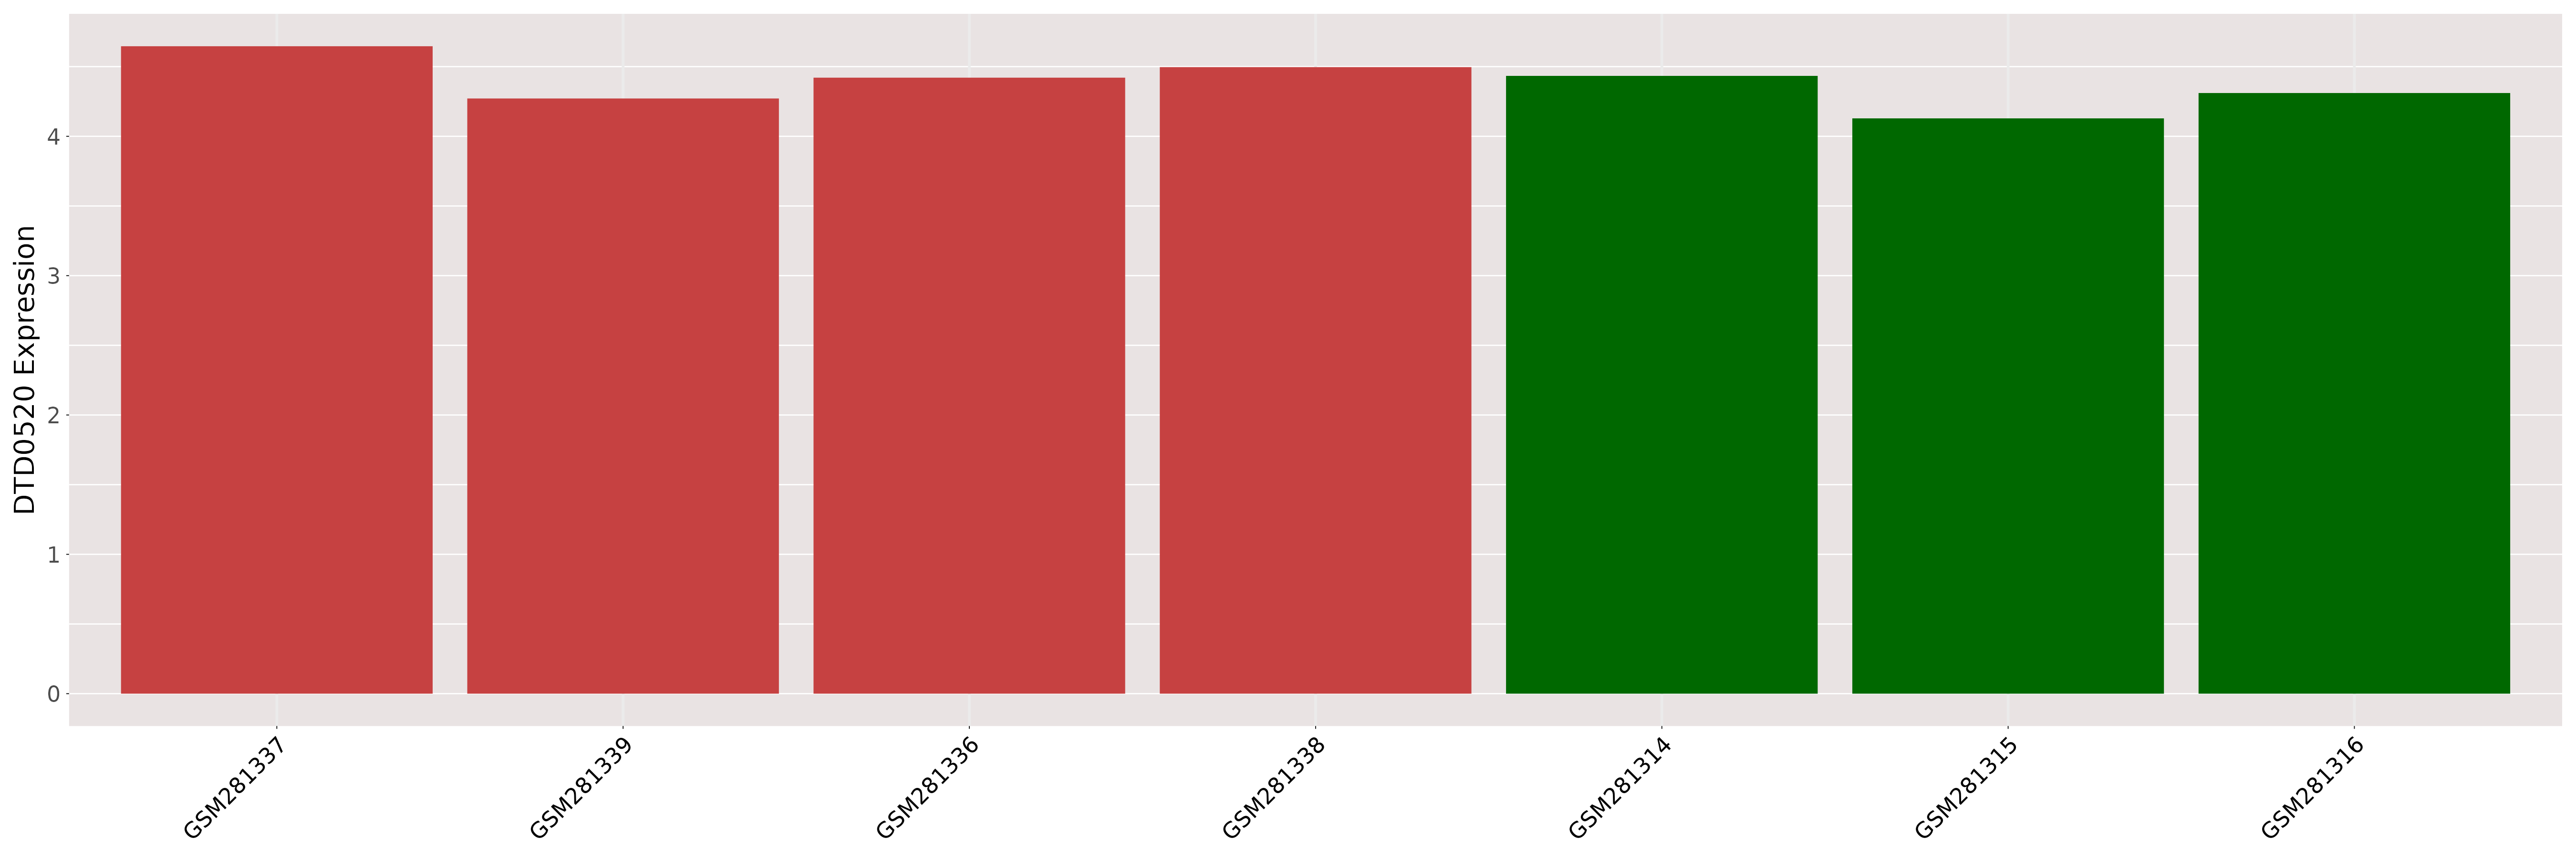
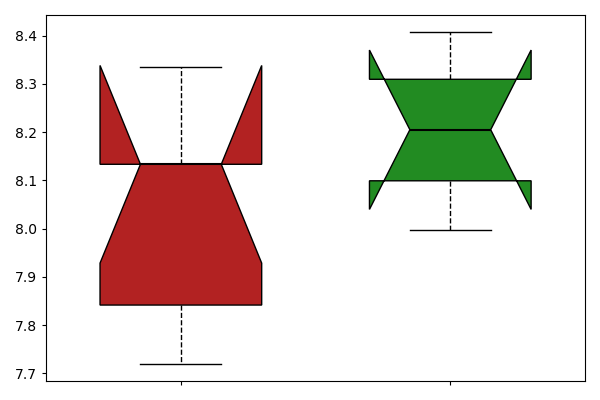
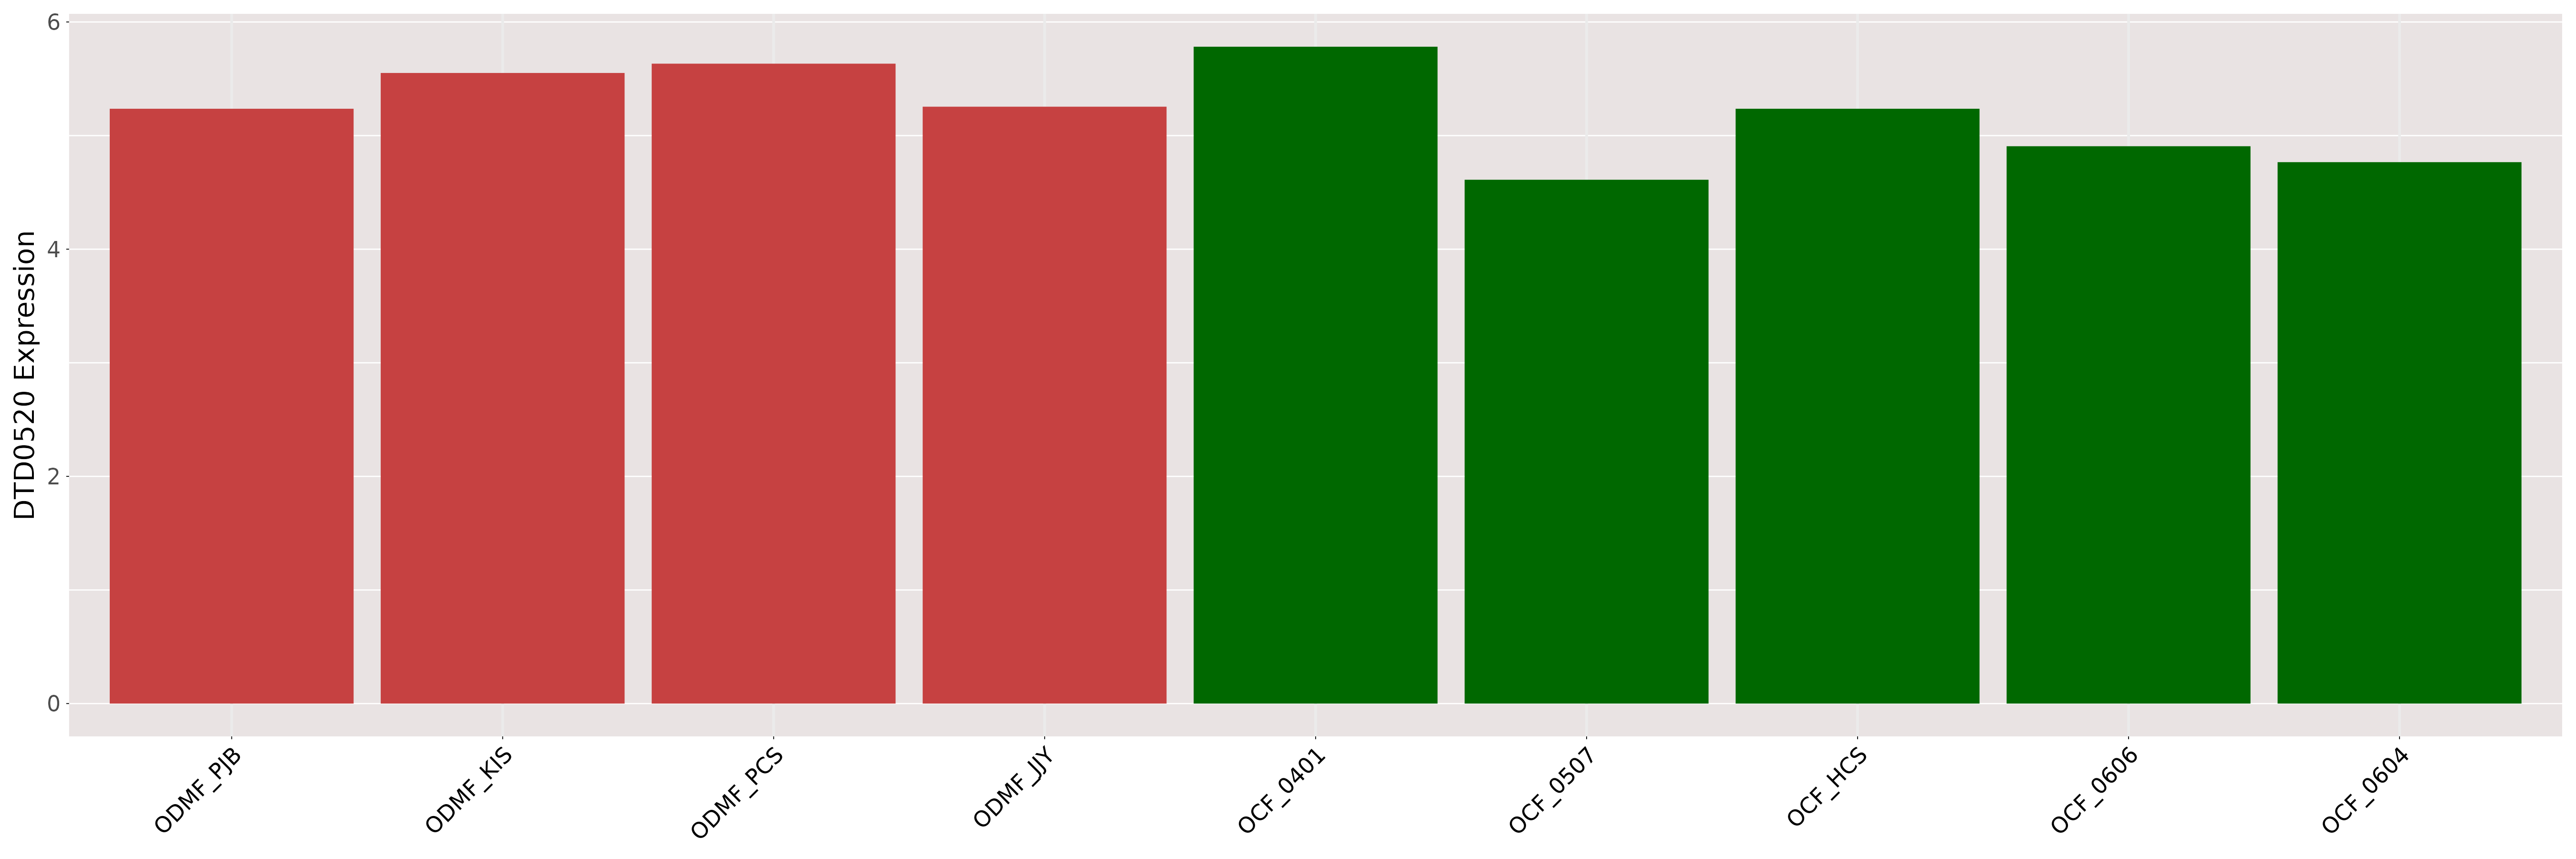
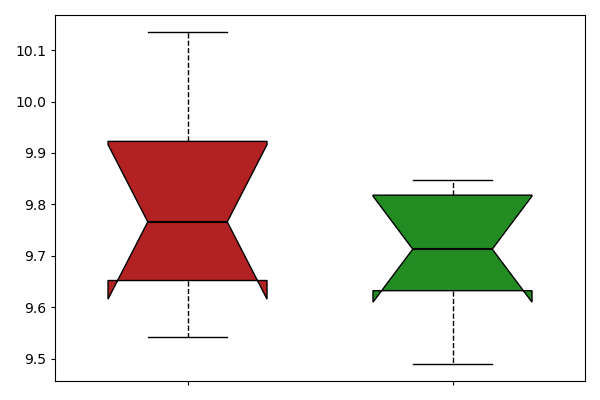
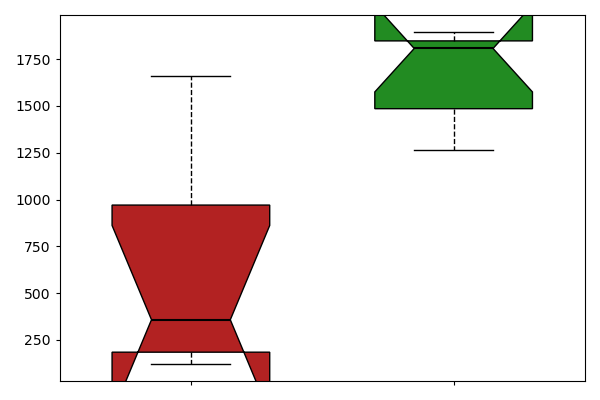
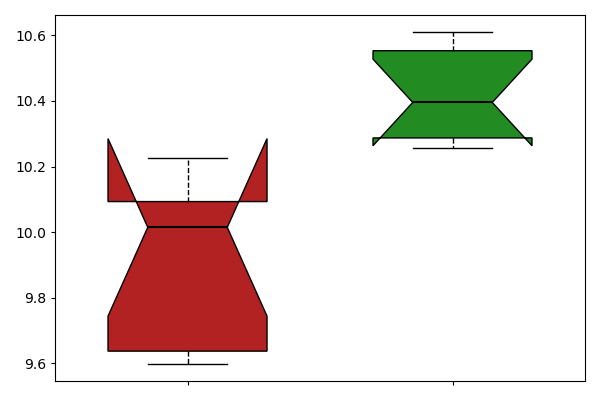
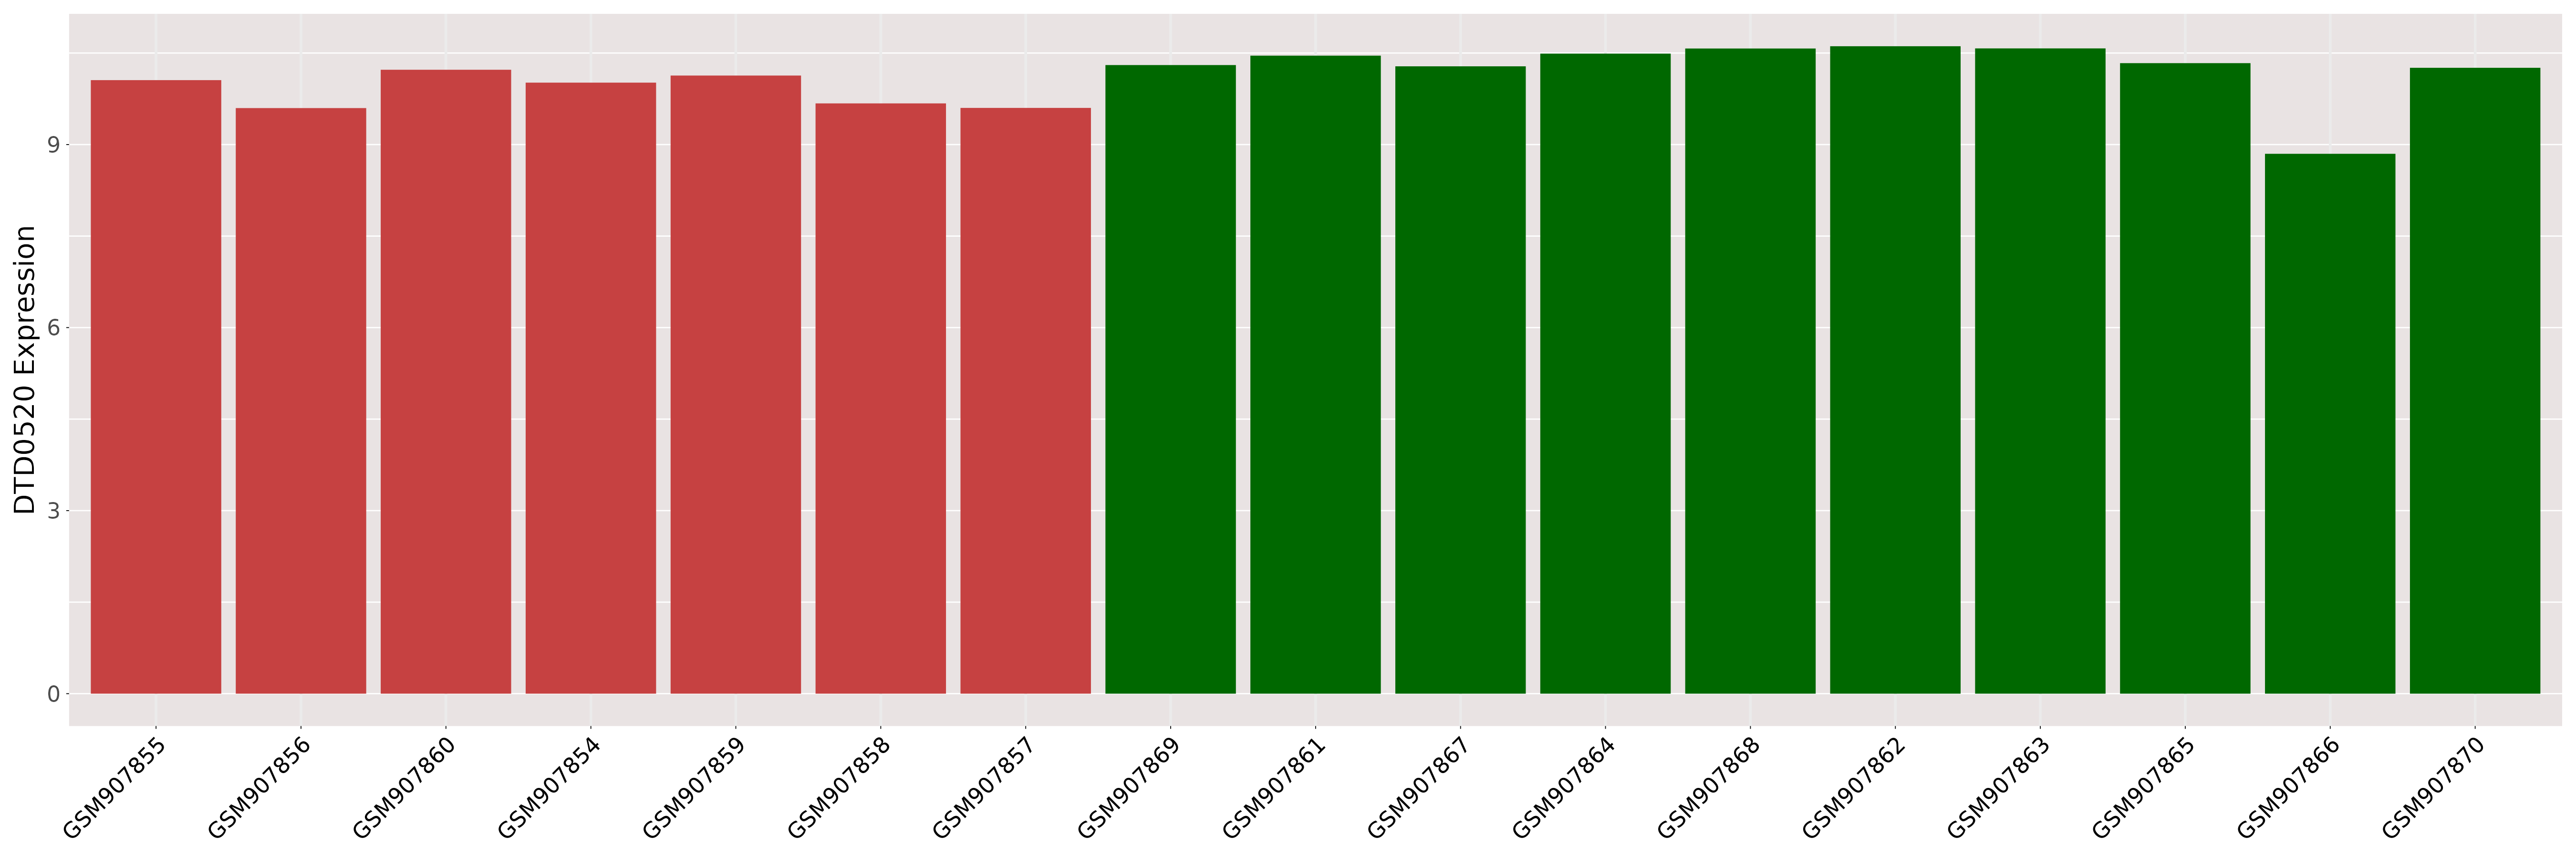
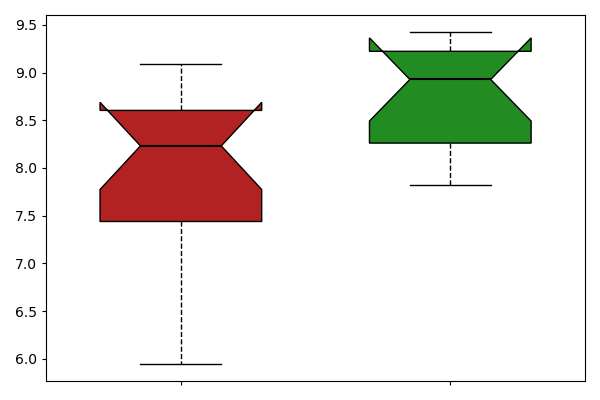
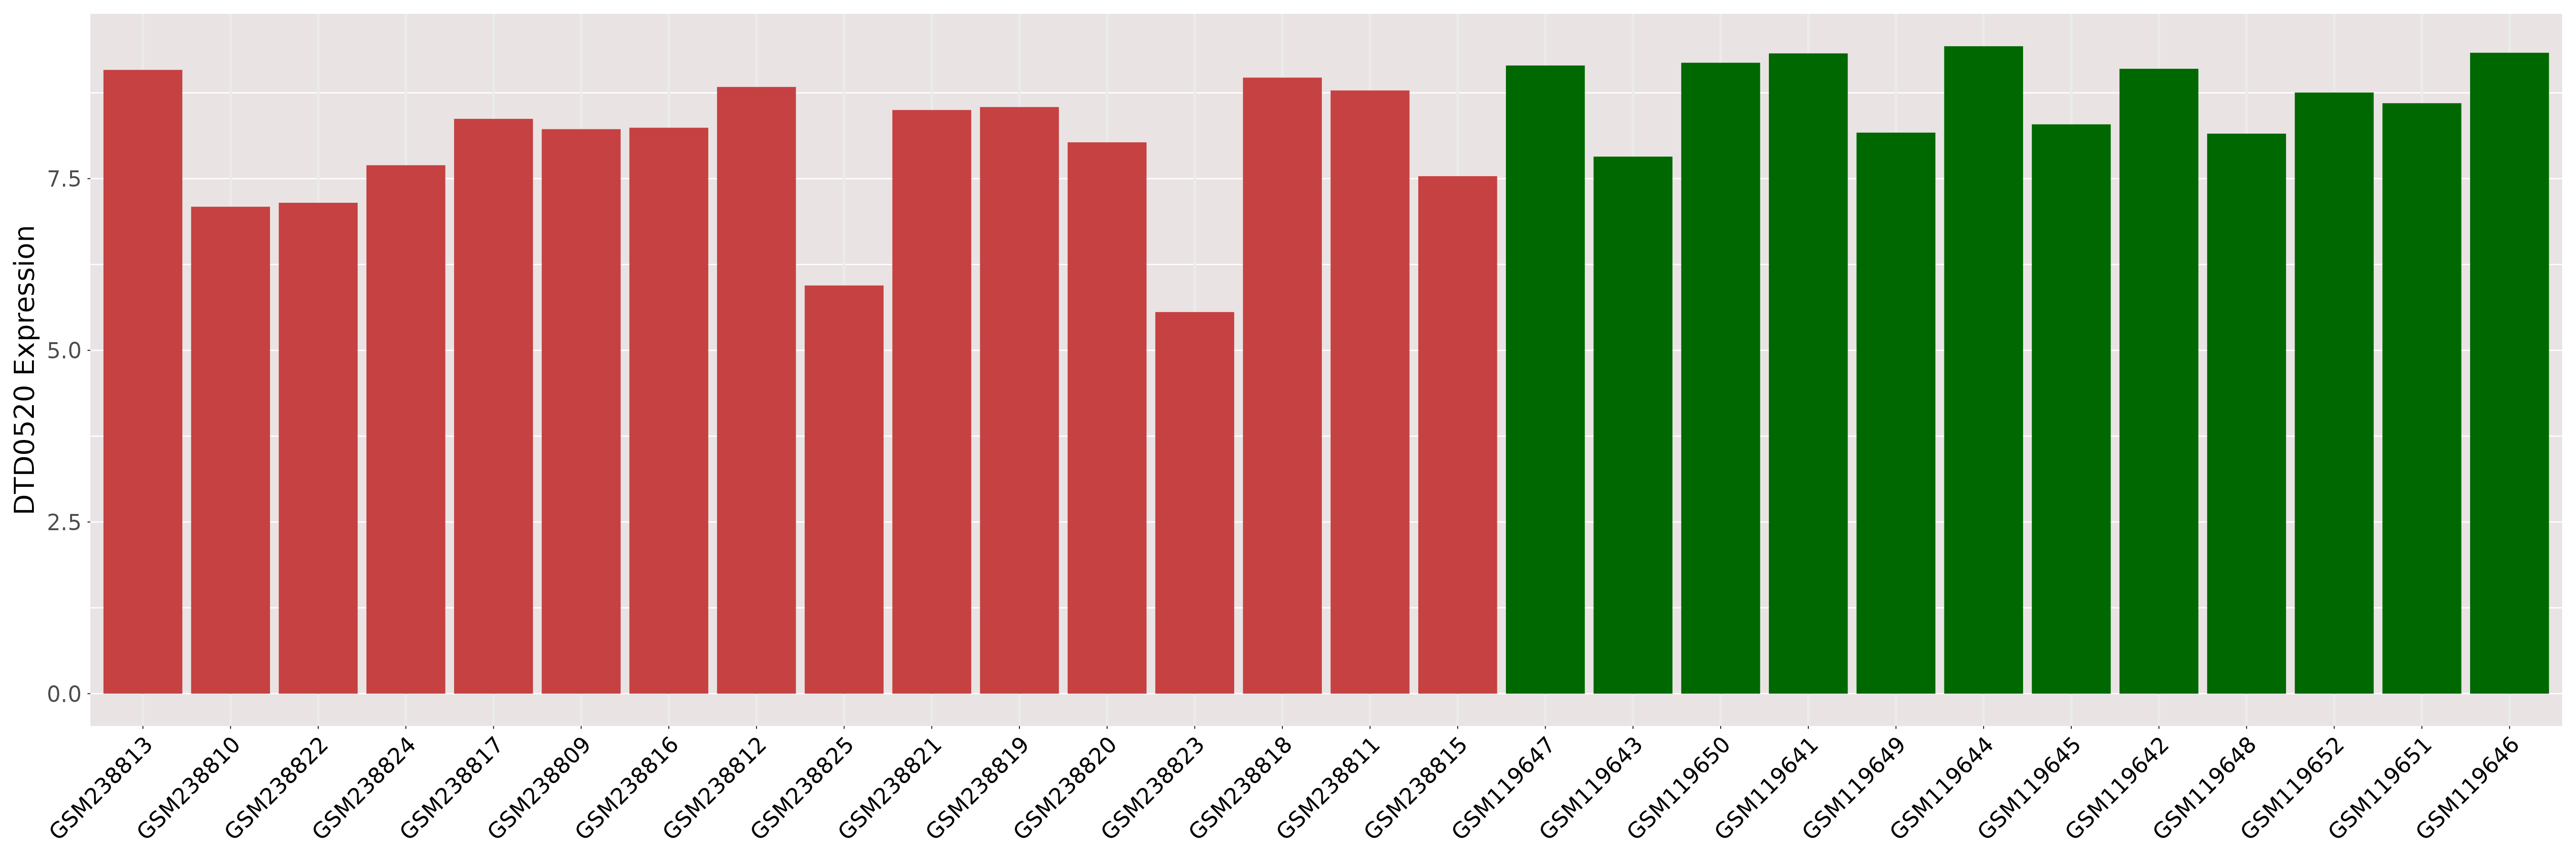
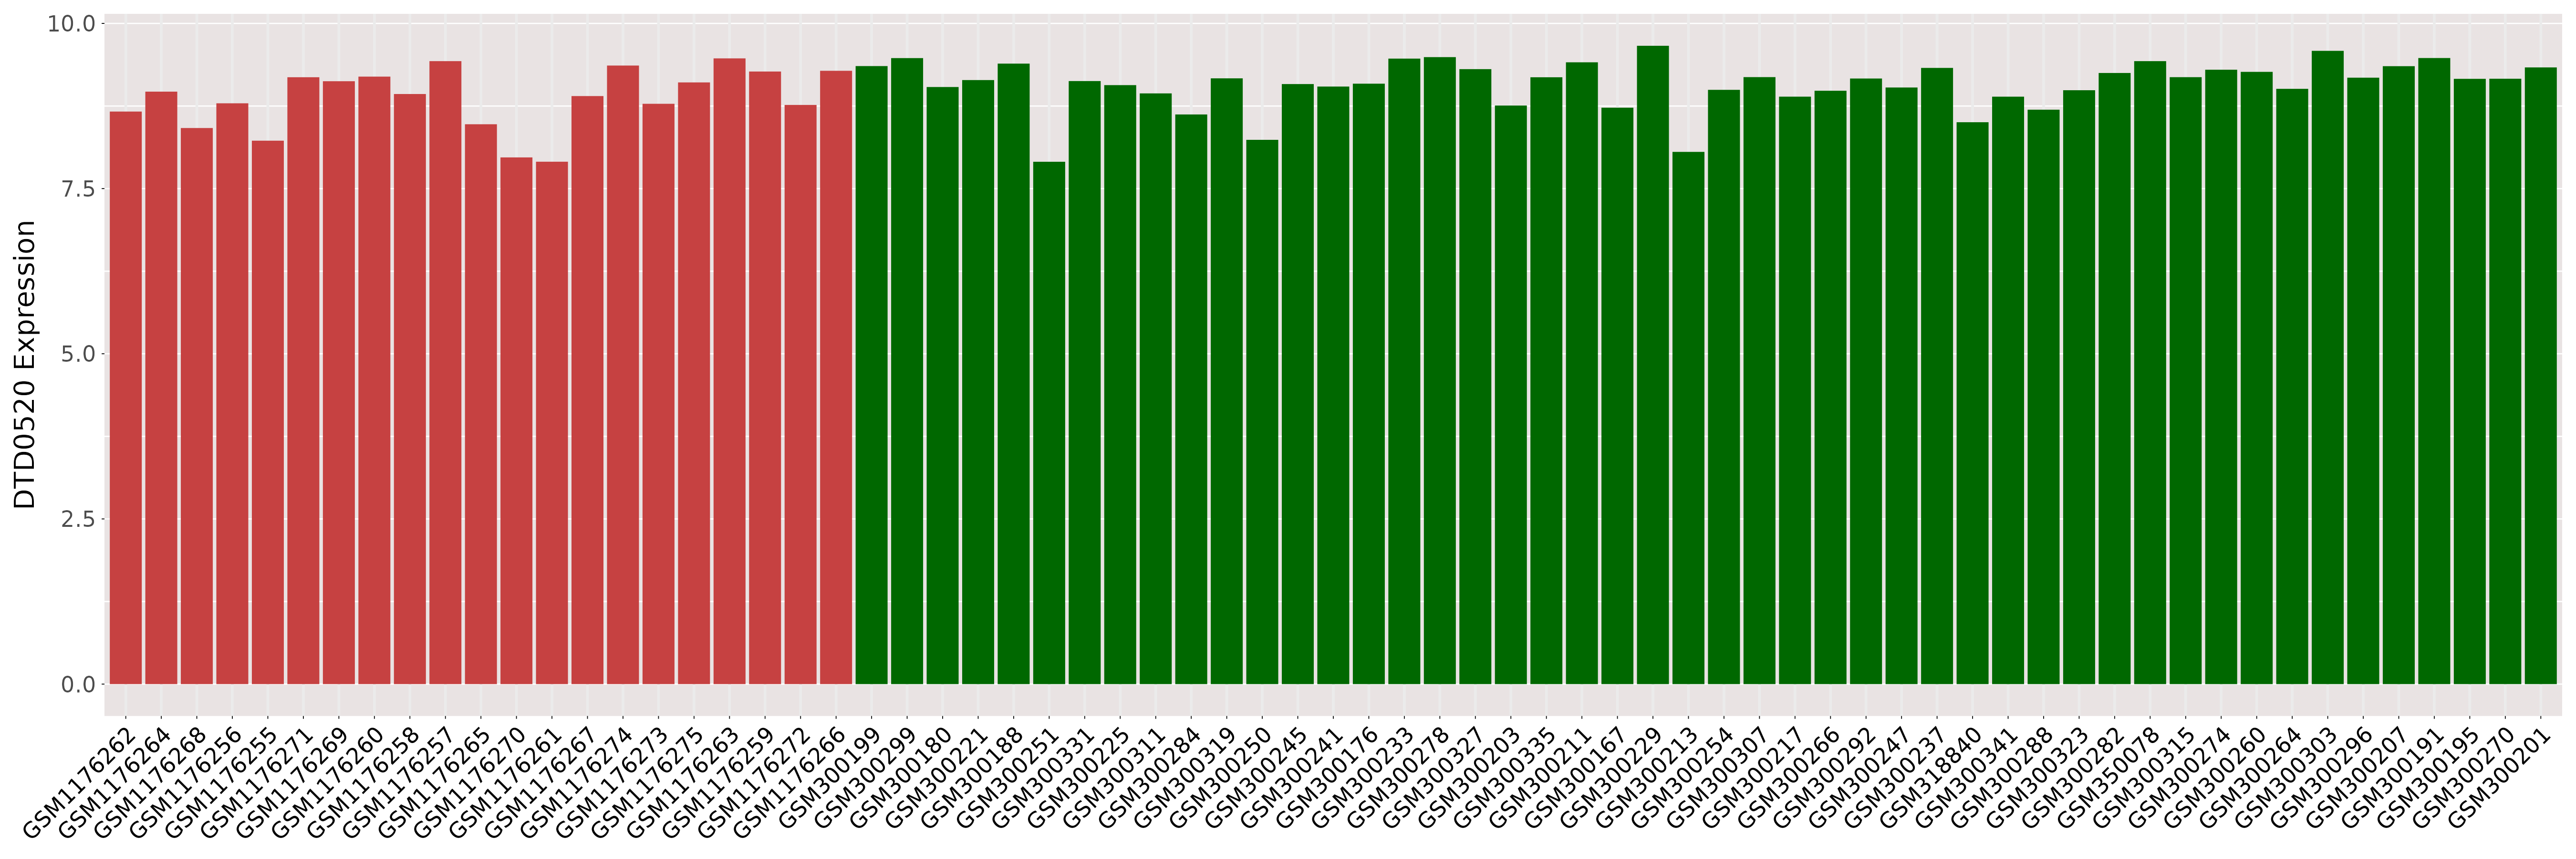
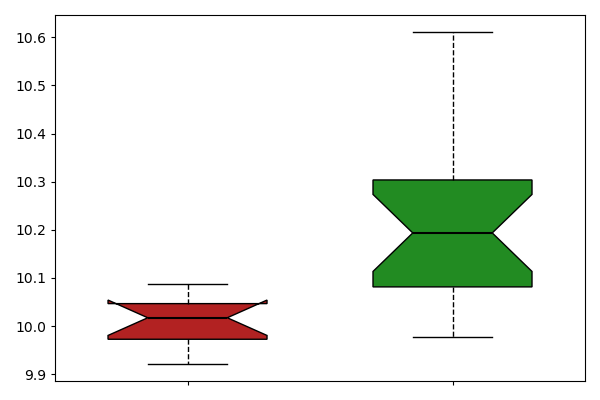
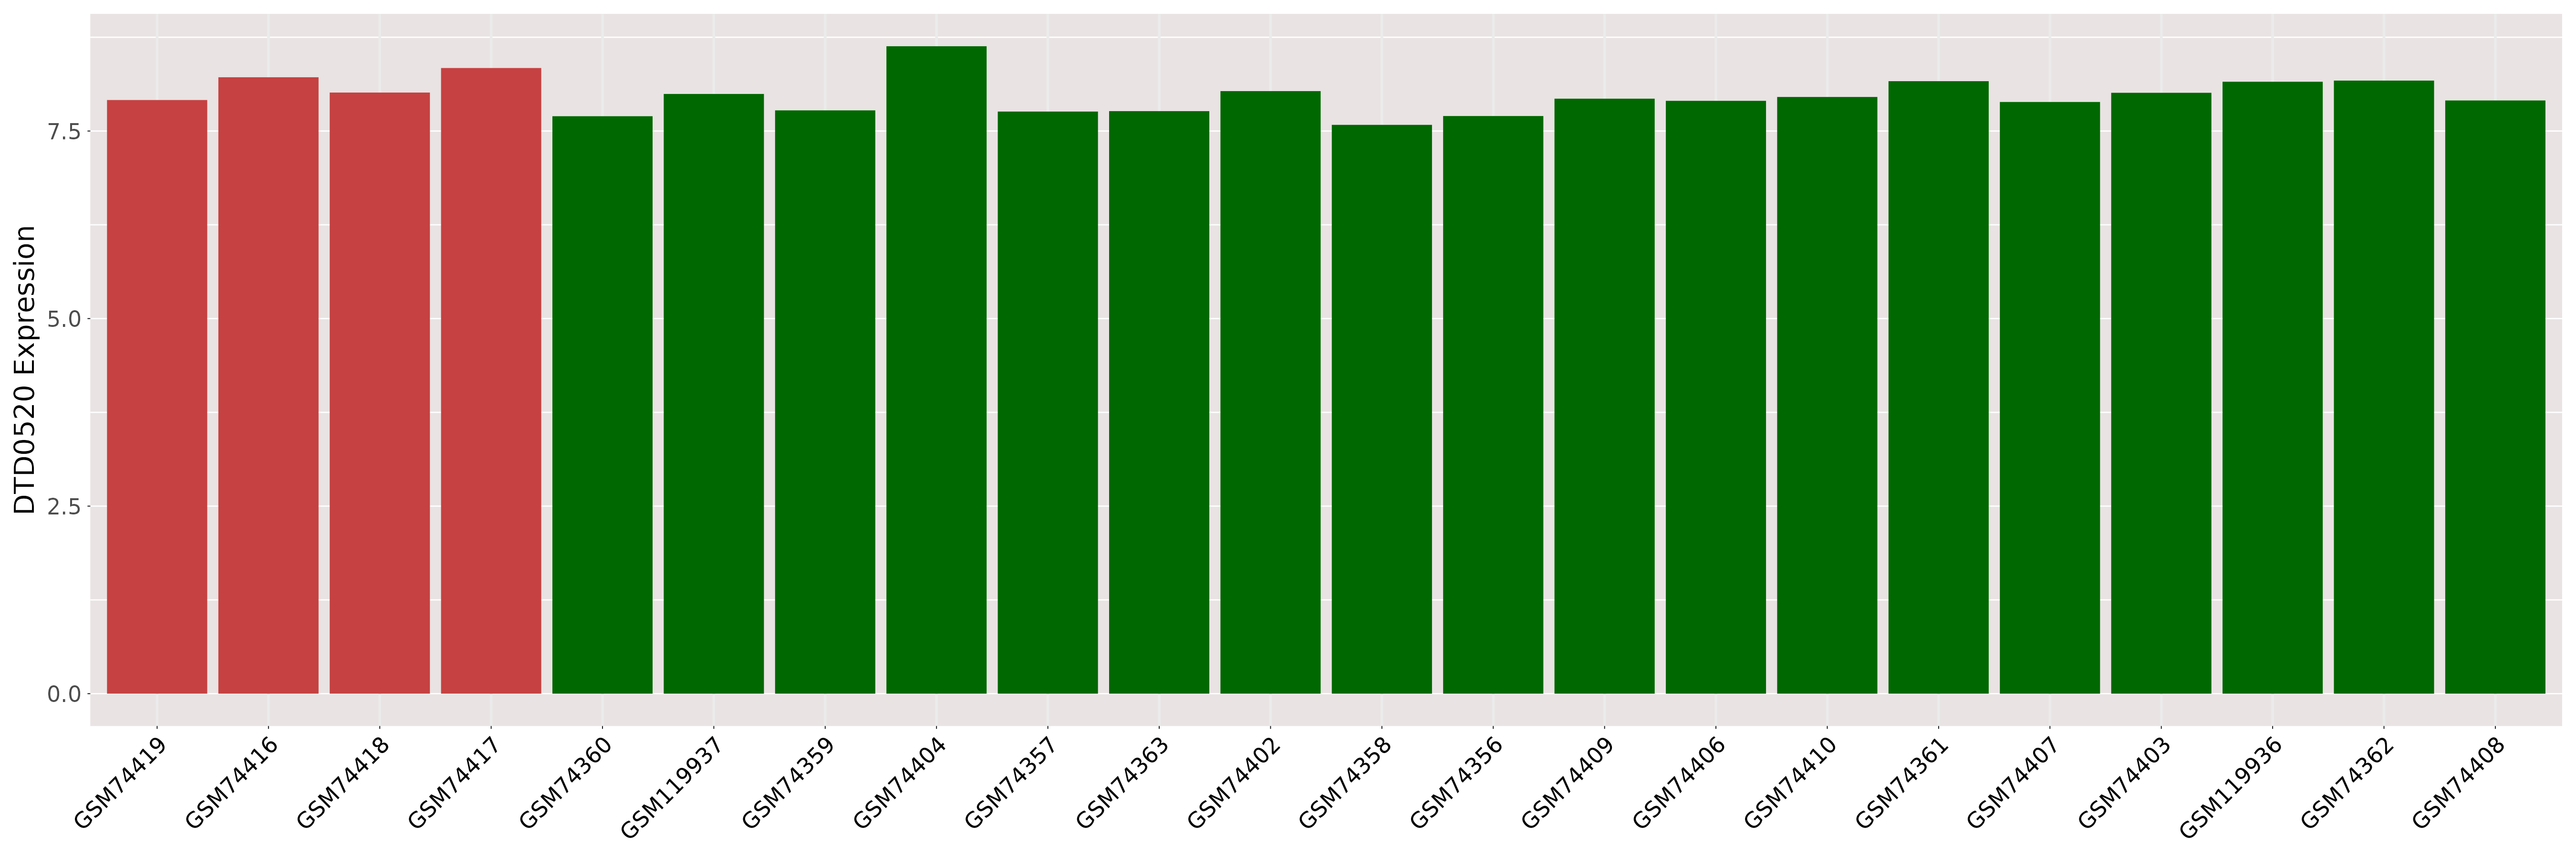
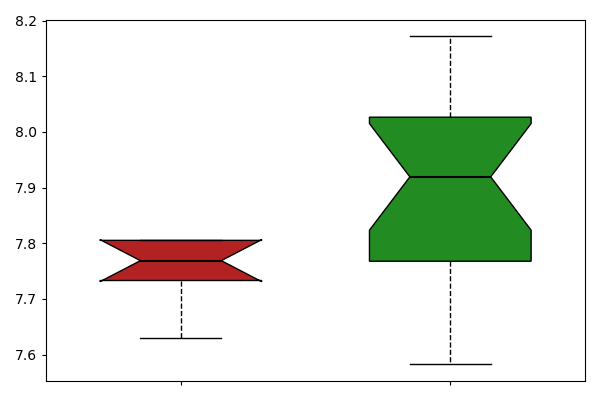
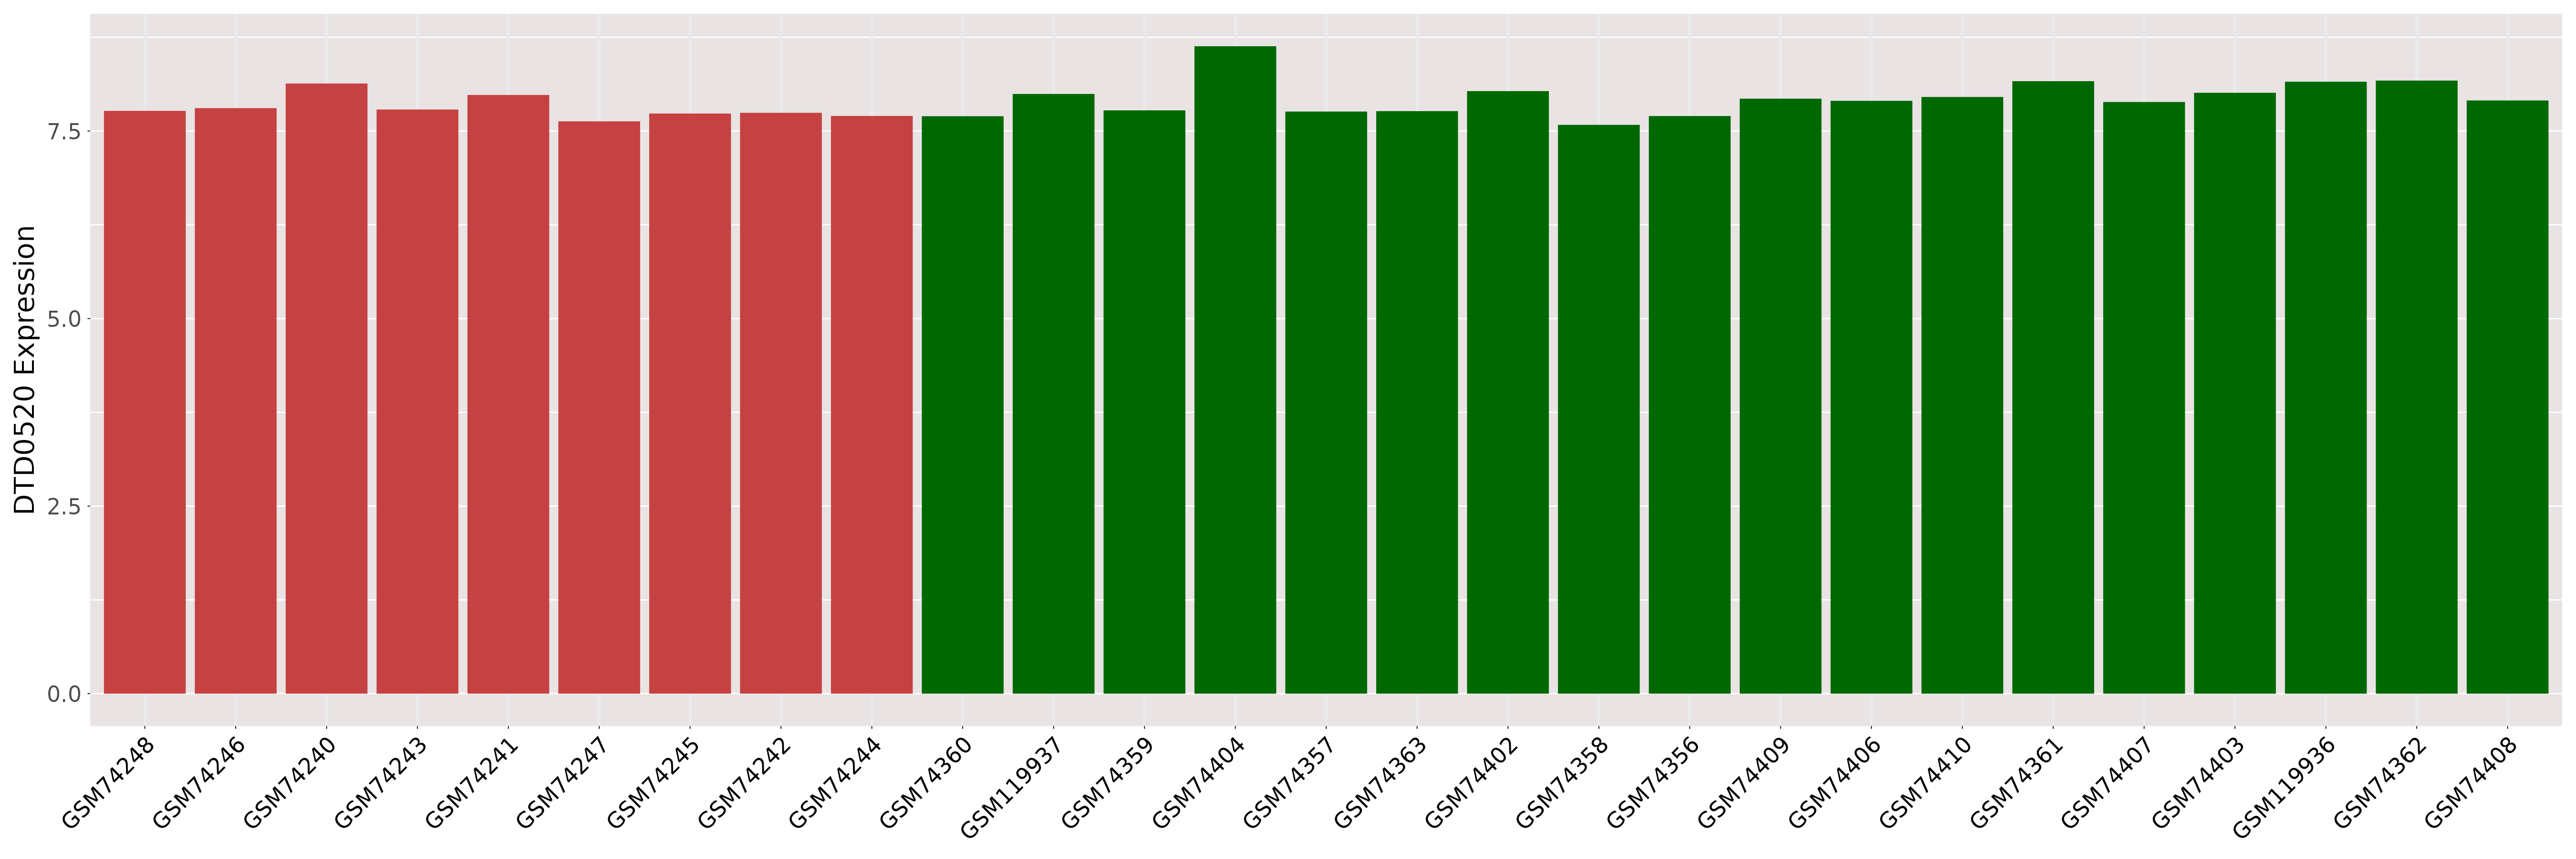
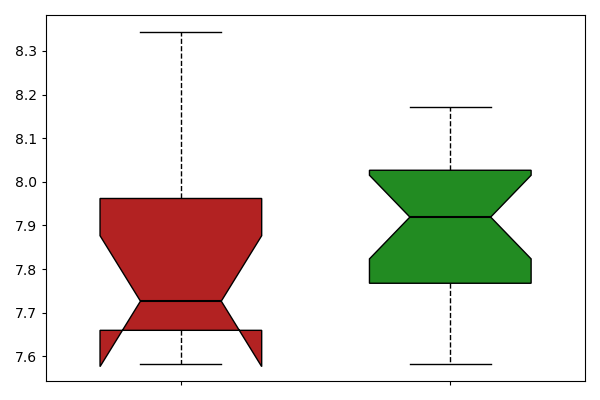
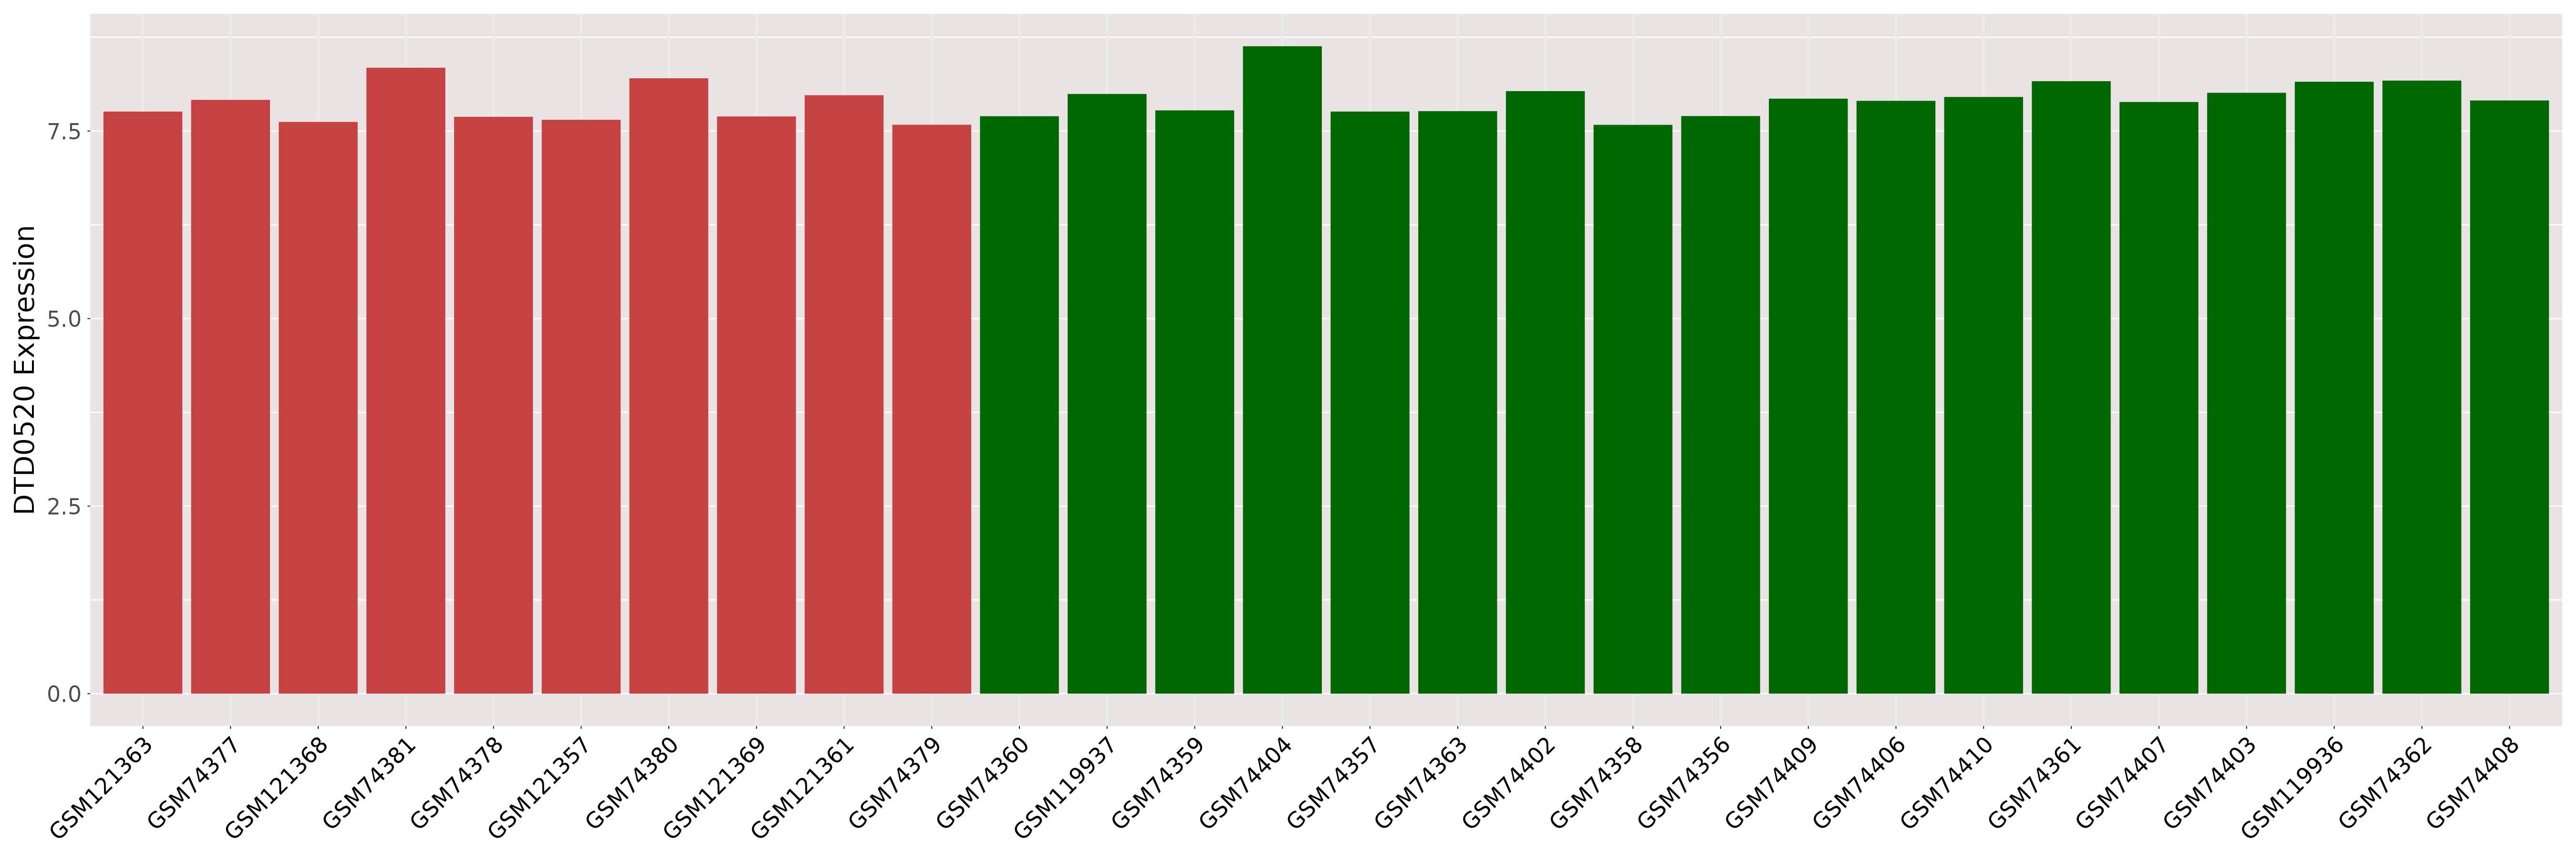
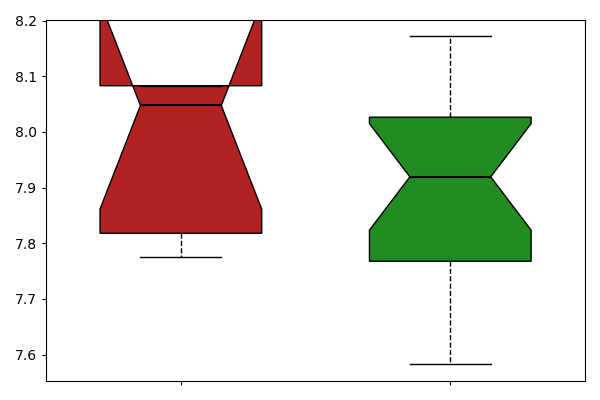
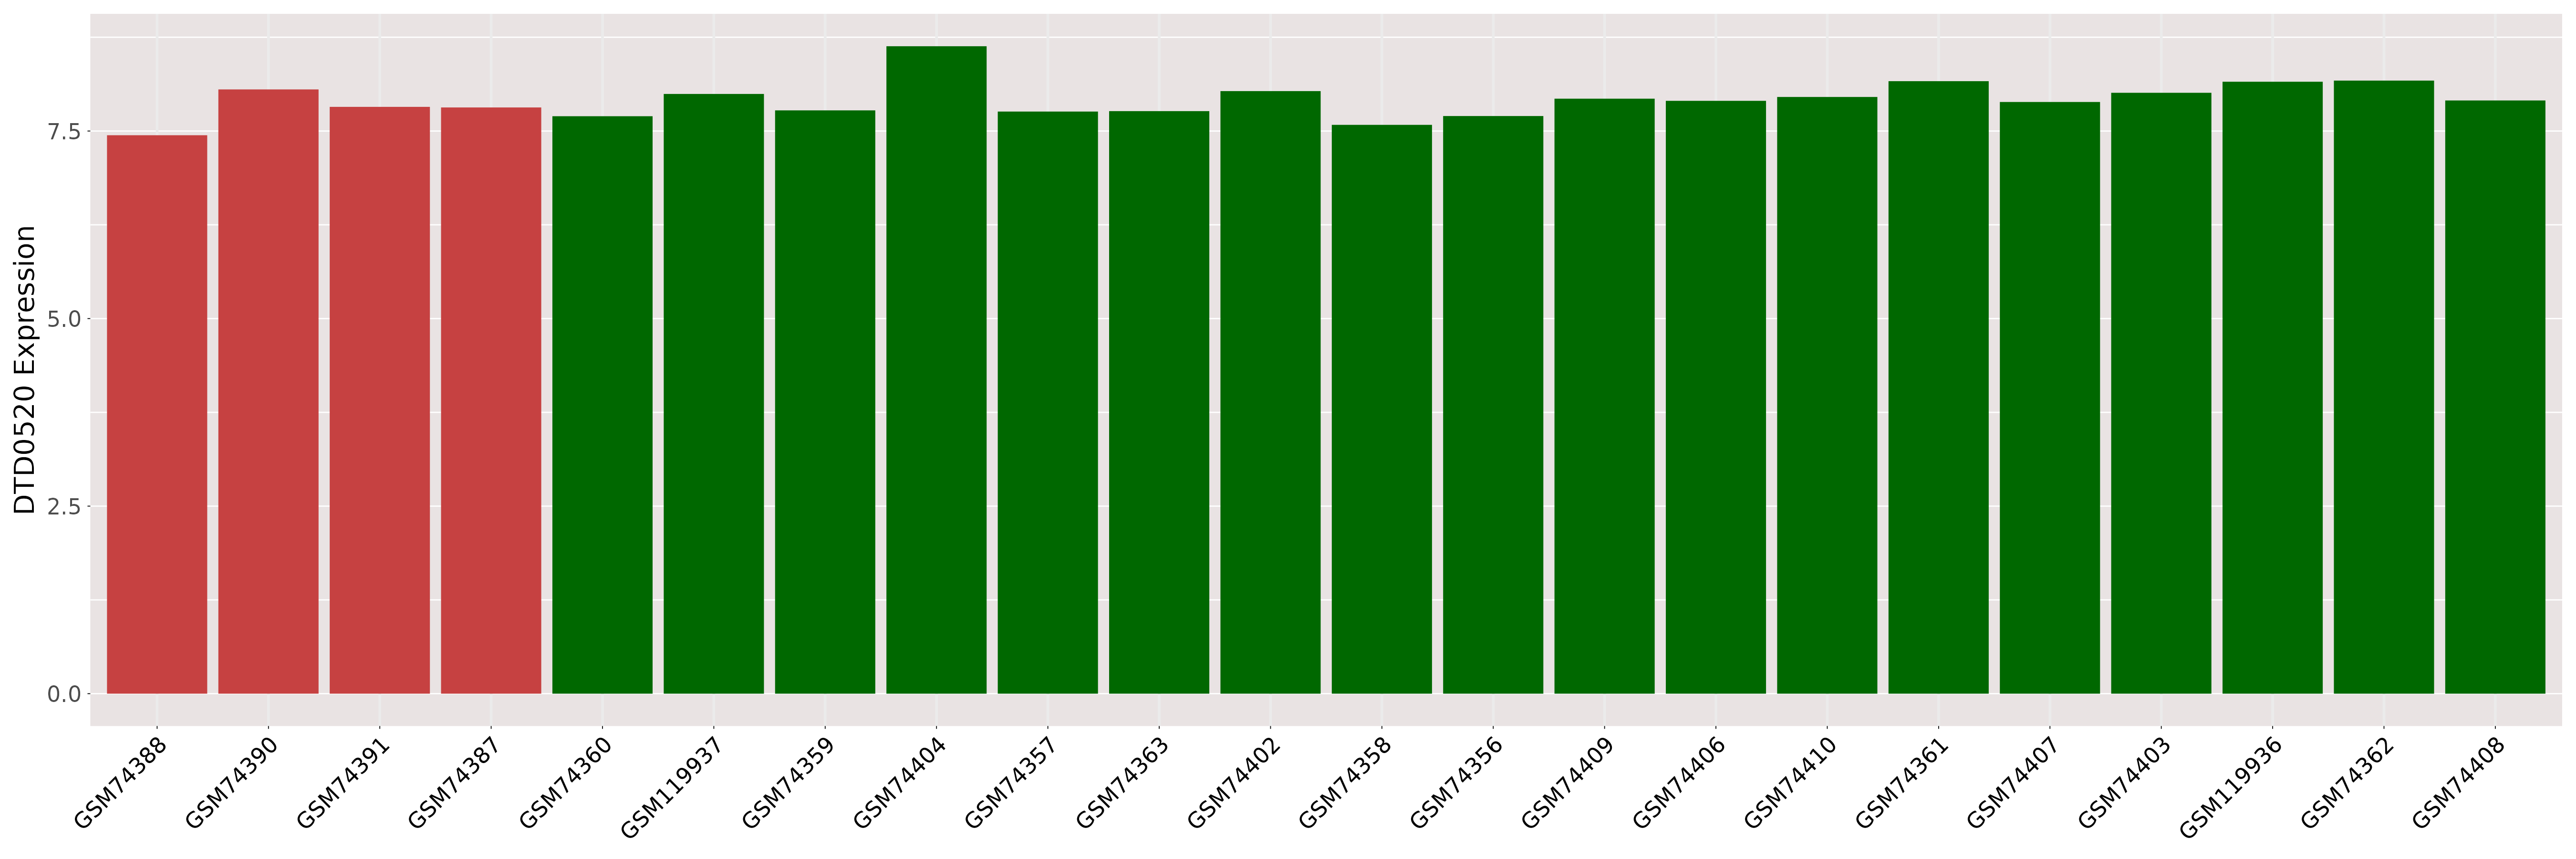
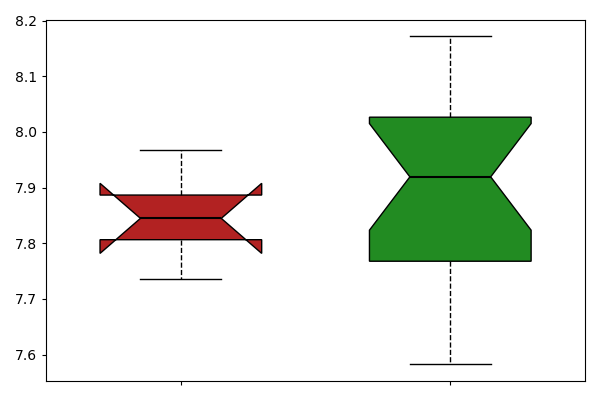
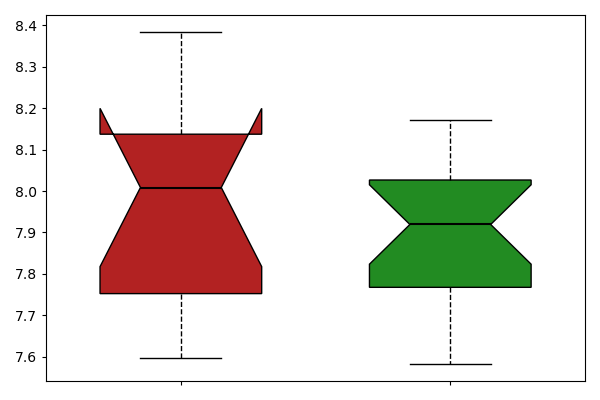
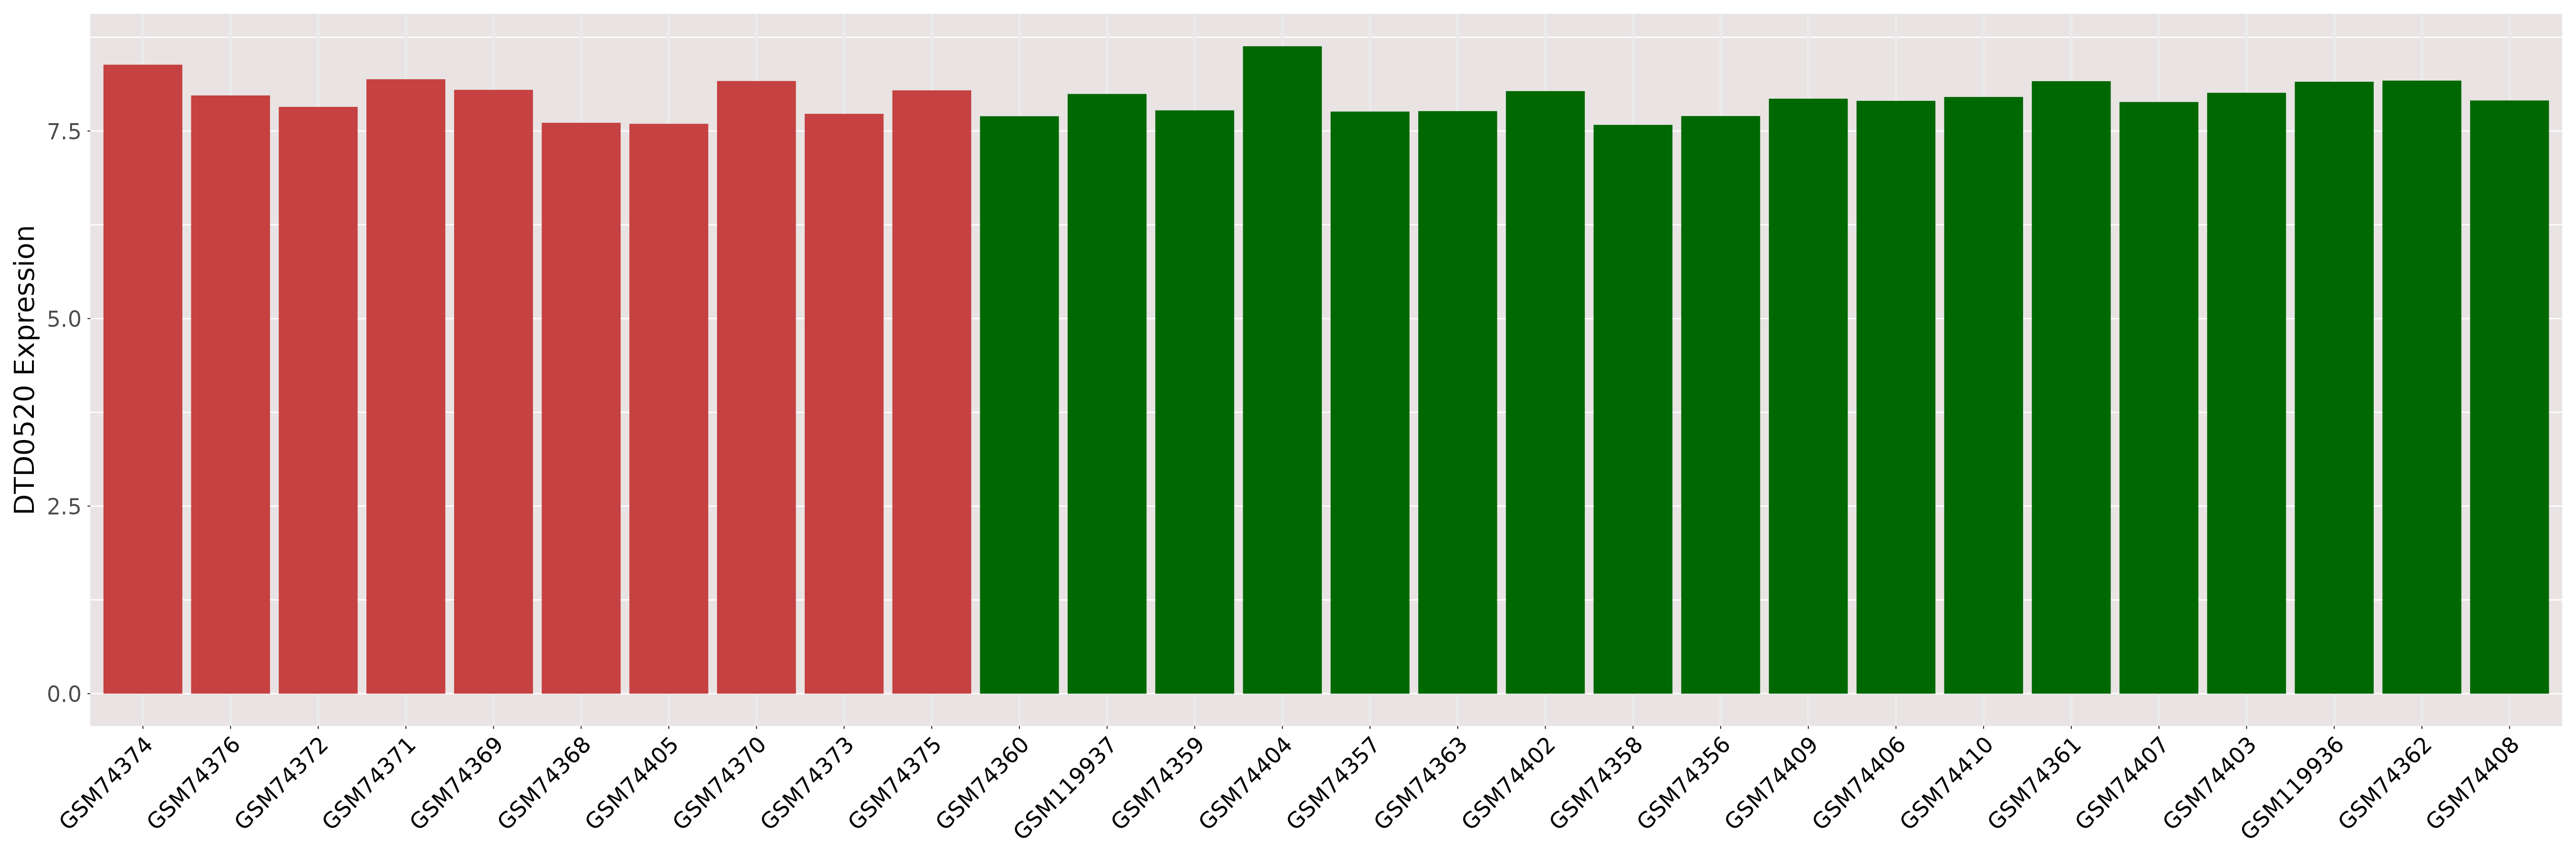
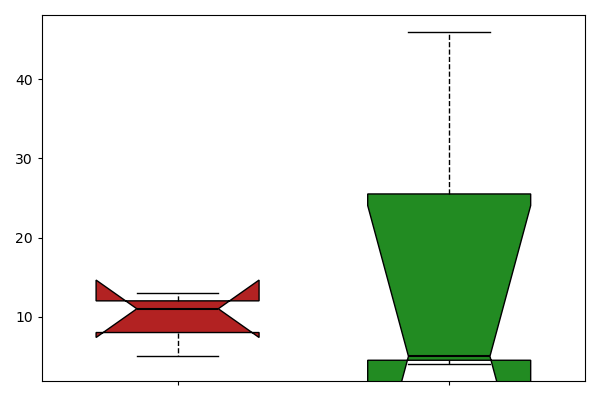
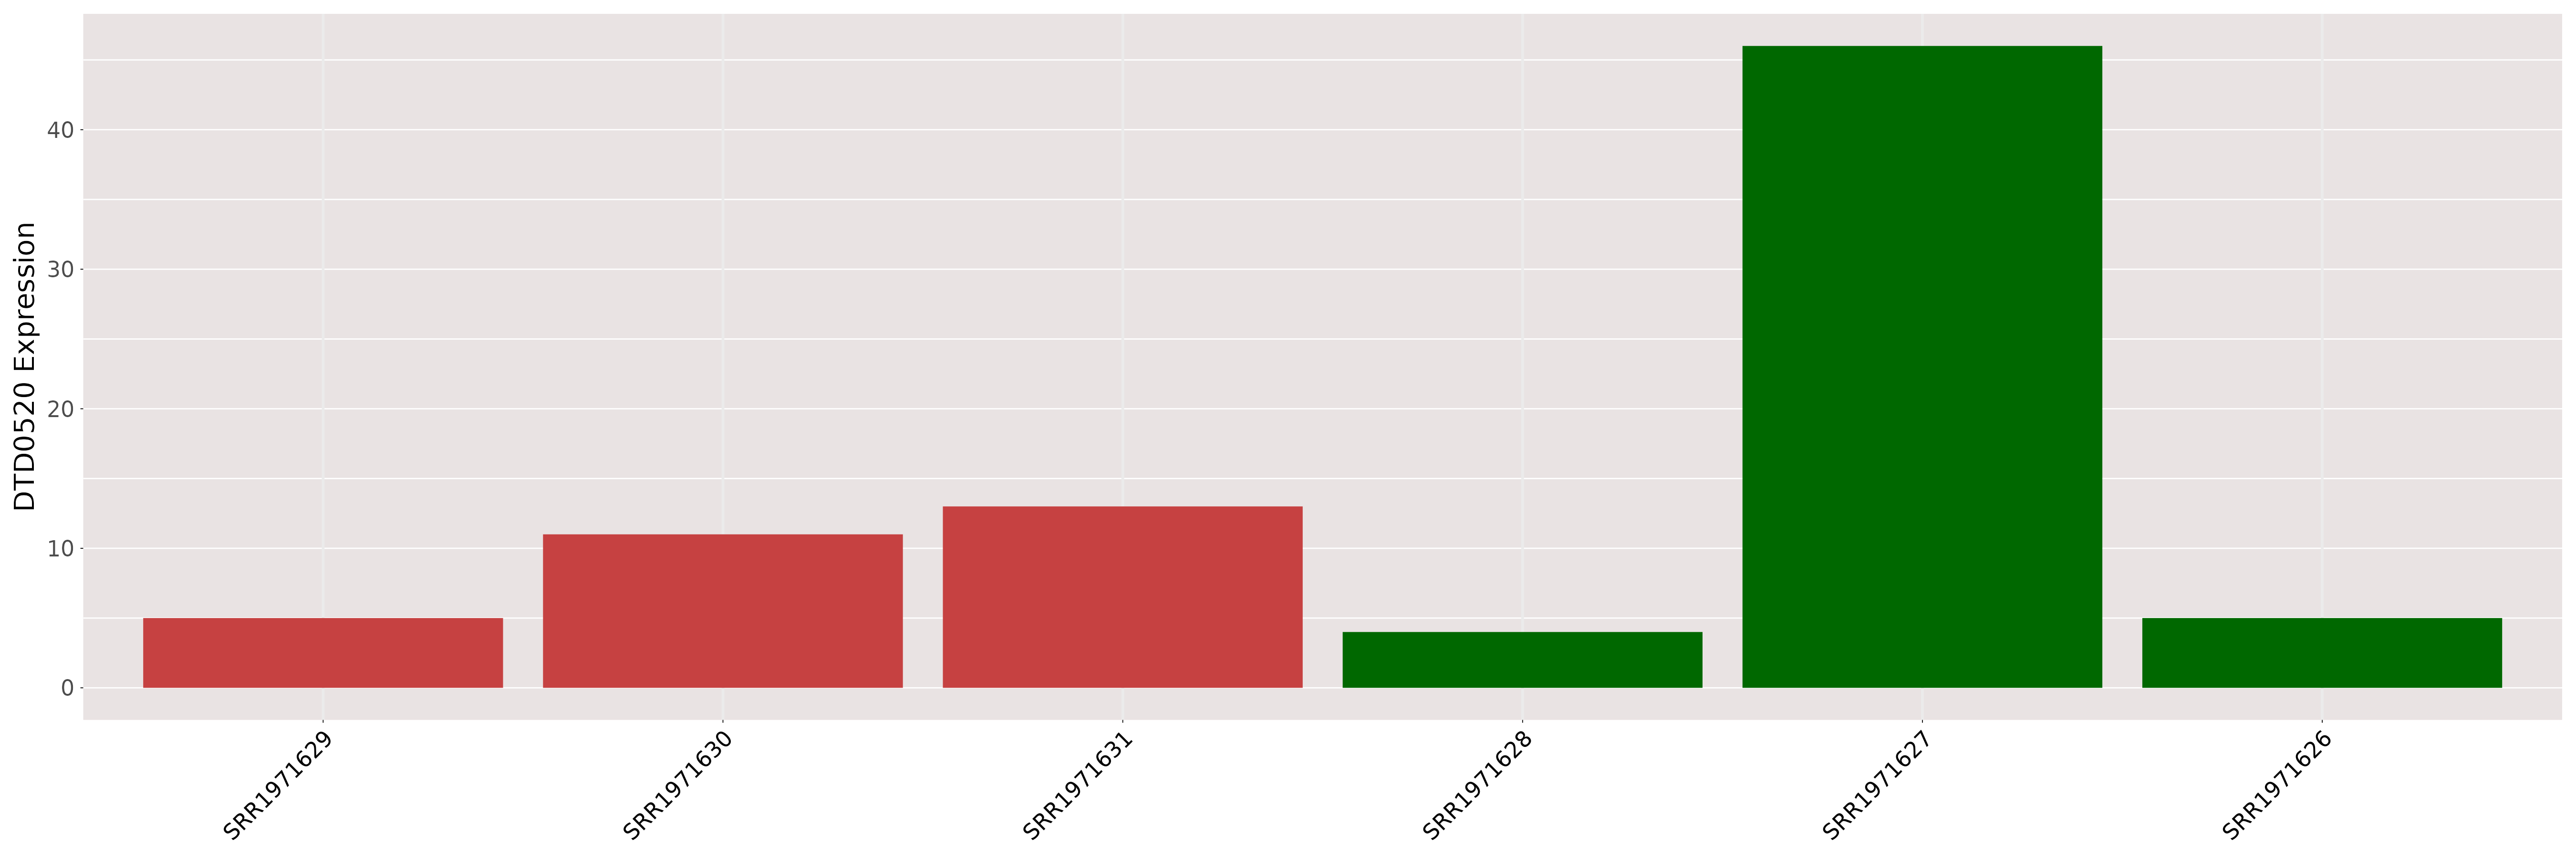
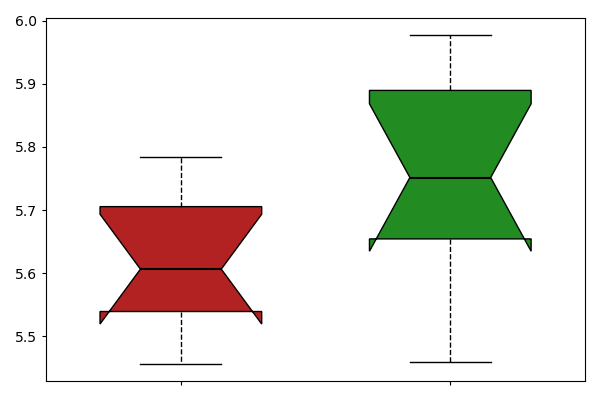
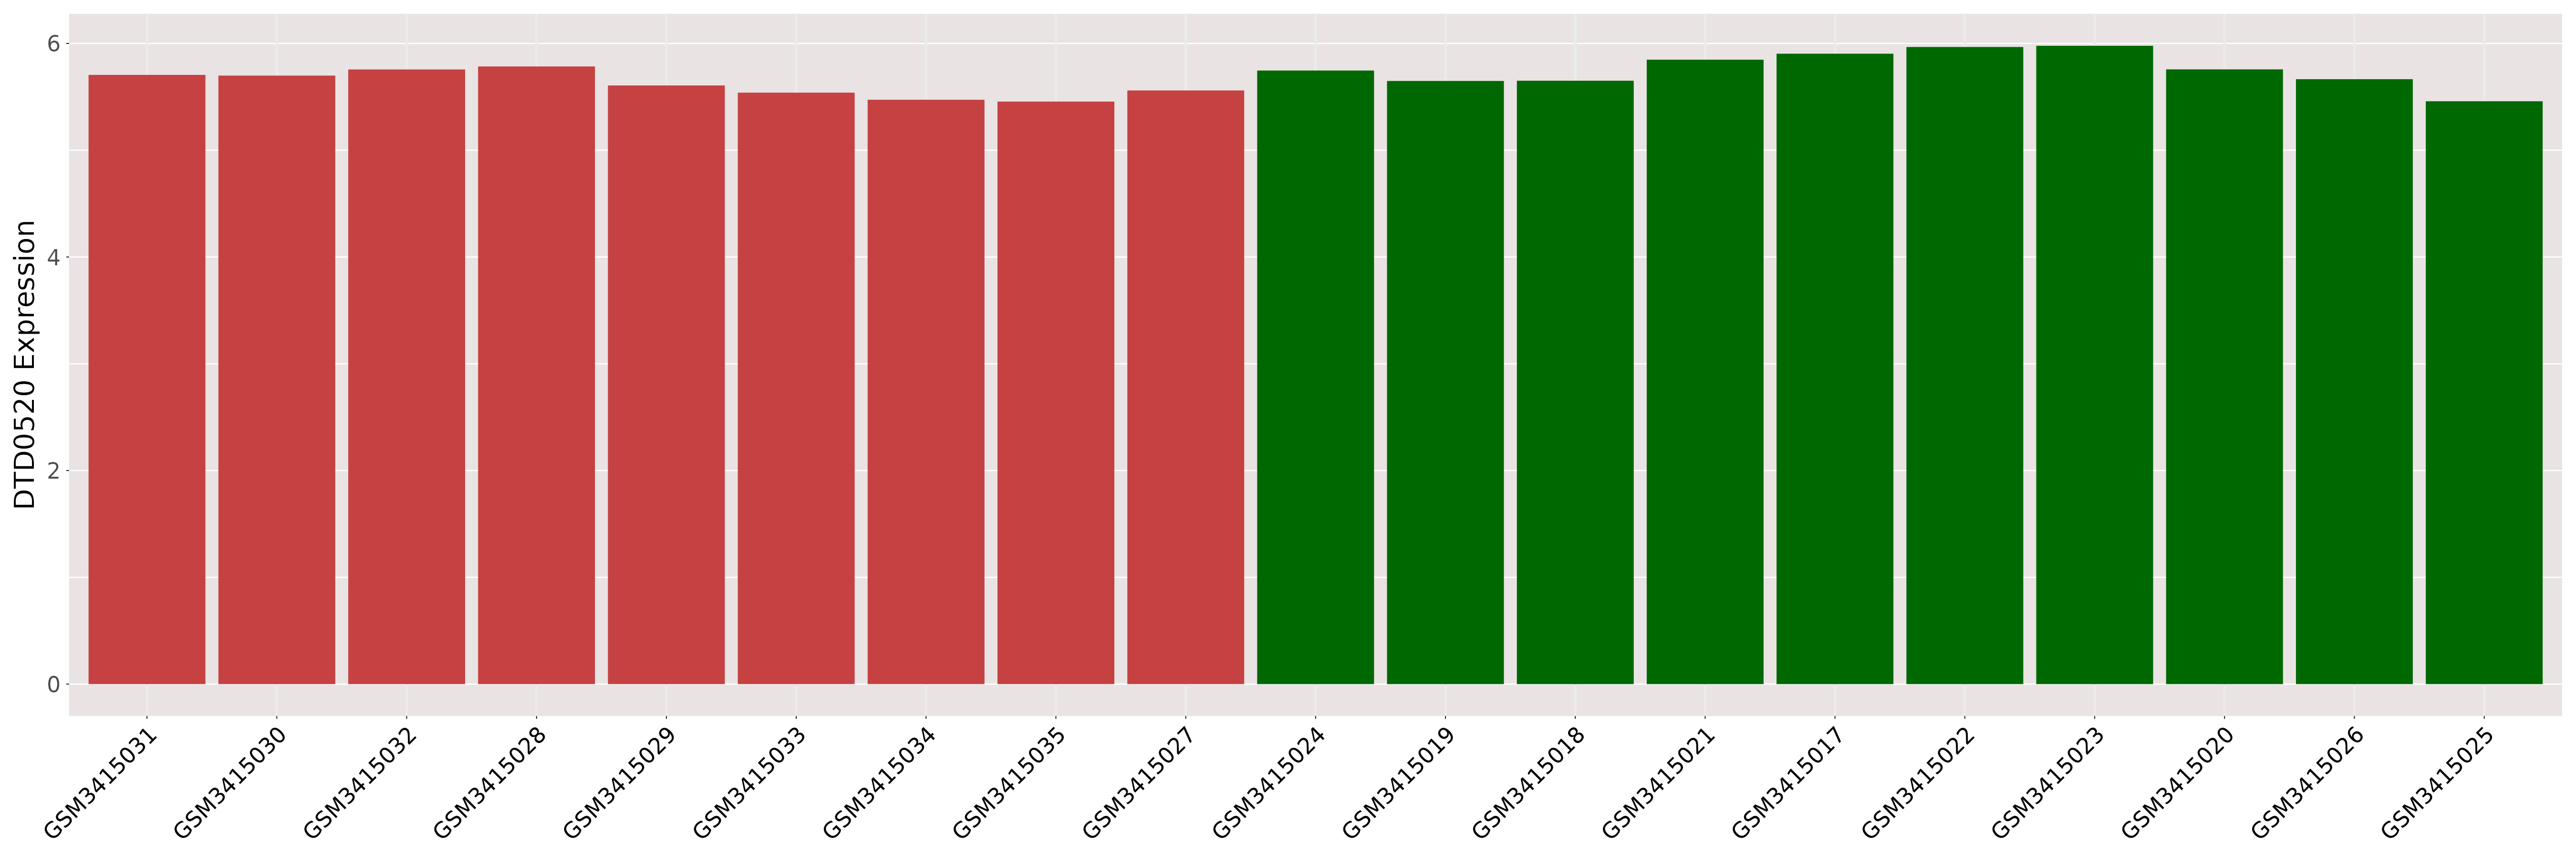
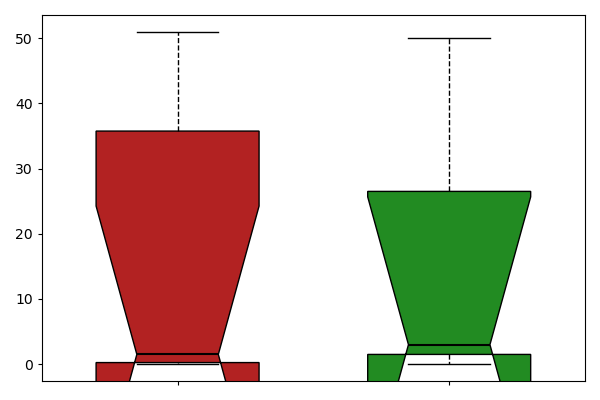
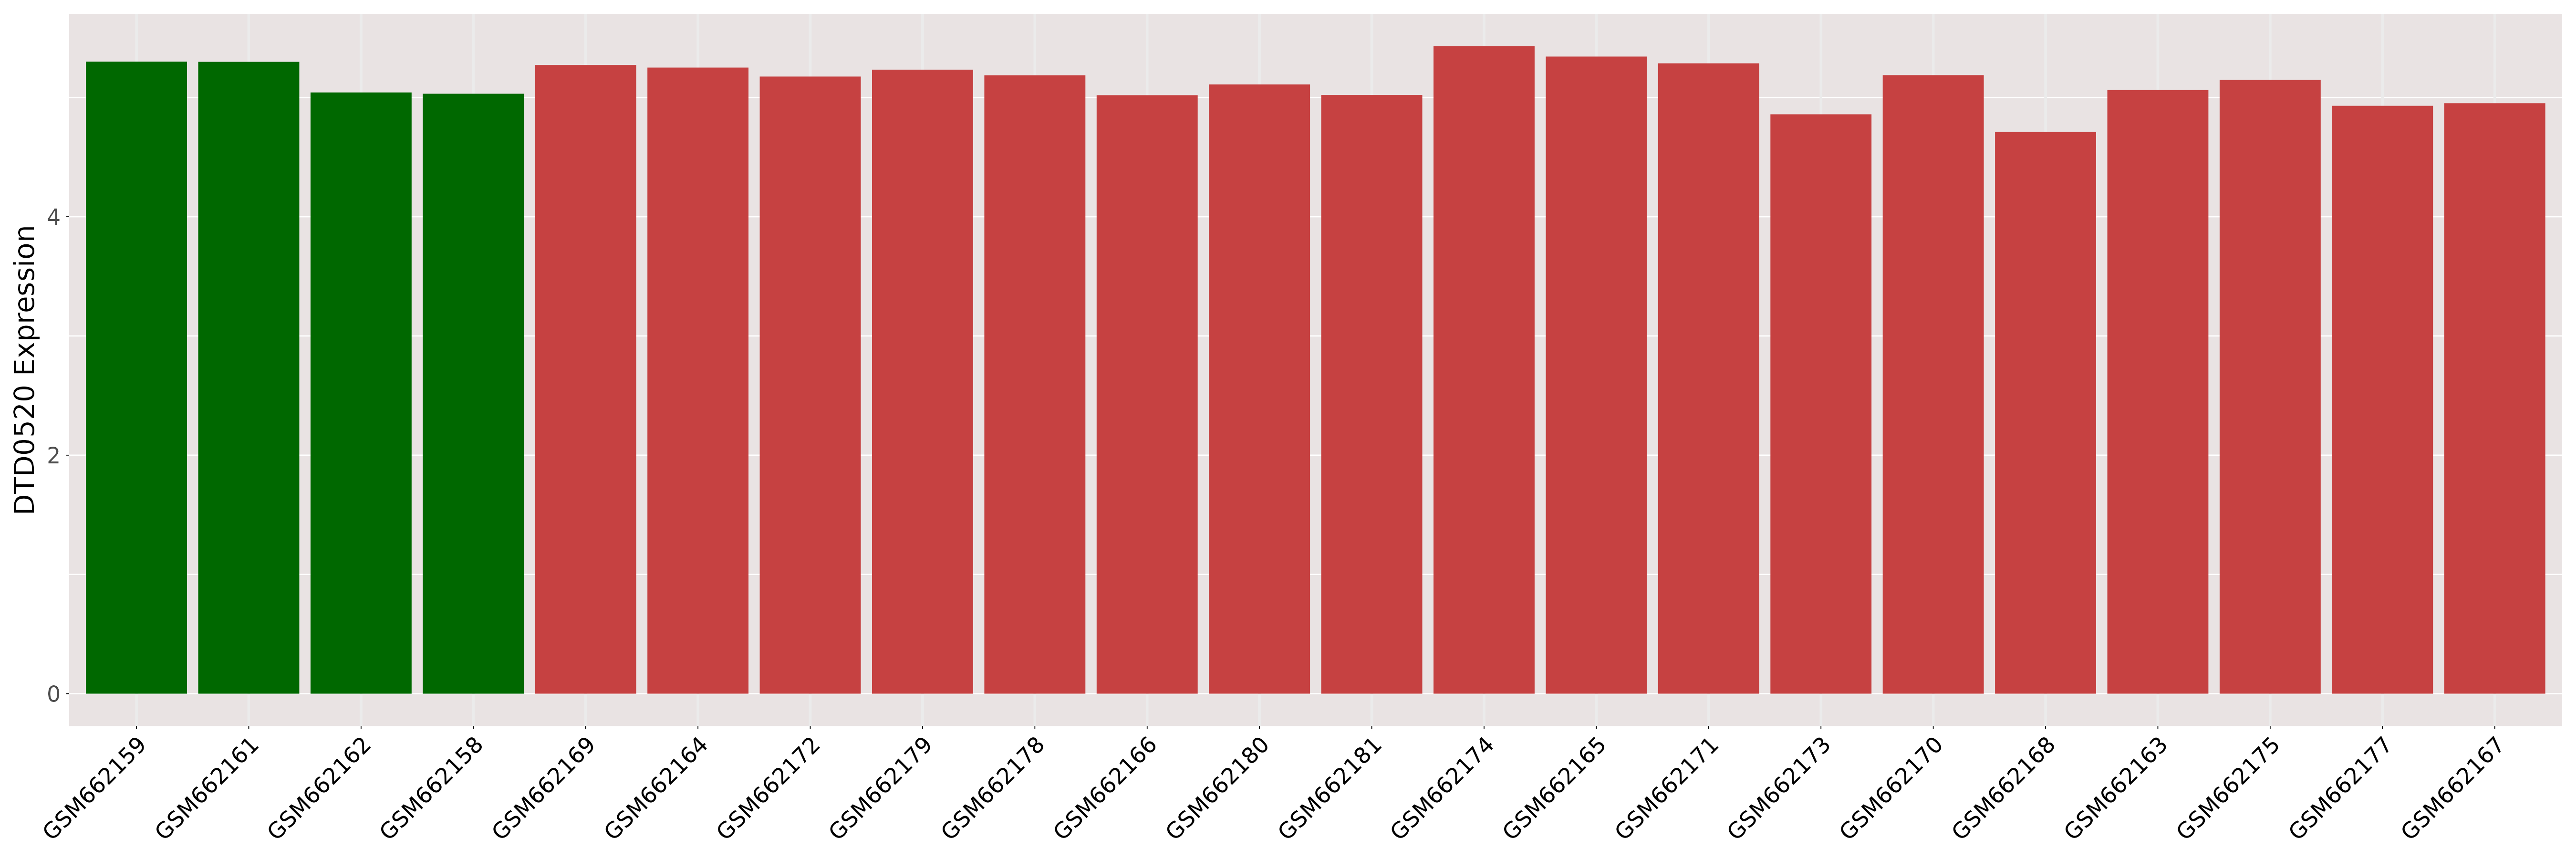
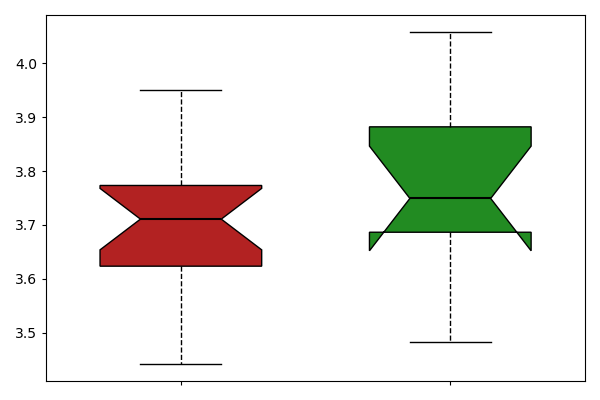
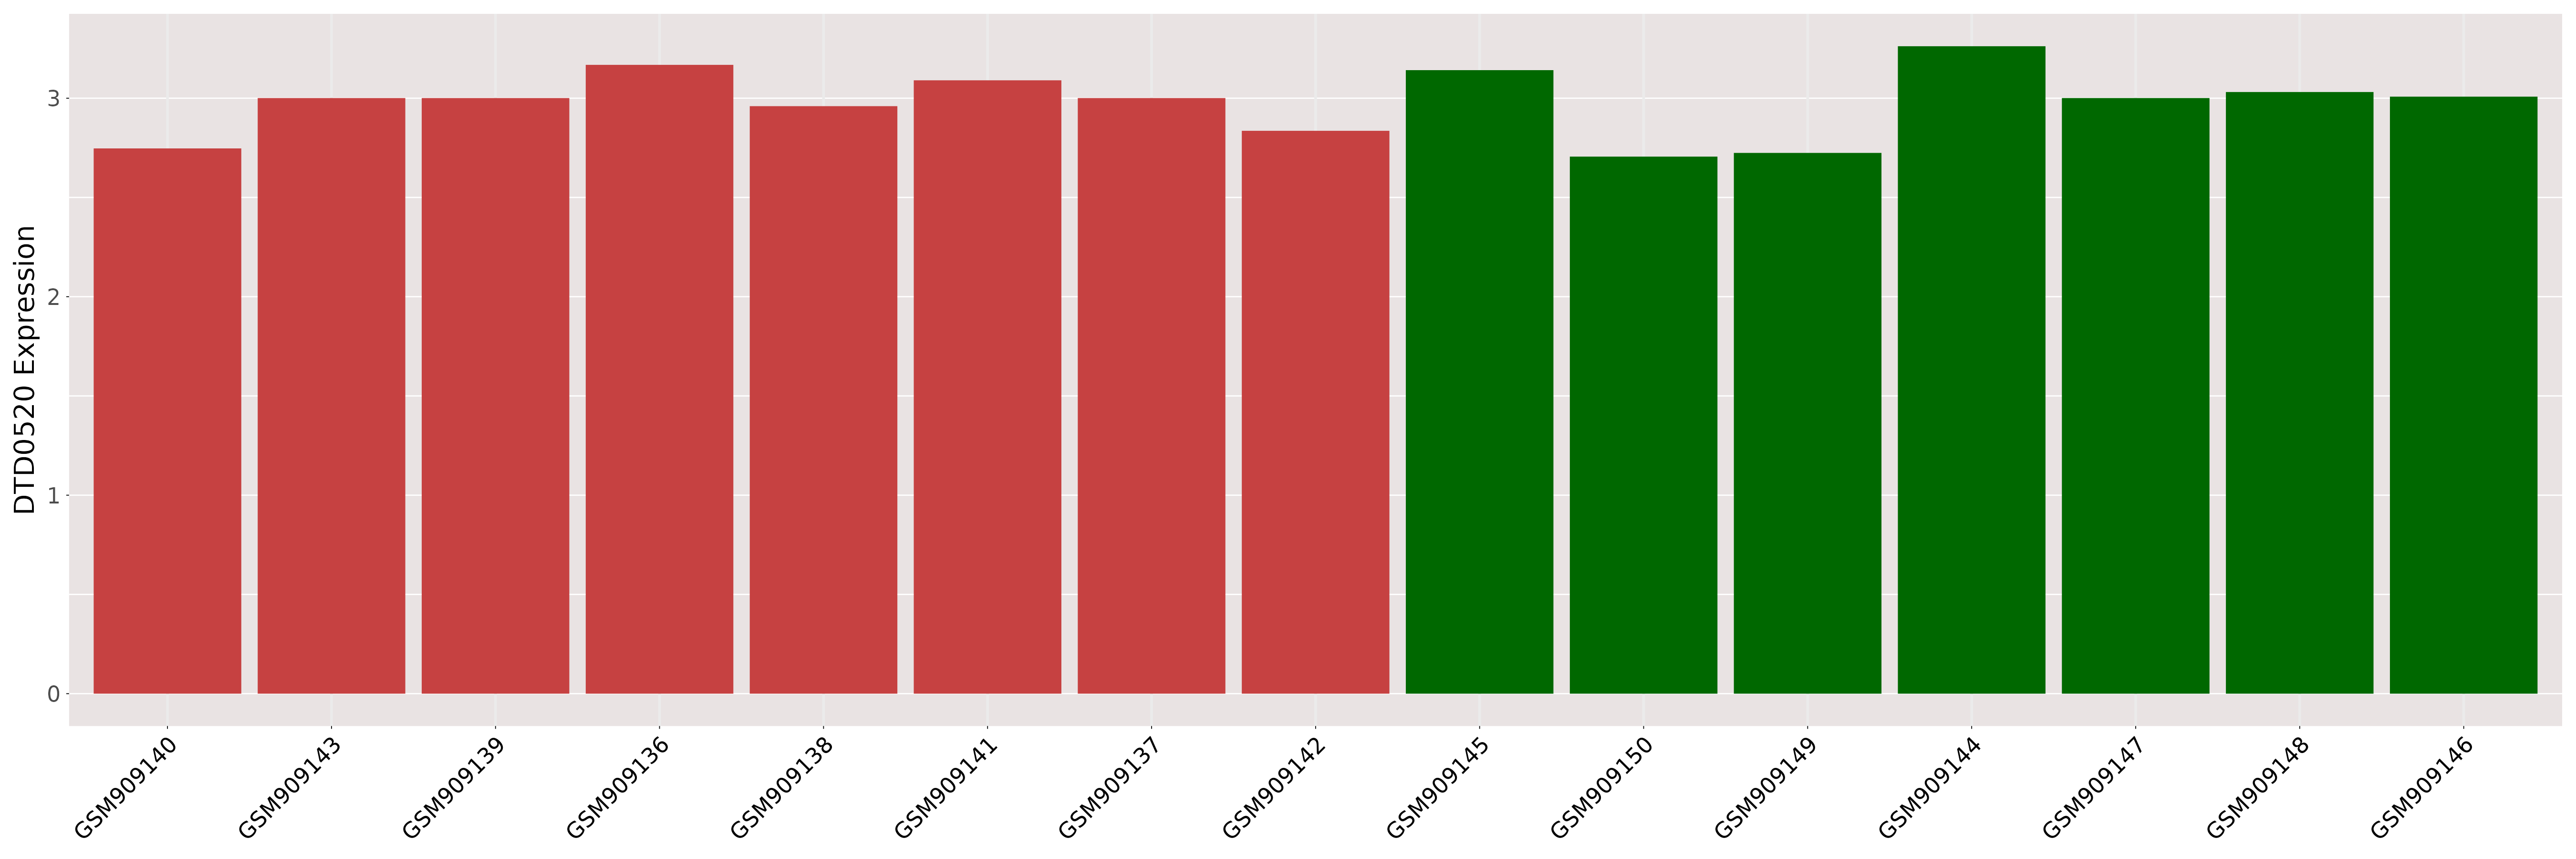
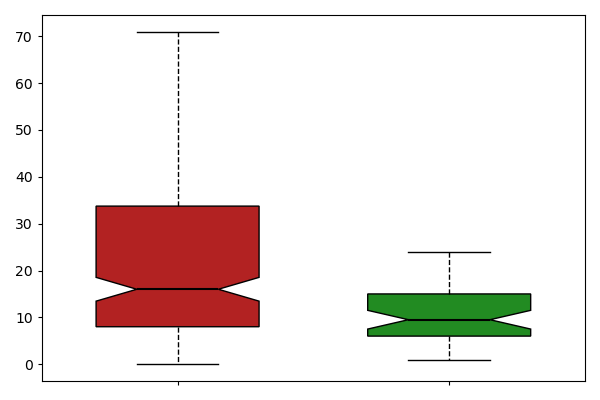
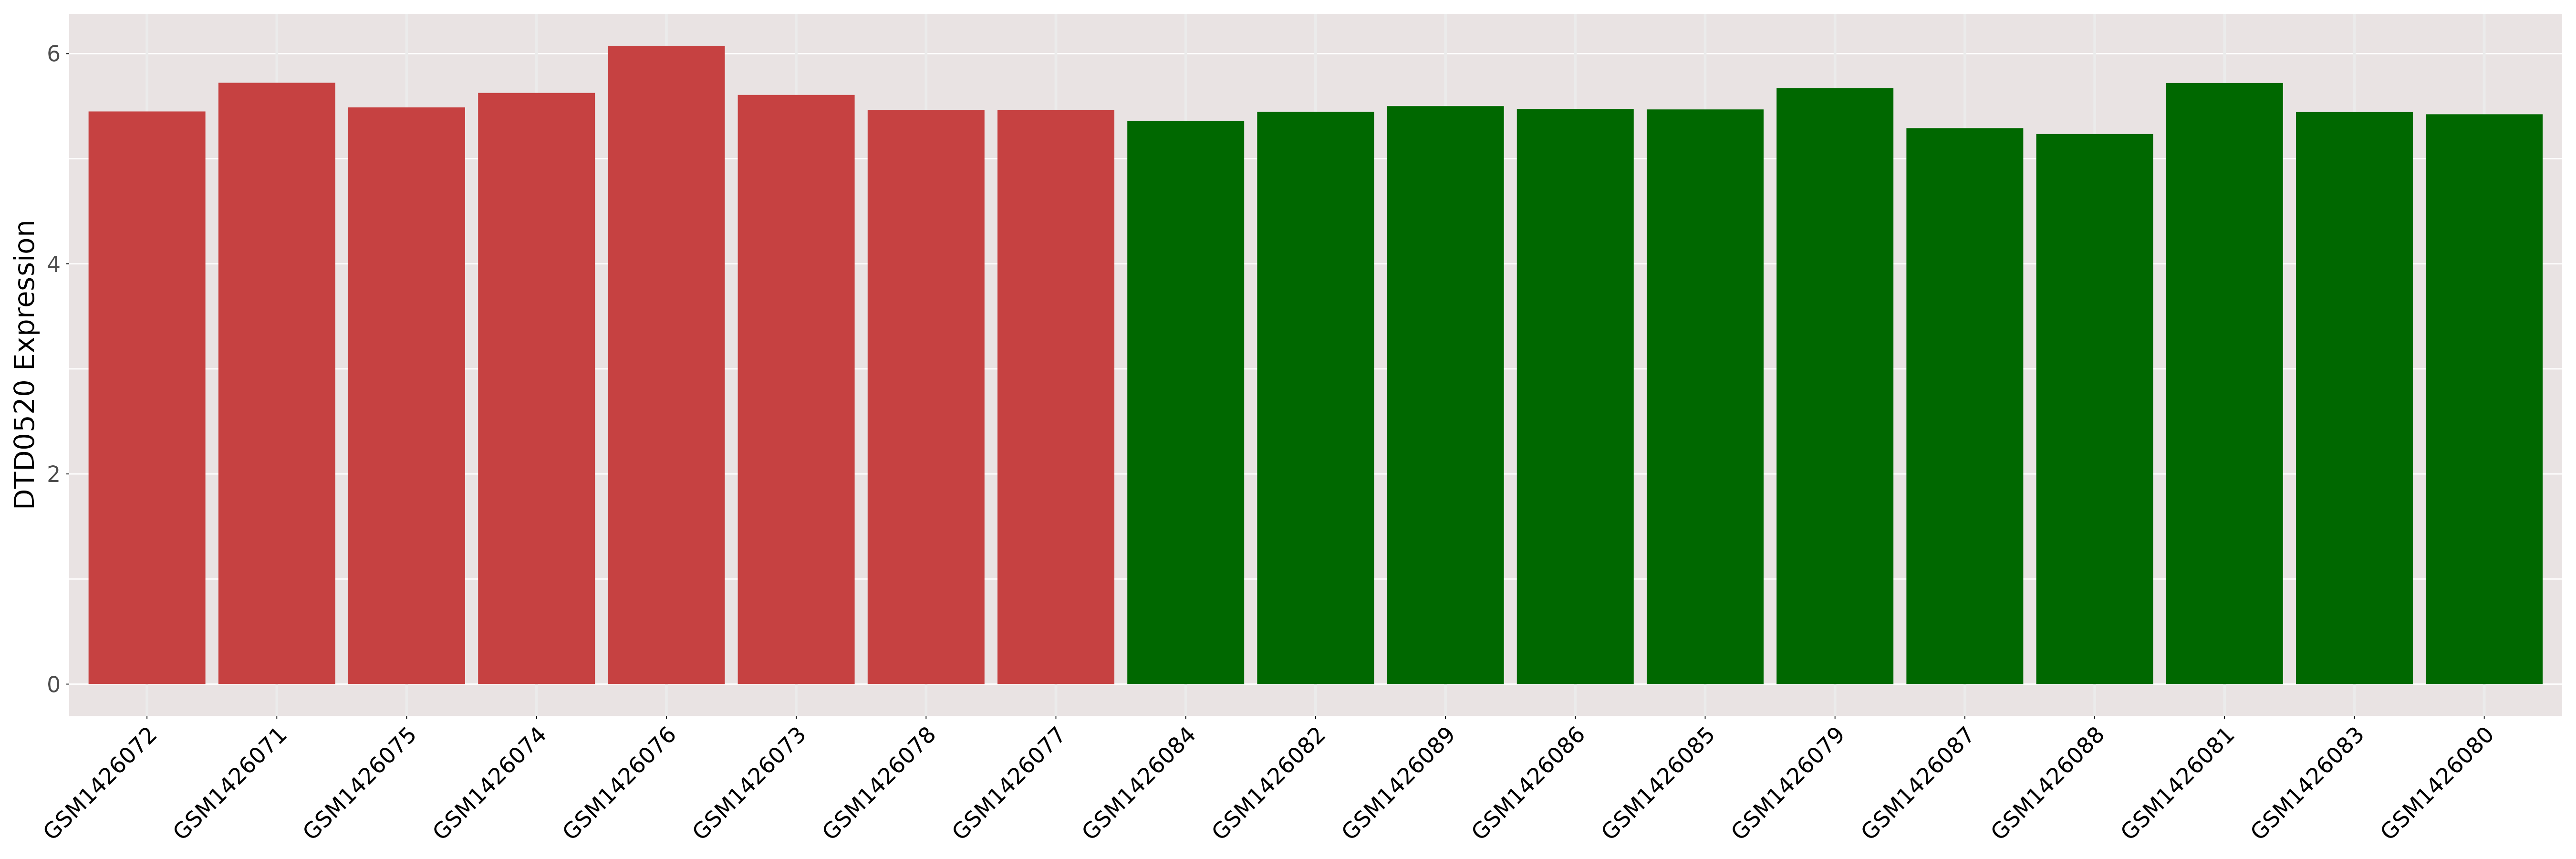
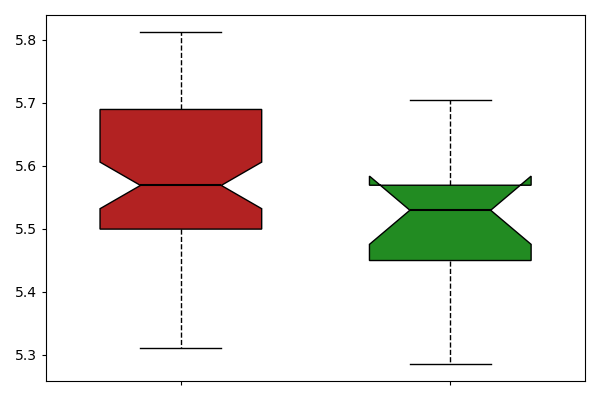
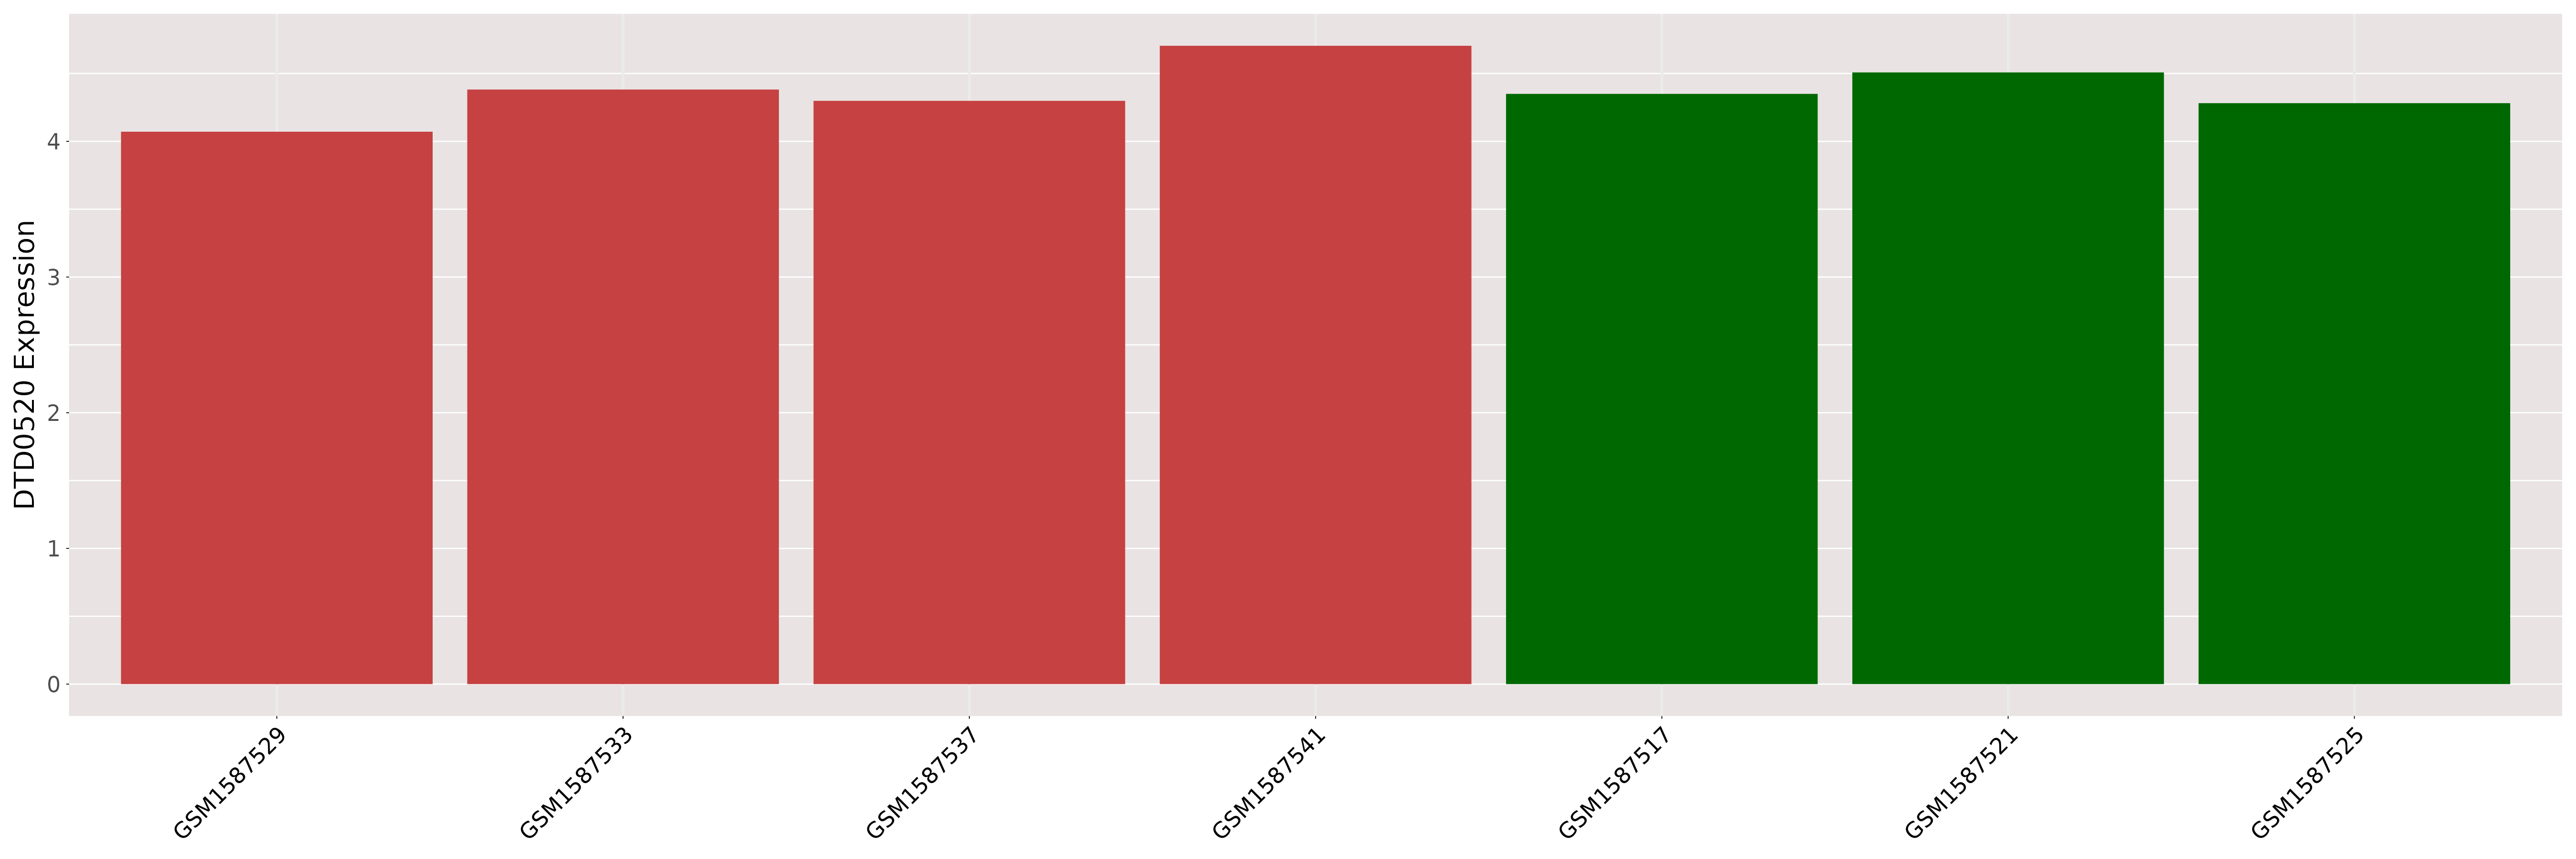
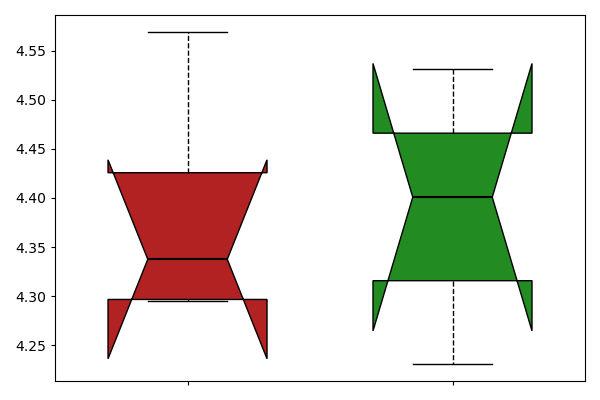
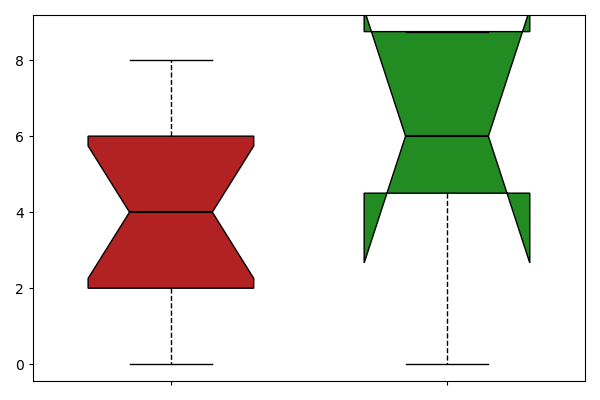
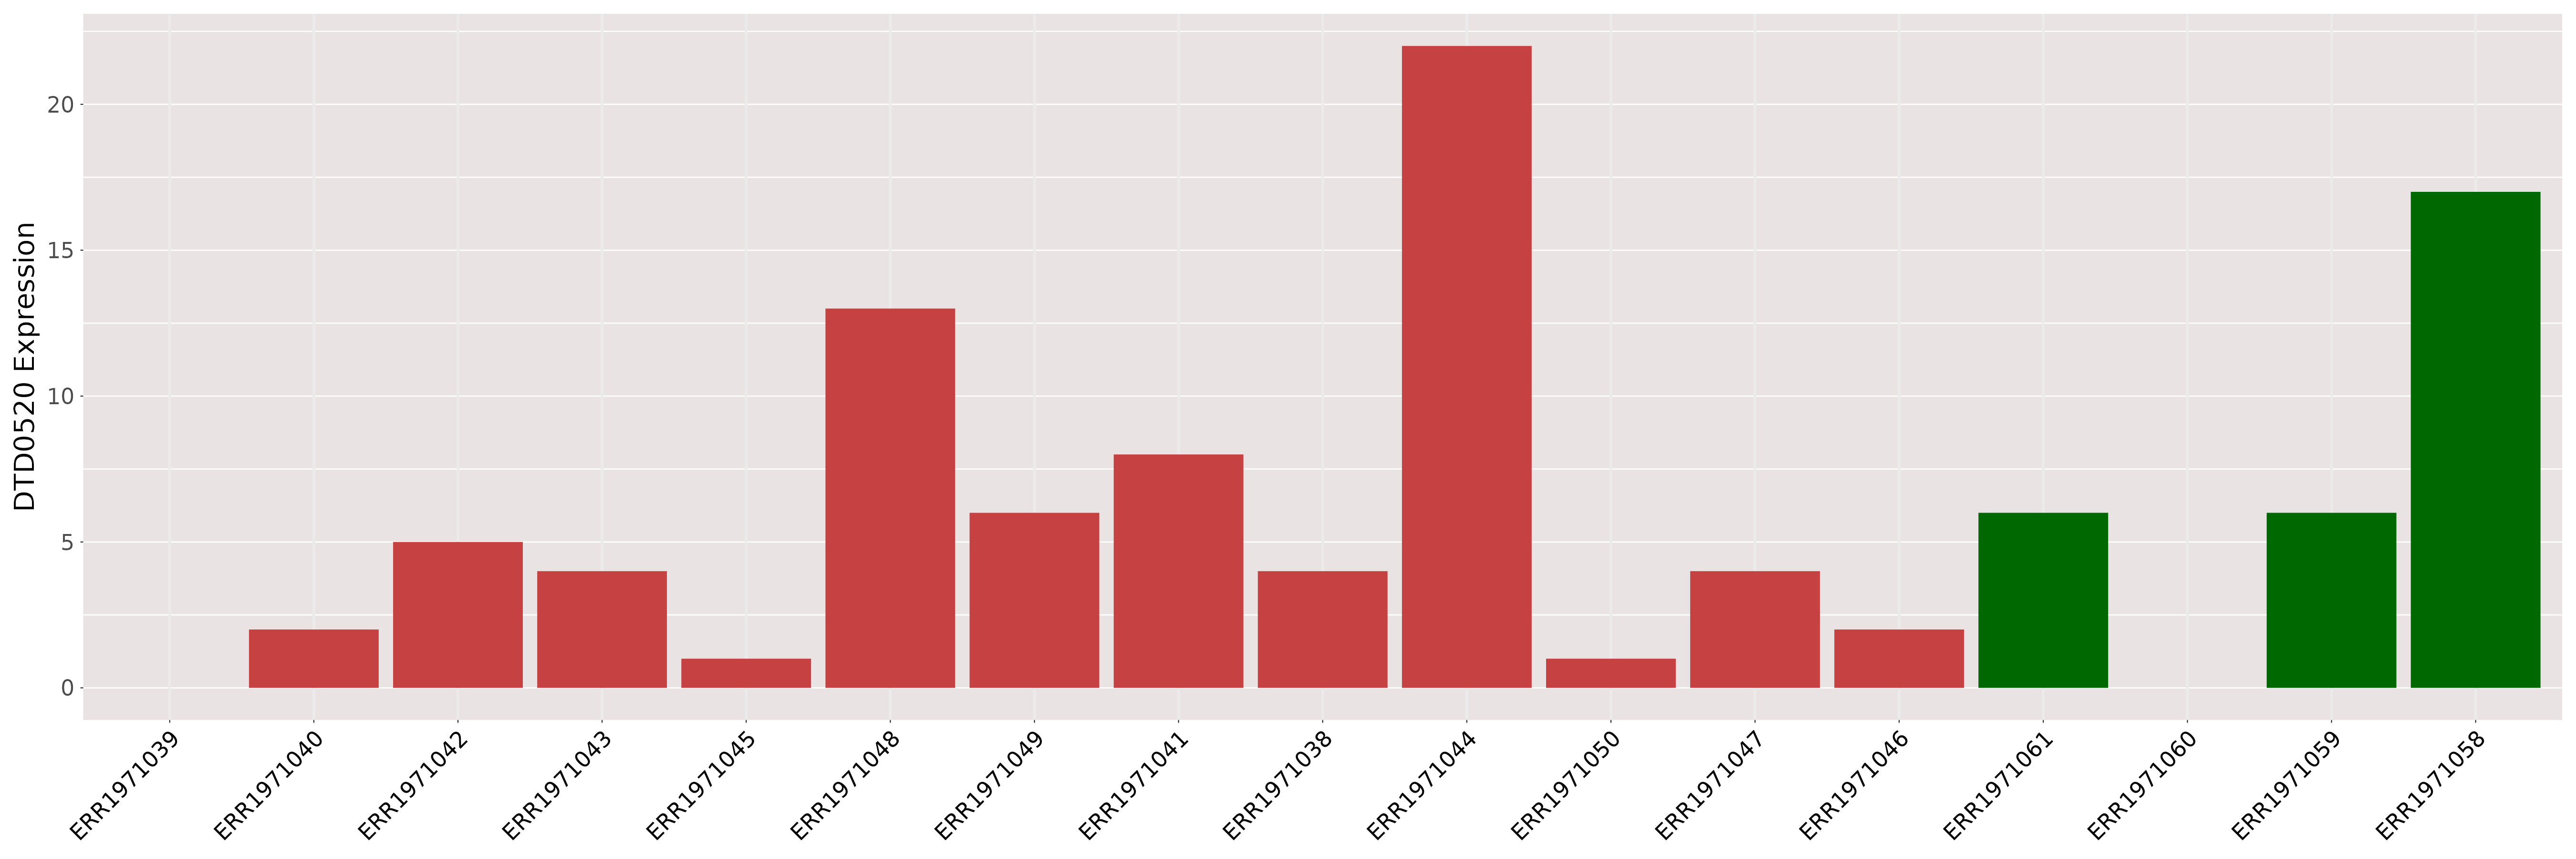
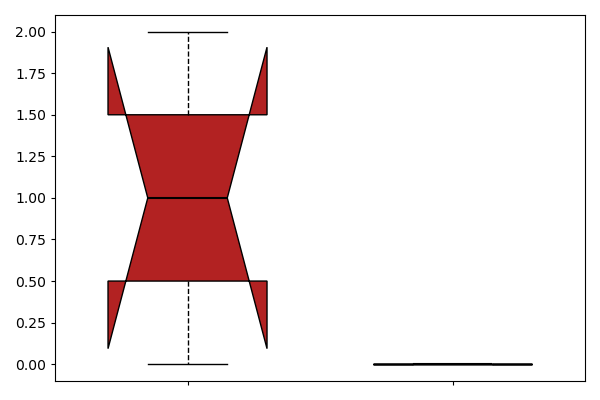
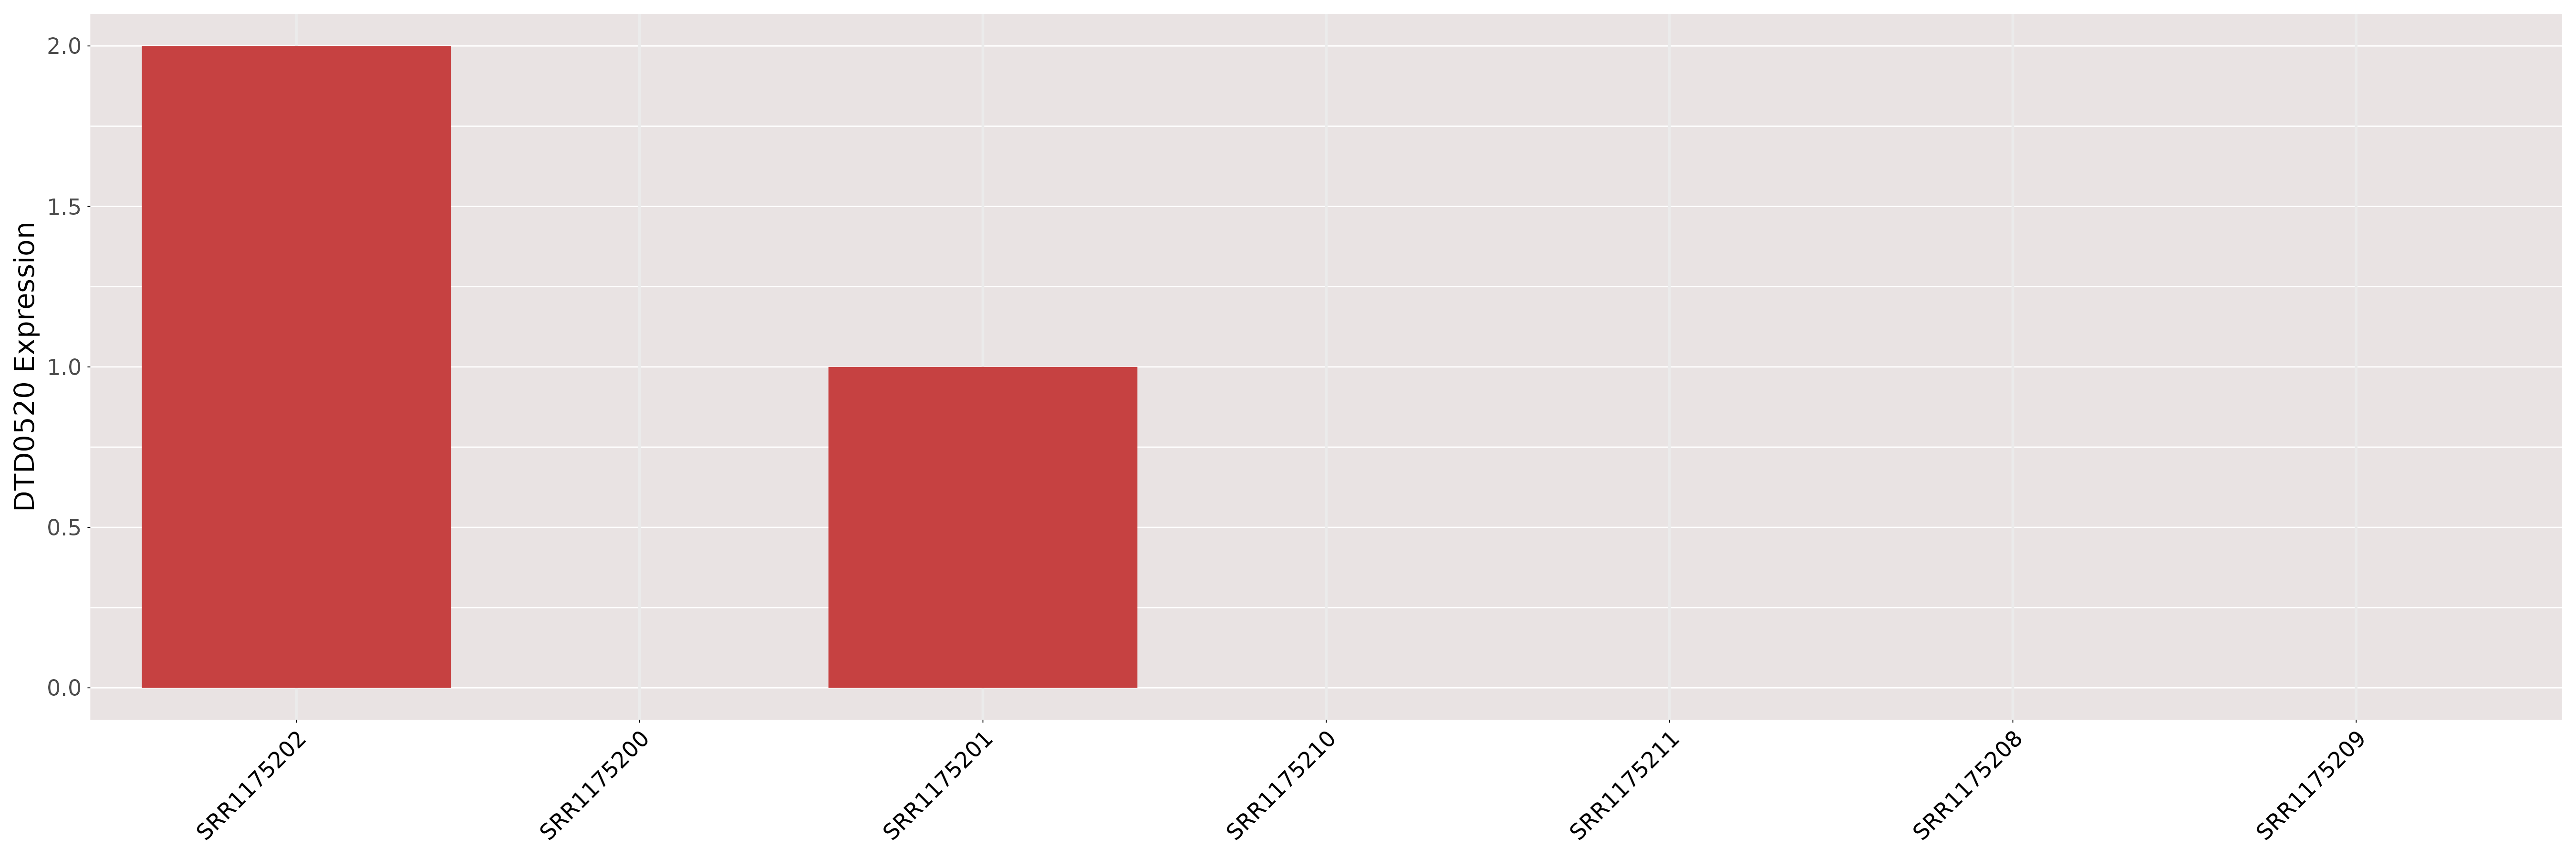
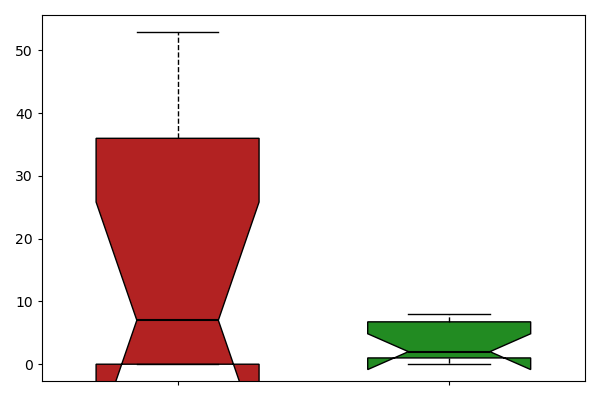
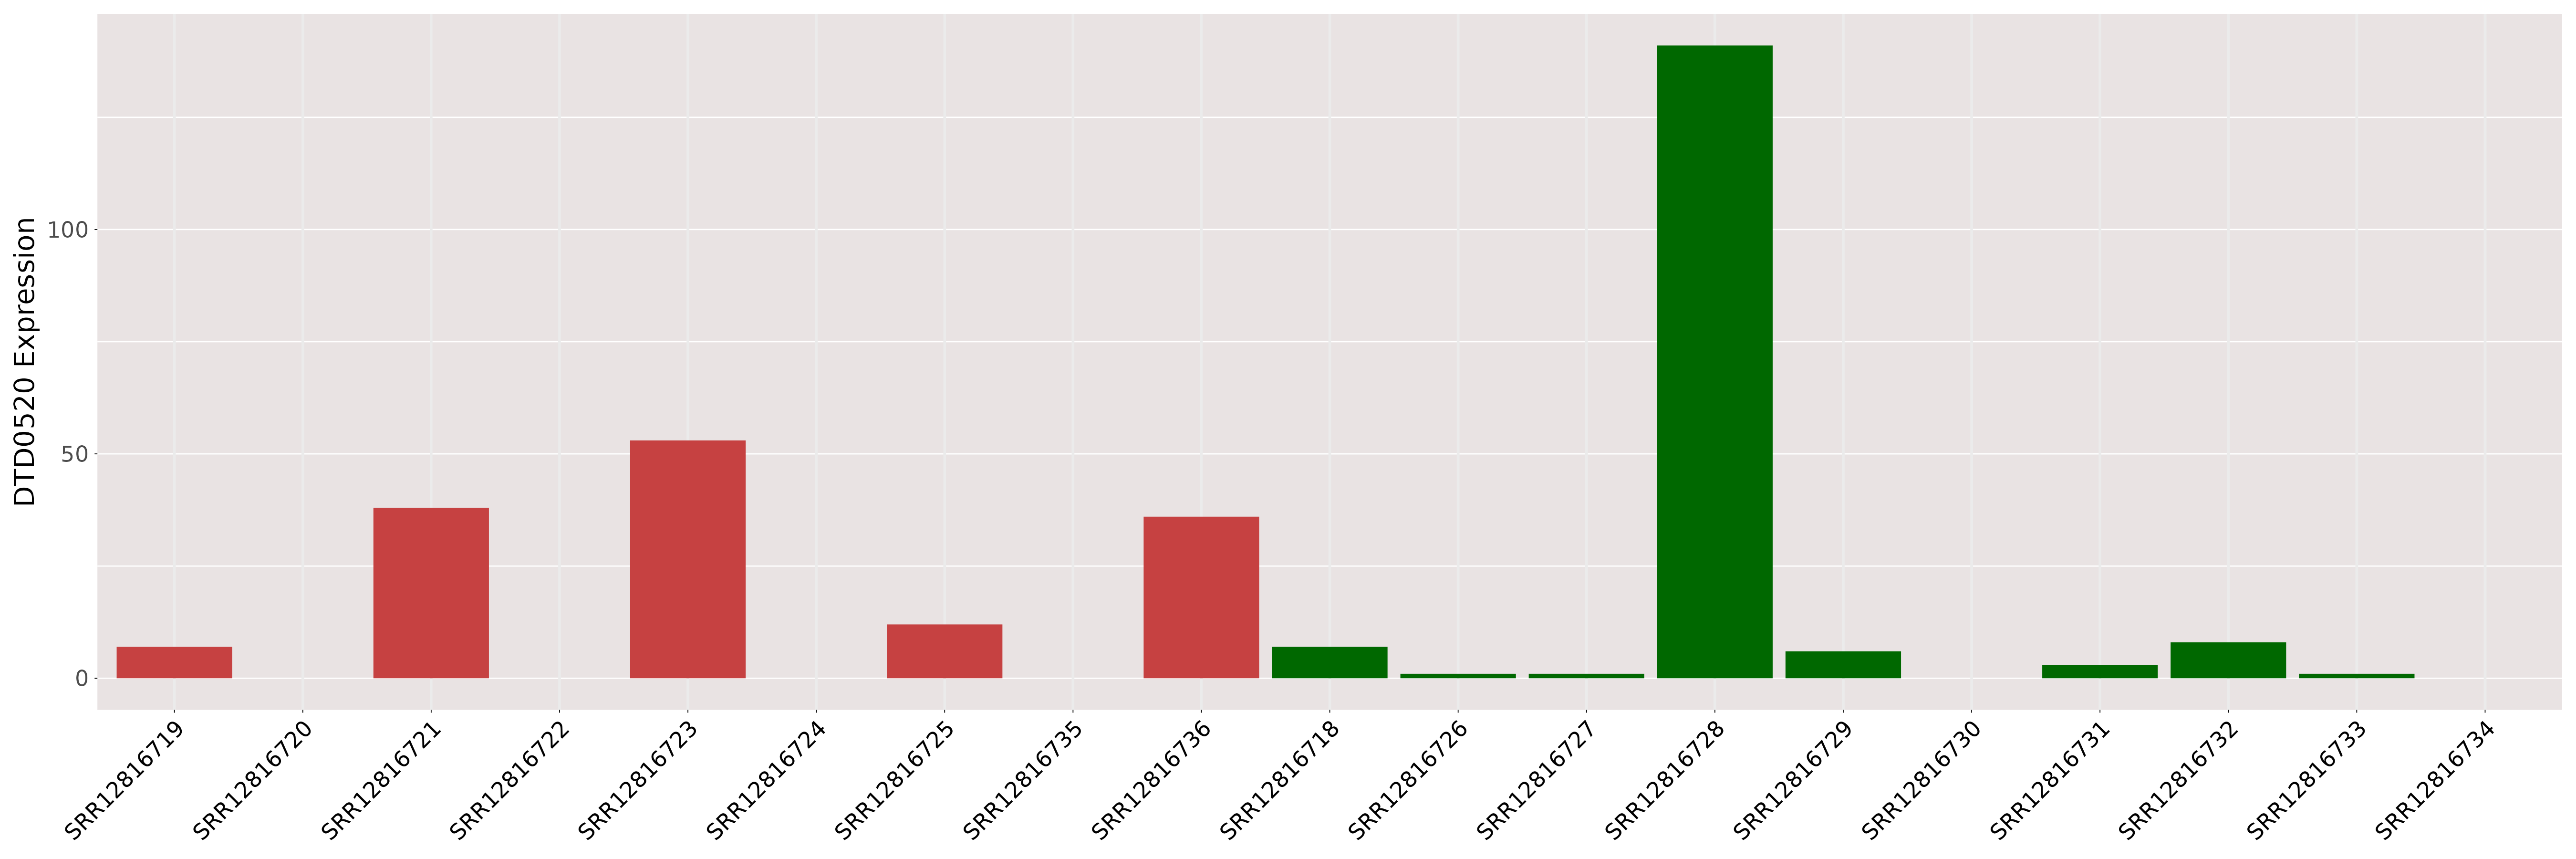
| [+] ICD-11: 1G50.0 Plasmodium falciparum malaria | Click to Show/Hide the Full List | ||||
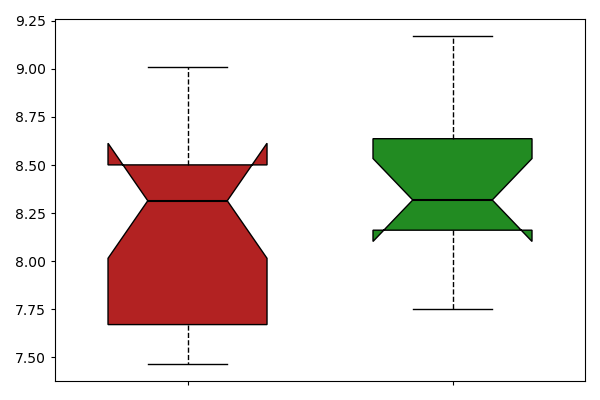
| The Studied Tissue | Blood | ||||
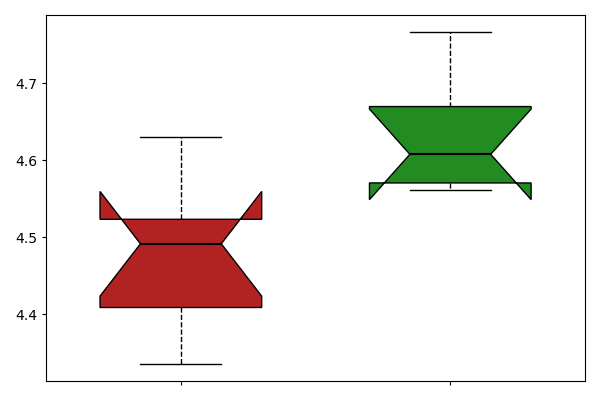
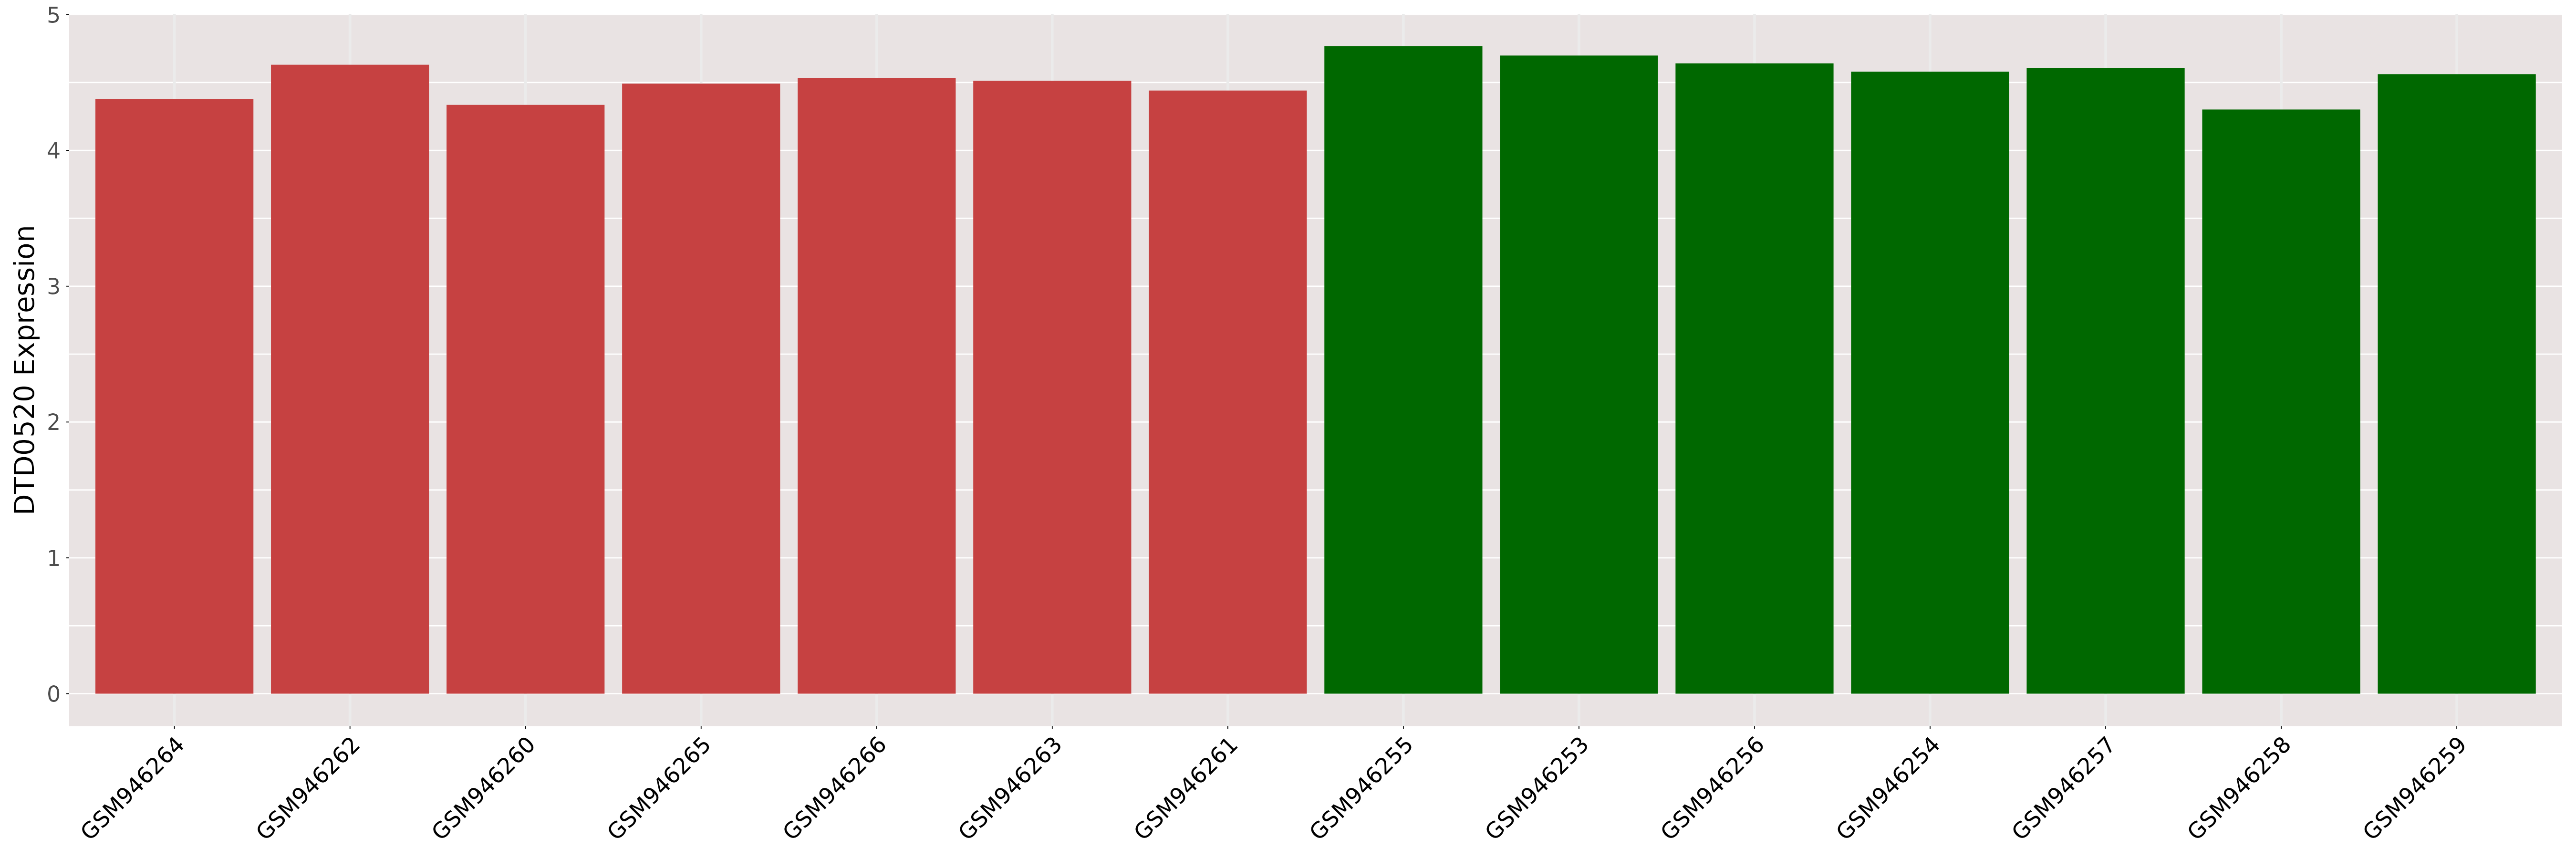
| The Specified Disease | Plasmodium falciparum malaria [ICD-11:1G50.0] | ||||
| The Expression Level of Disease Section Compare with the Healthy Individual Tissue | p-value:0.9536037112247824; Fold-change:1.012749125648616; Z-score:-0.010400038 | ||||
| DT expression in the diseased tissue of patients
DT expression in the normal tissue of healthy individuals
|
|||||
|
 Please Click the above Thumbnail to View/Download
the Expression Barchart for All Samples Please Click the above Thumbnail to View/Download
the Expression Barchart for All Samples
|
||||
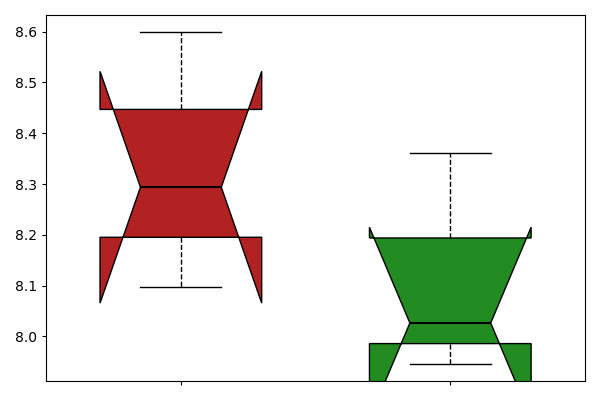
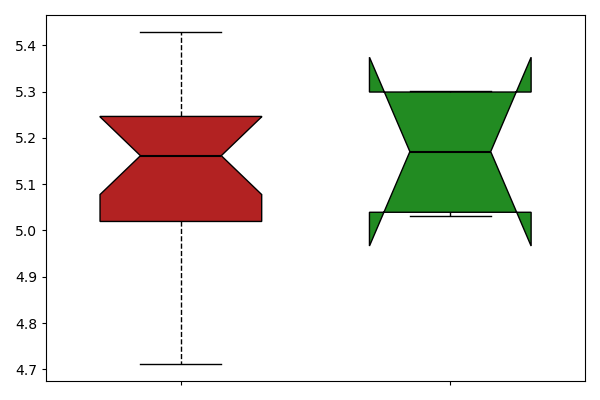
| ICD-11: 02 Neoplasm | |||||
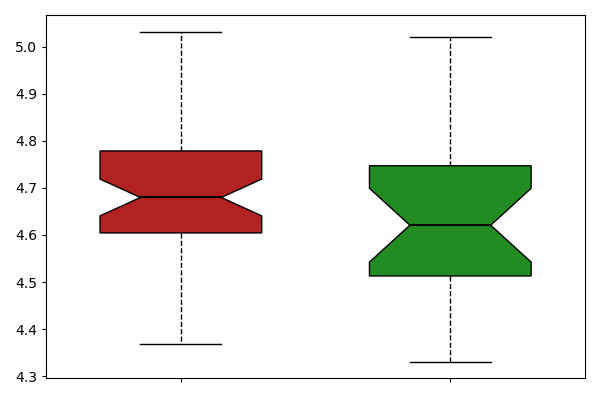
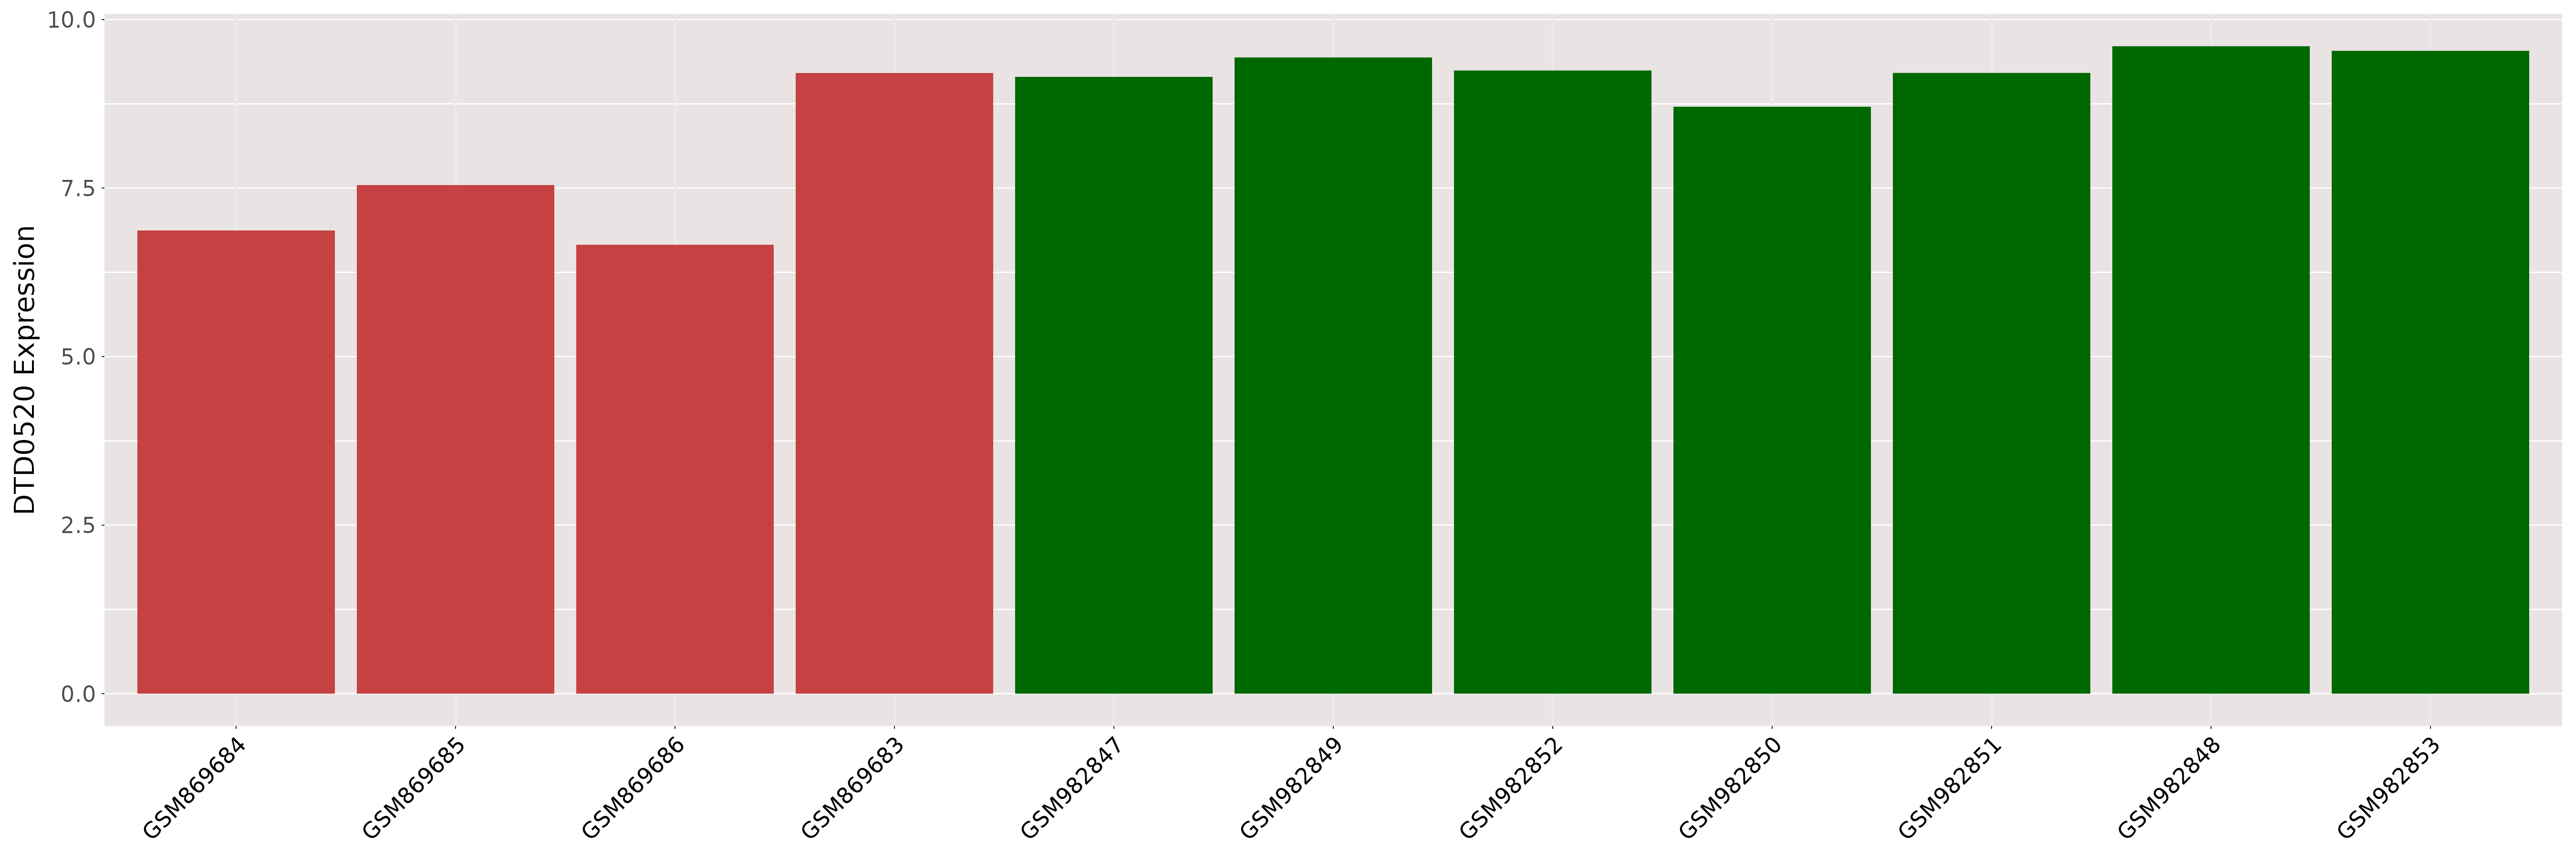
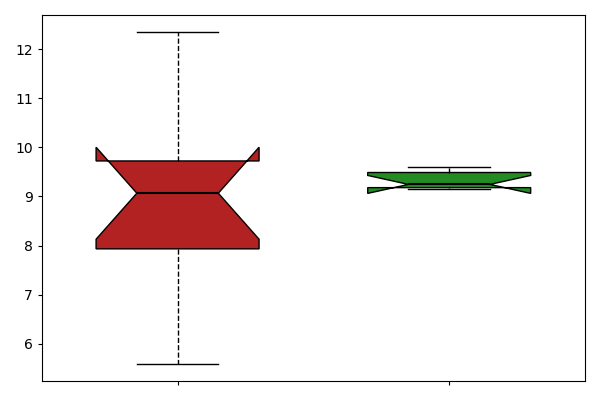
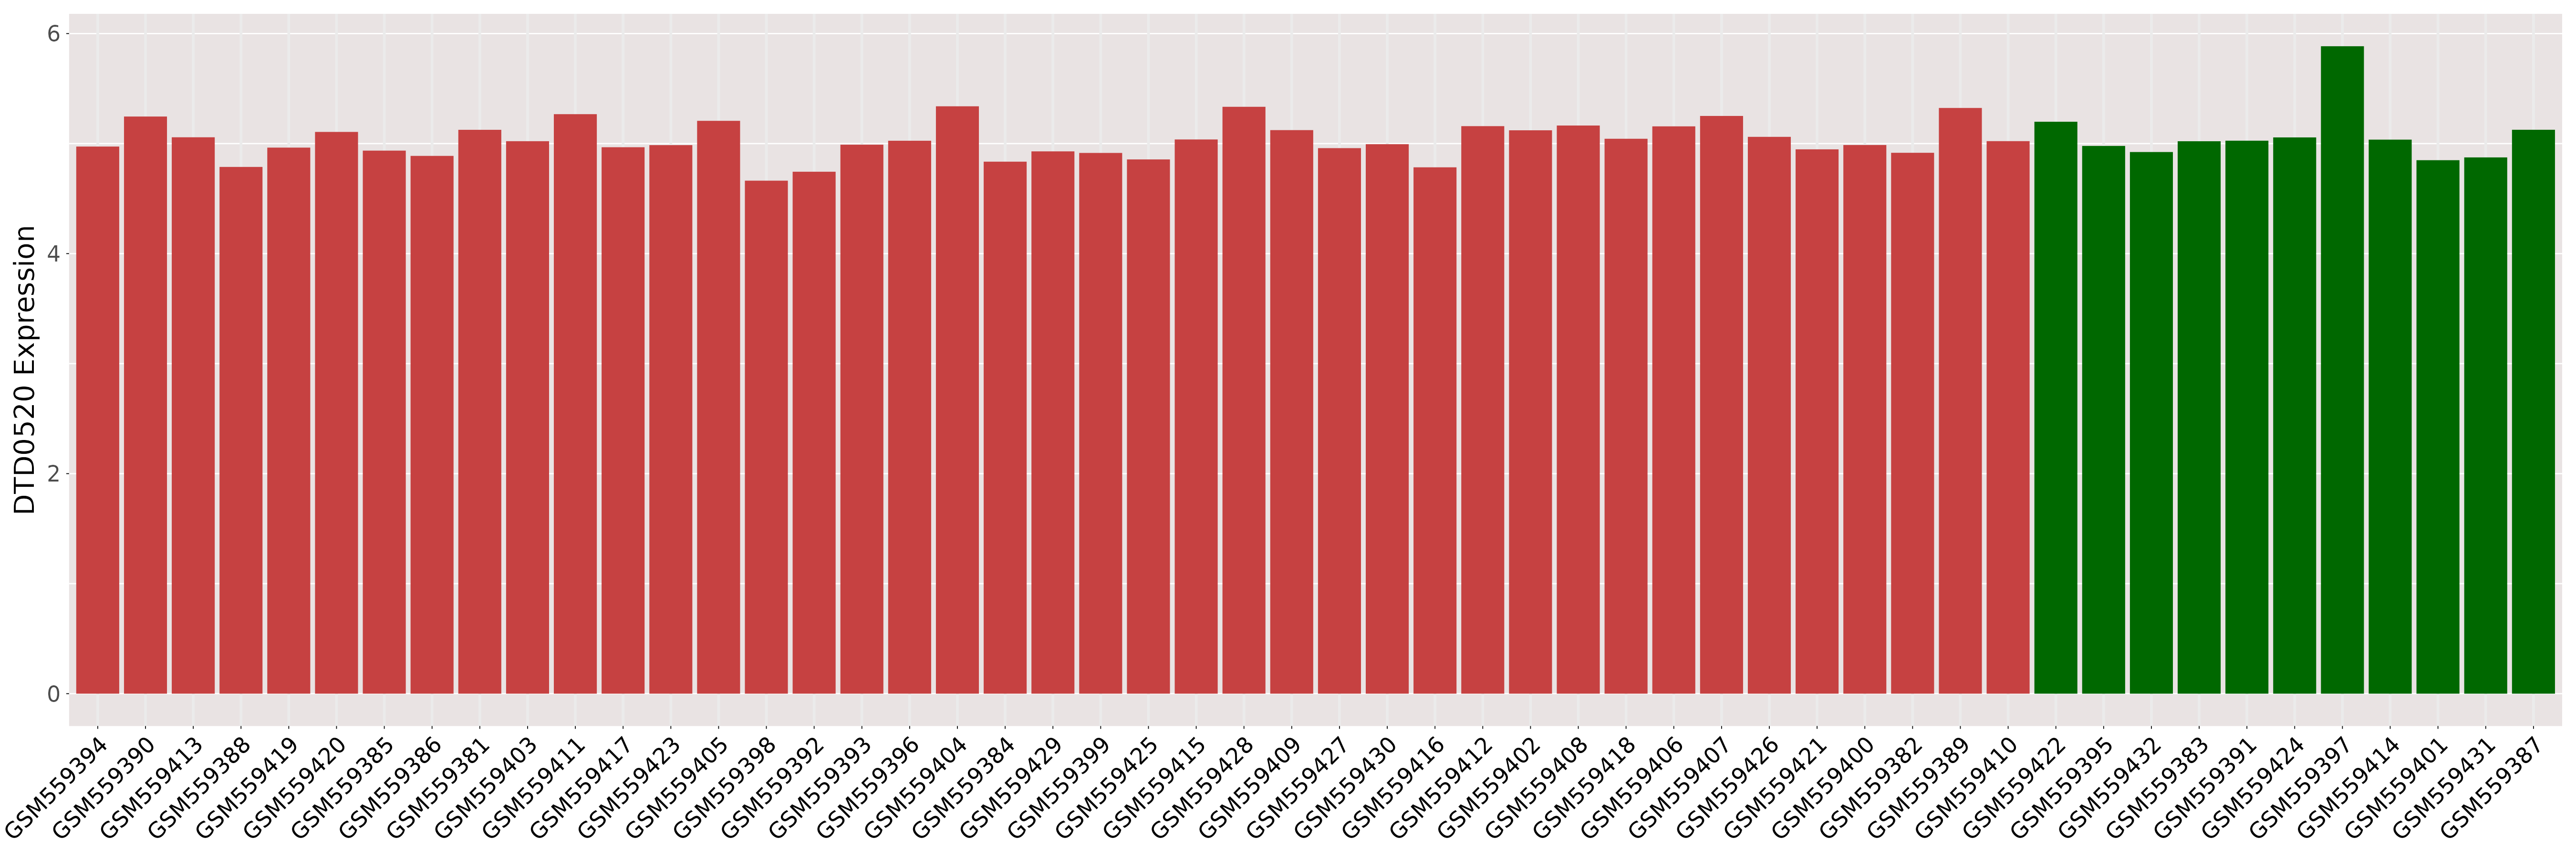
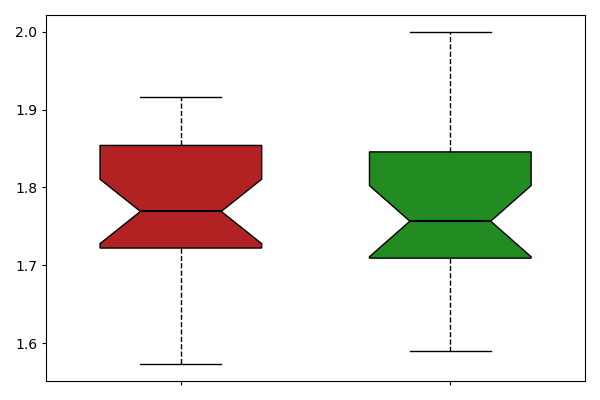
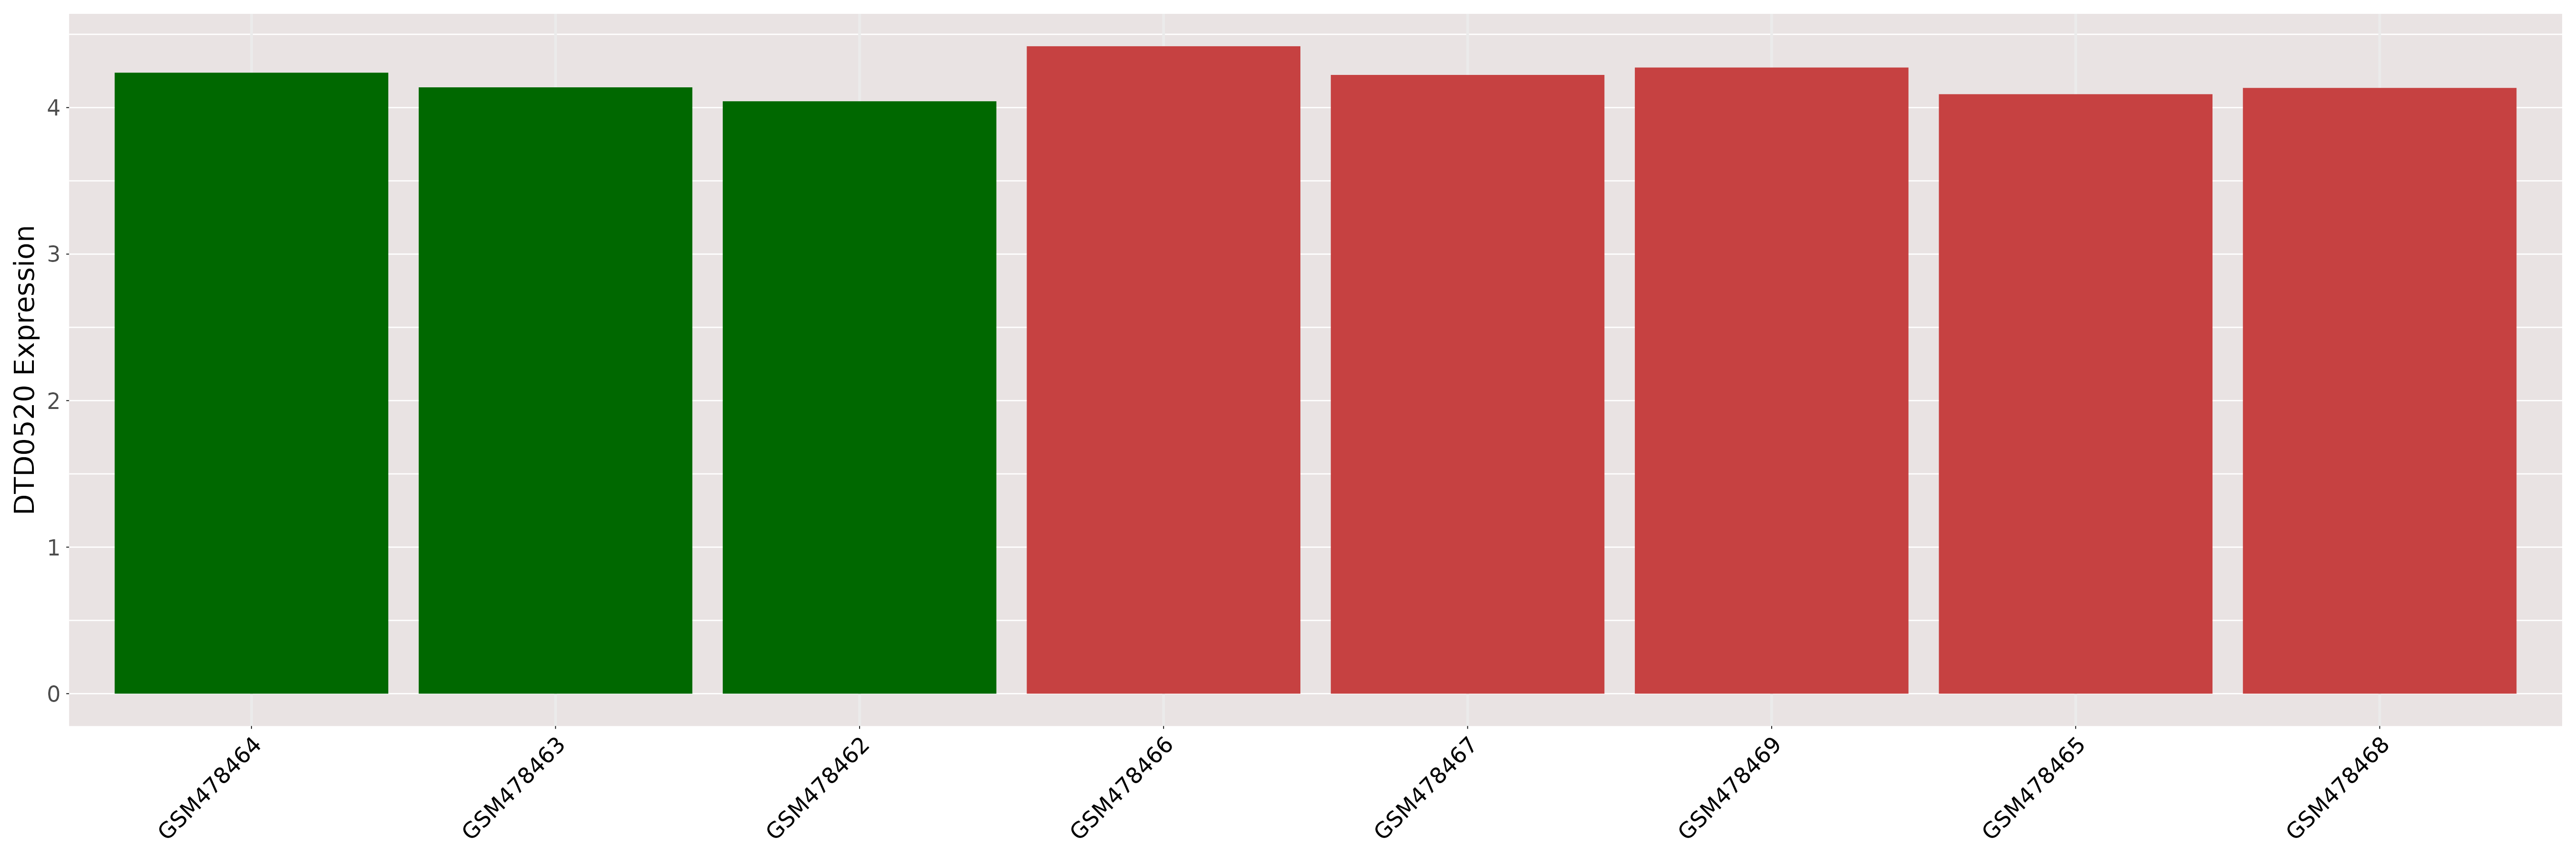
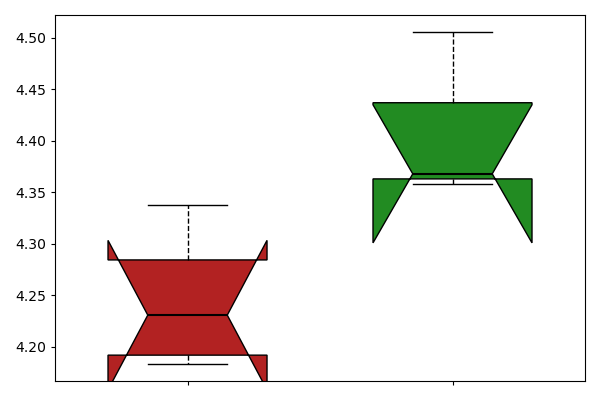
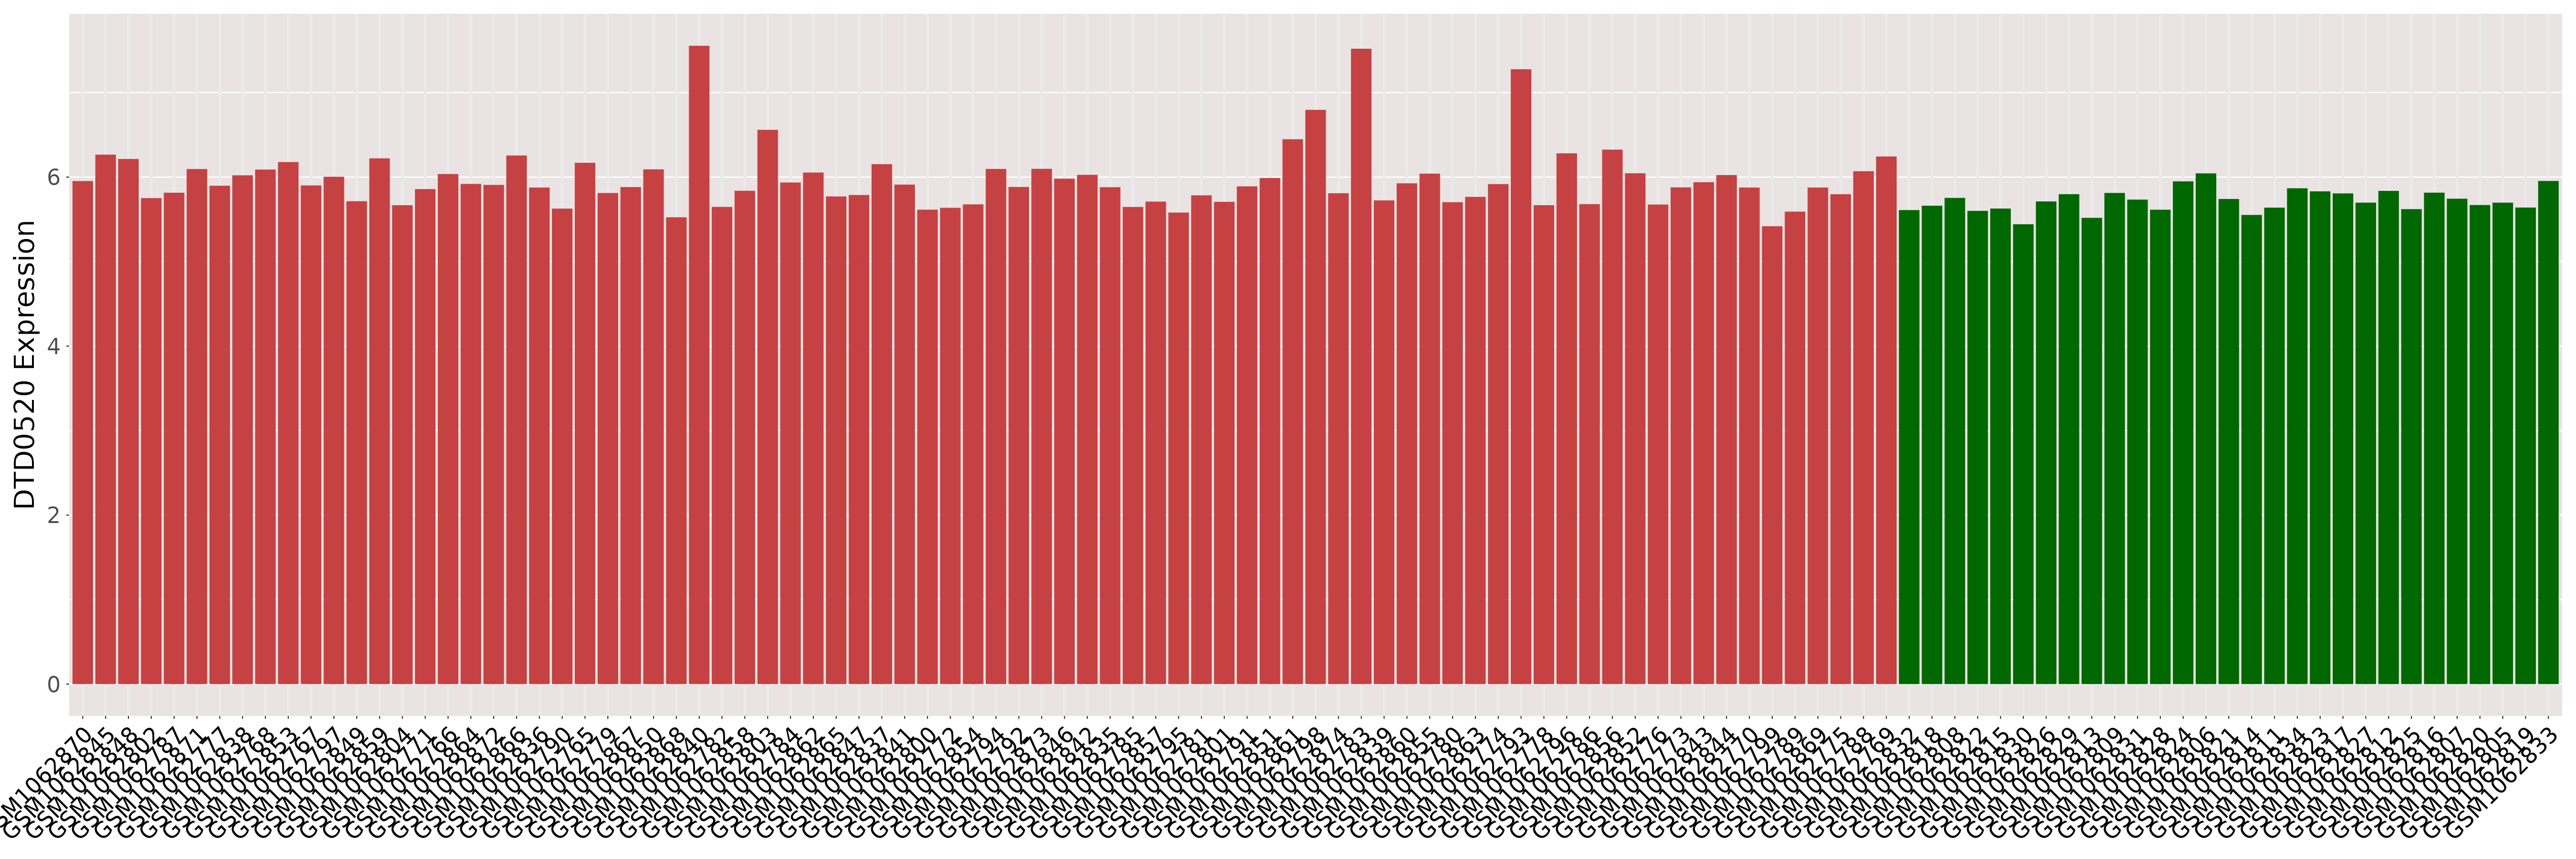
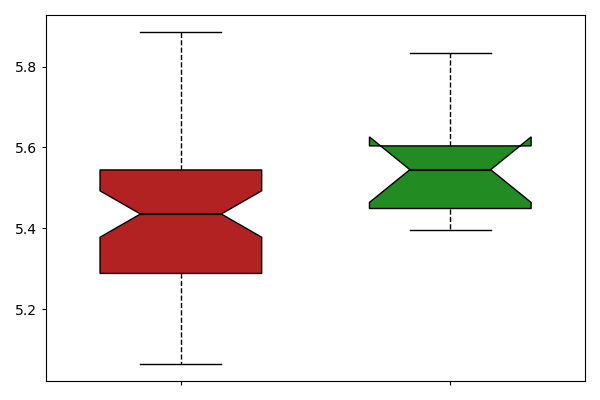
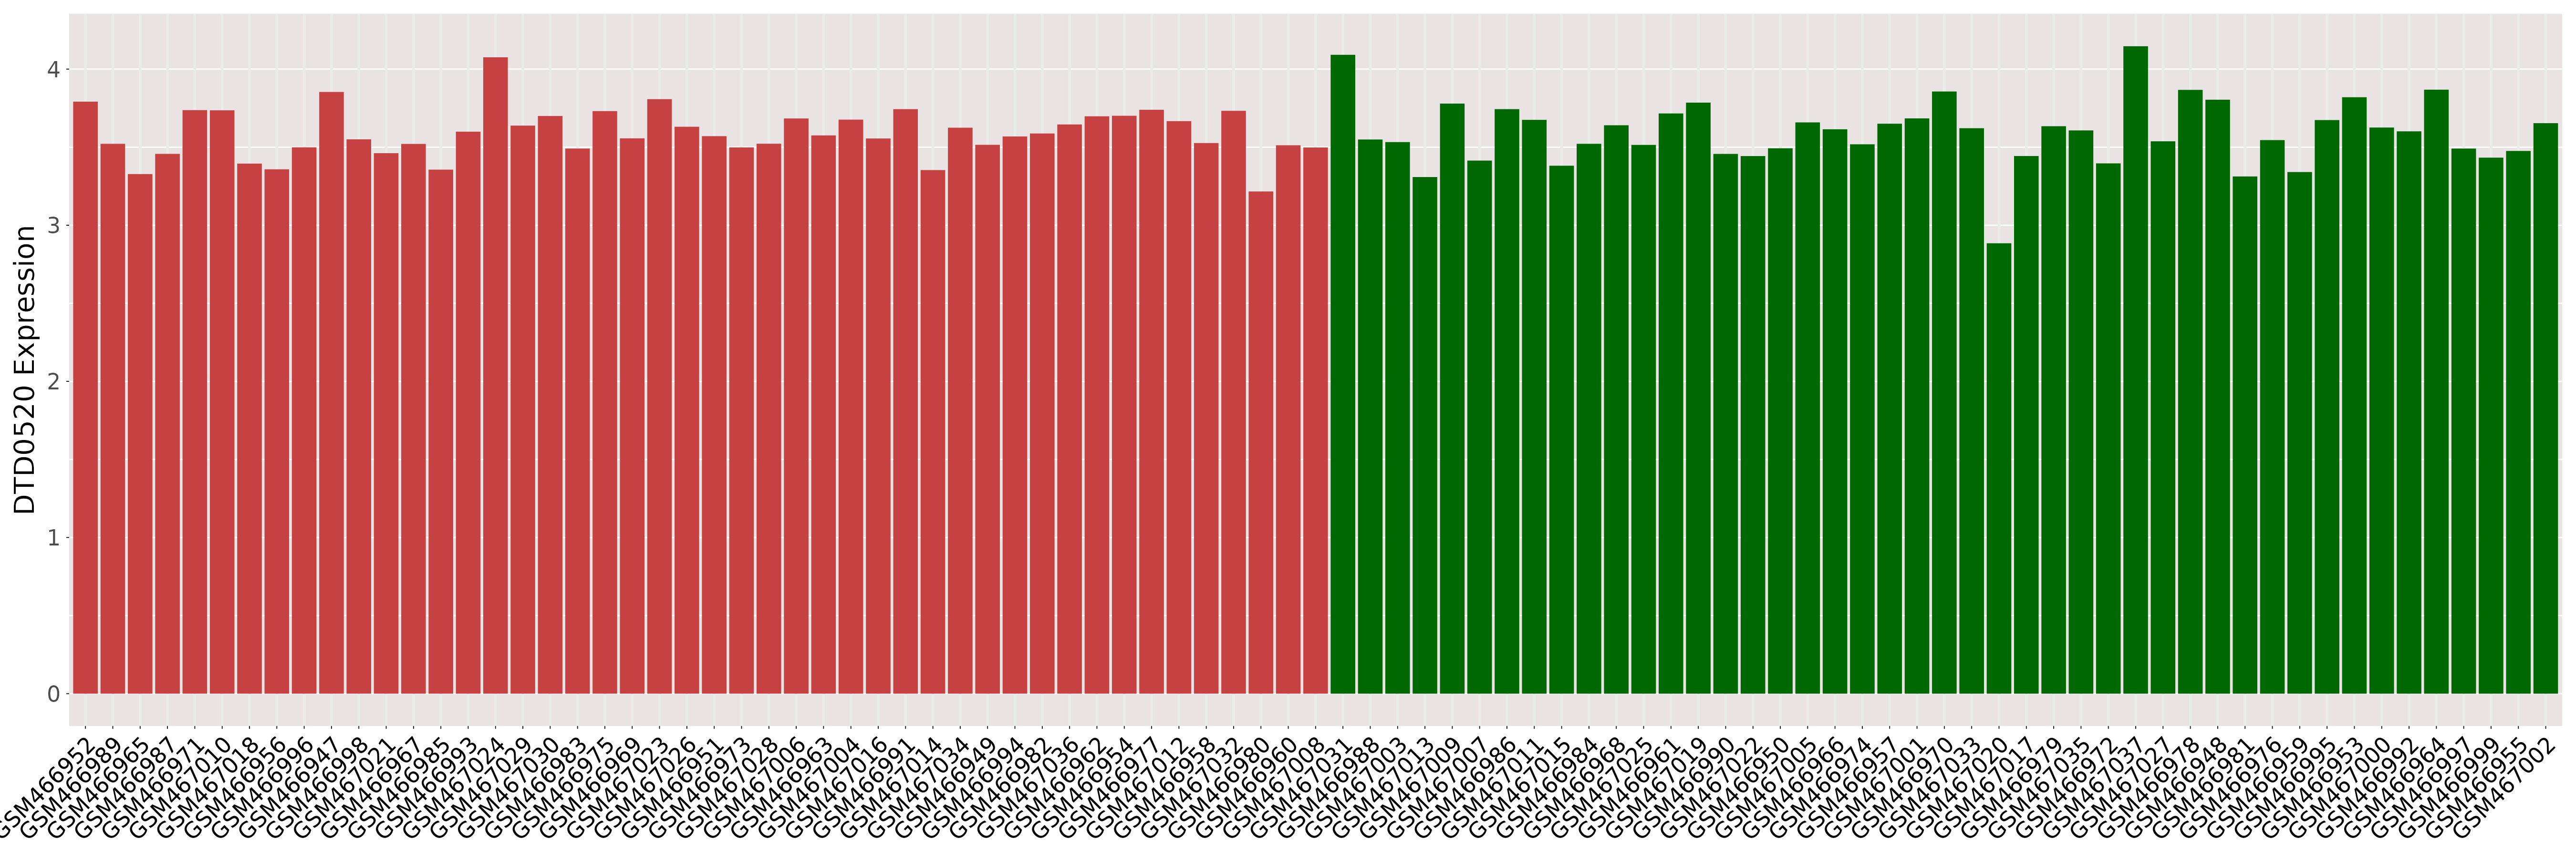
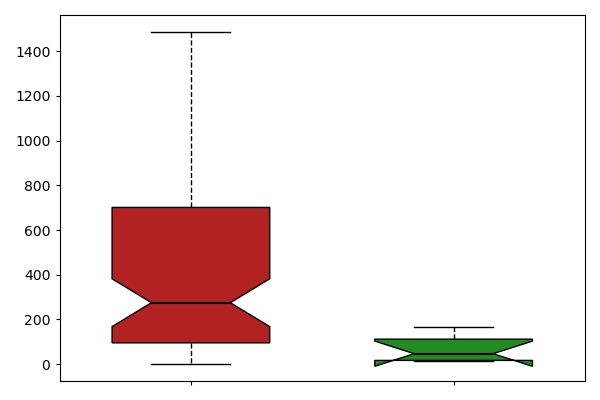
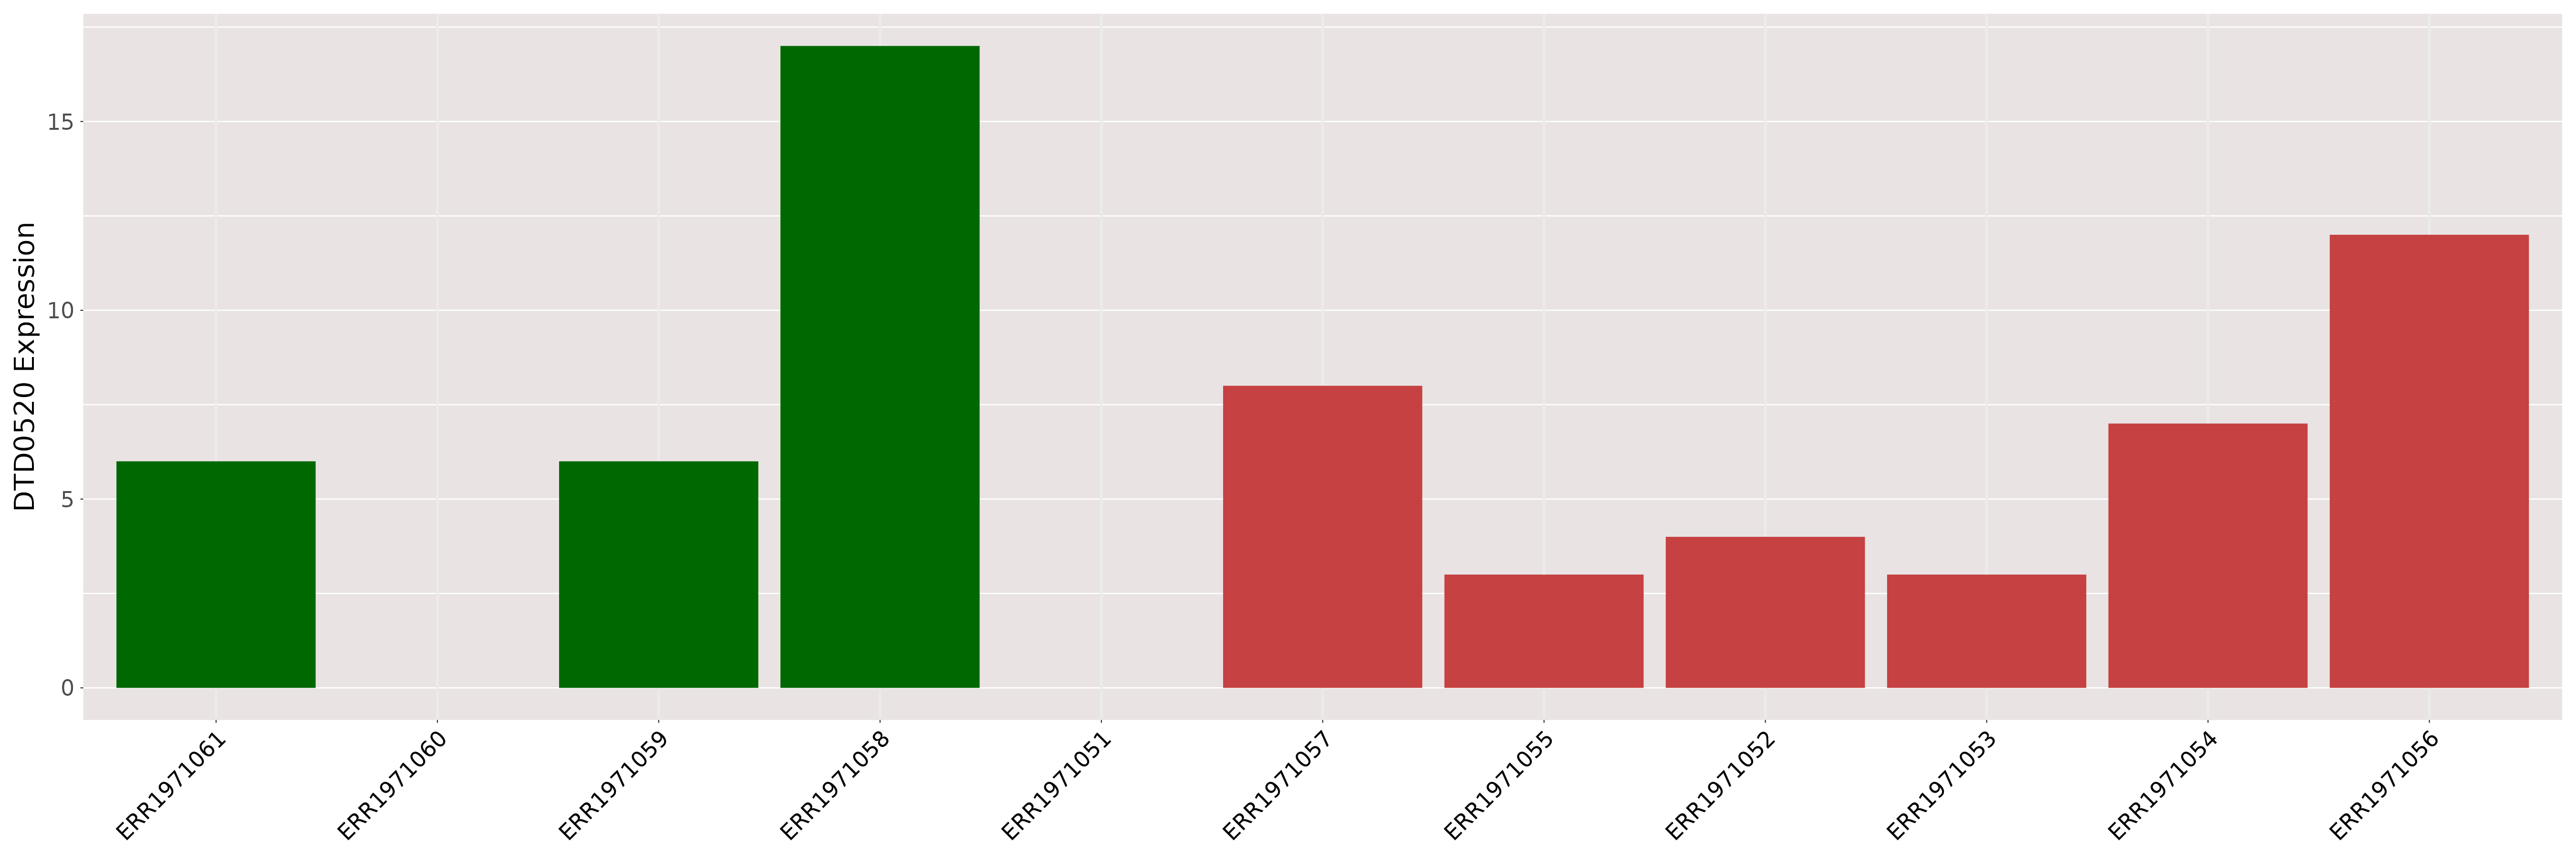
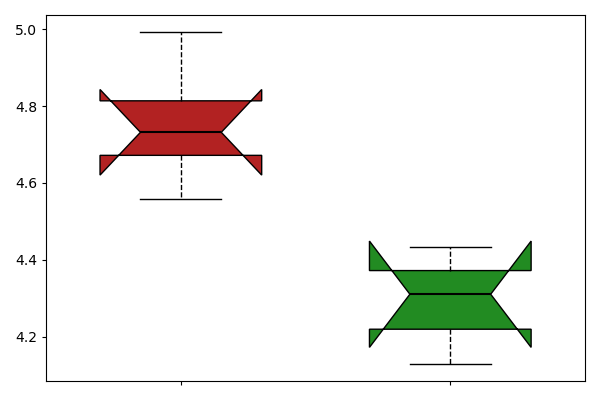
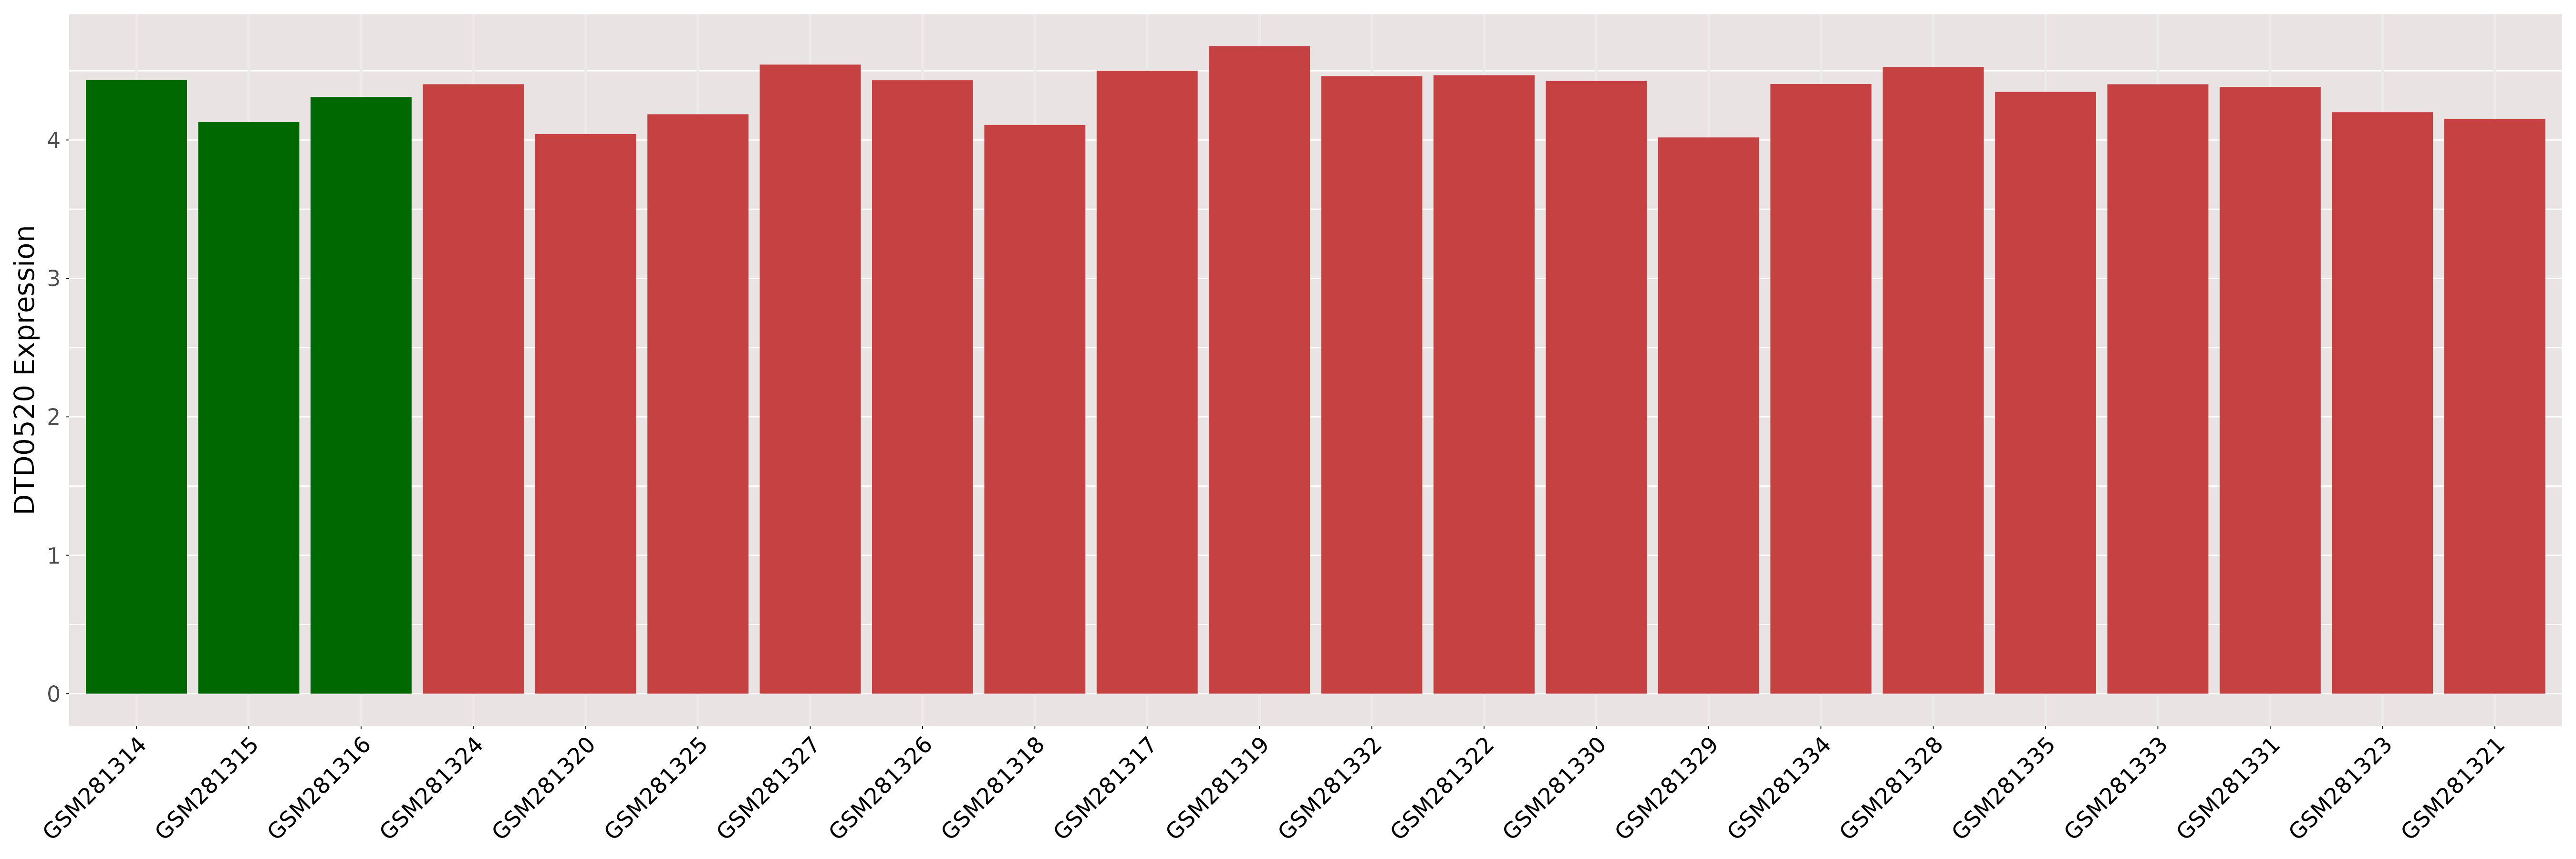
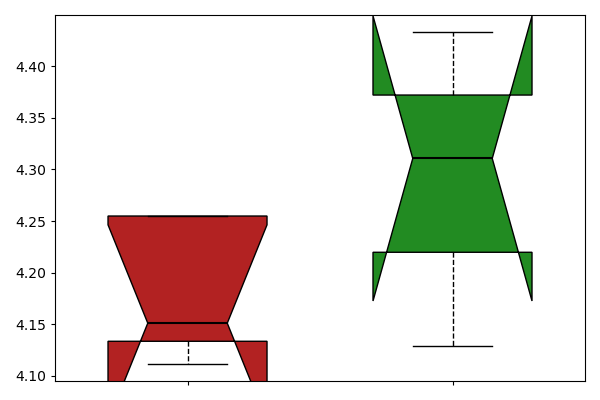
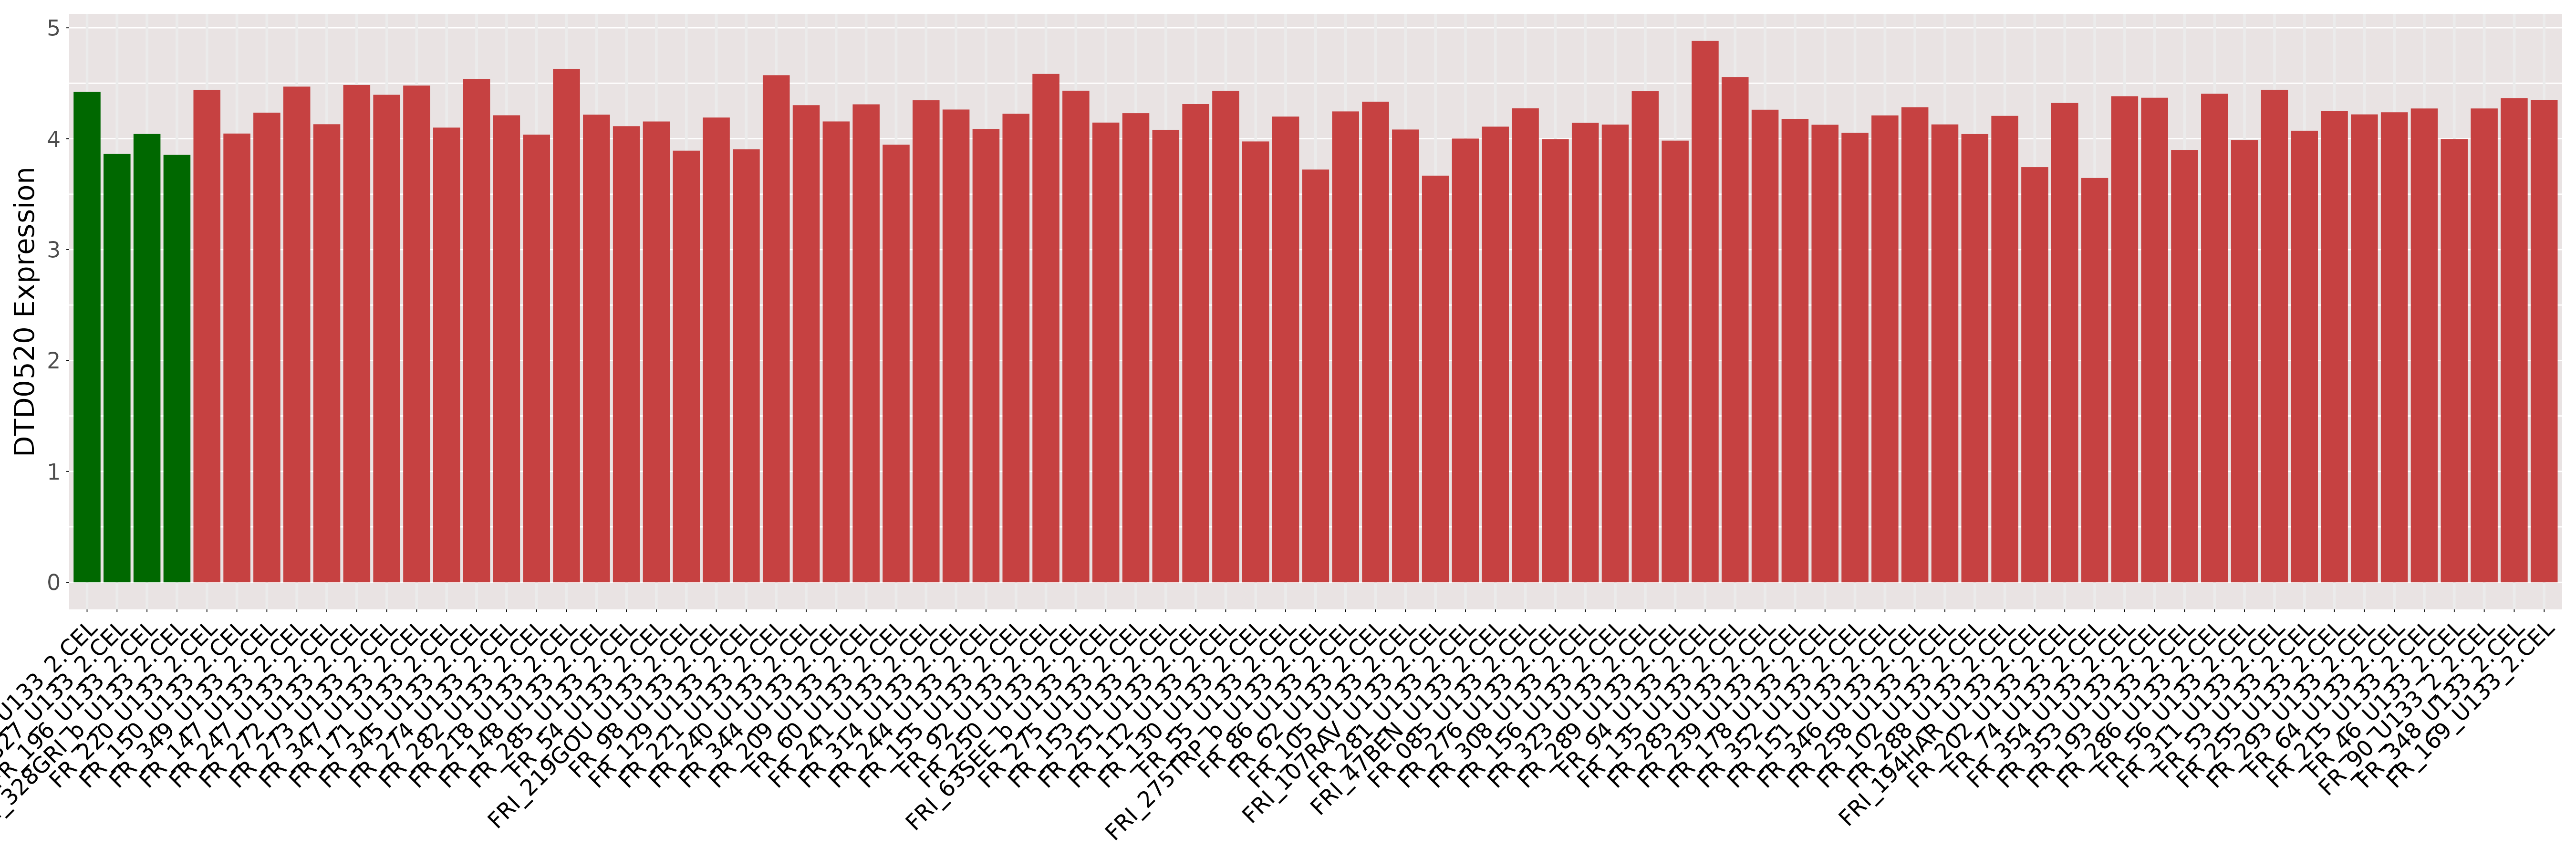
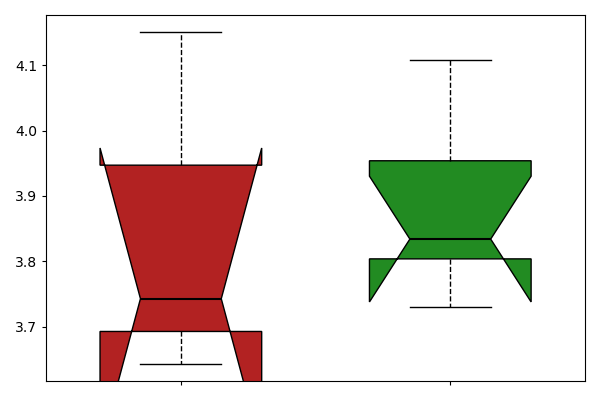
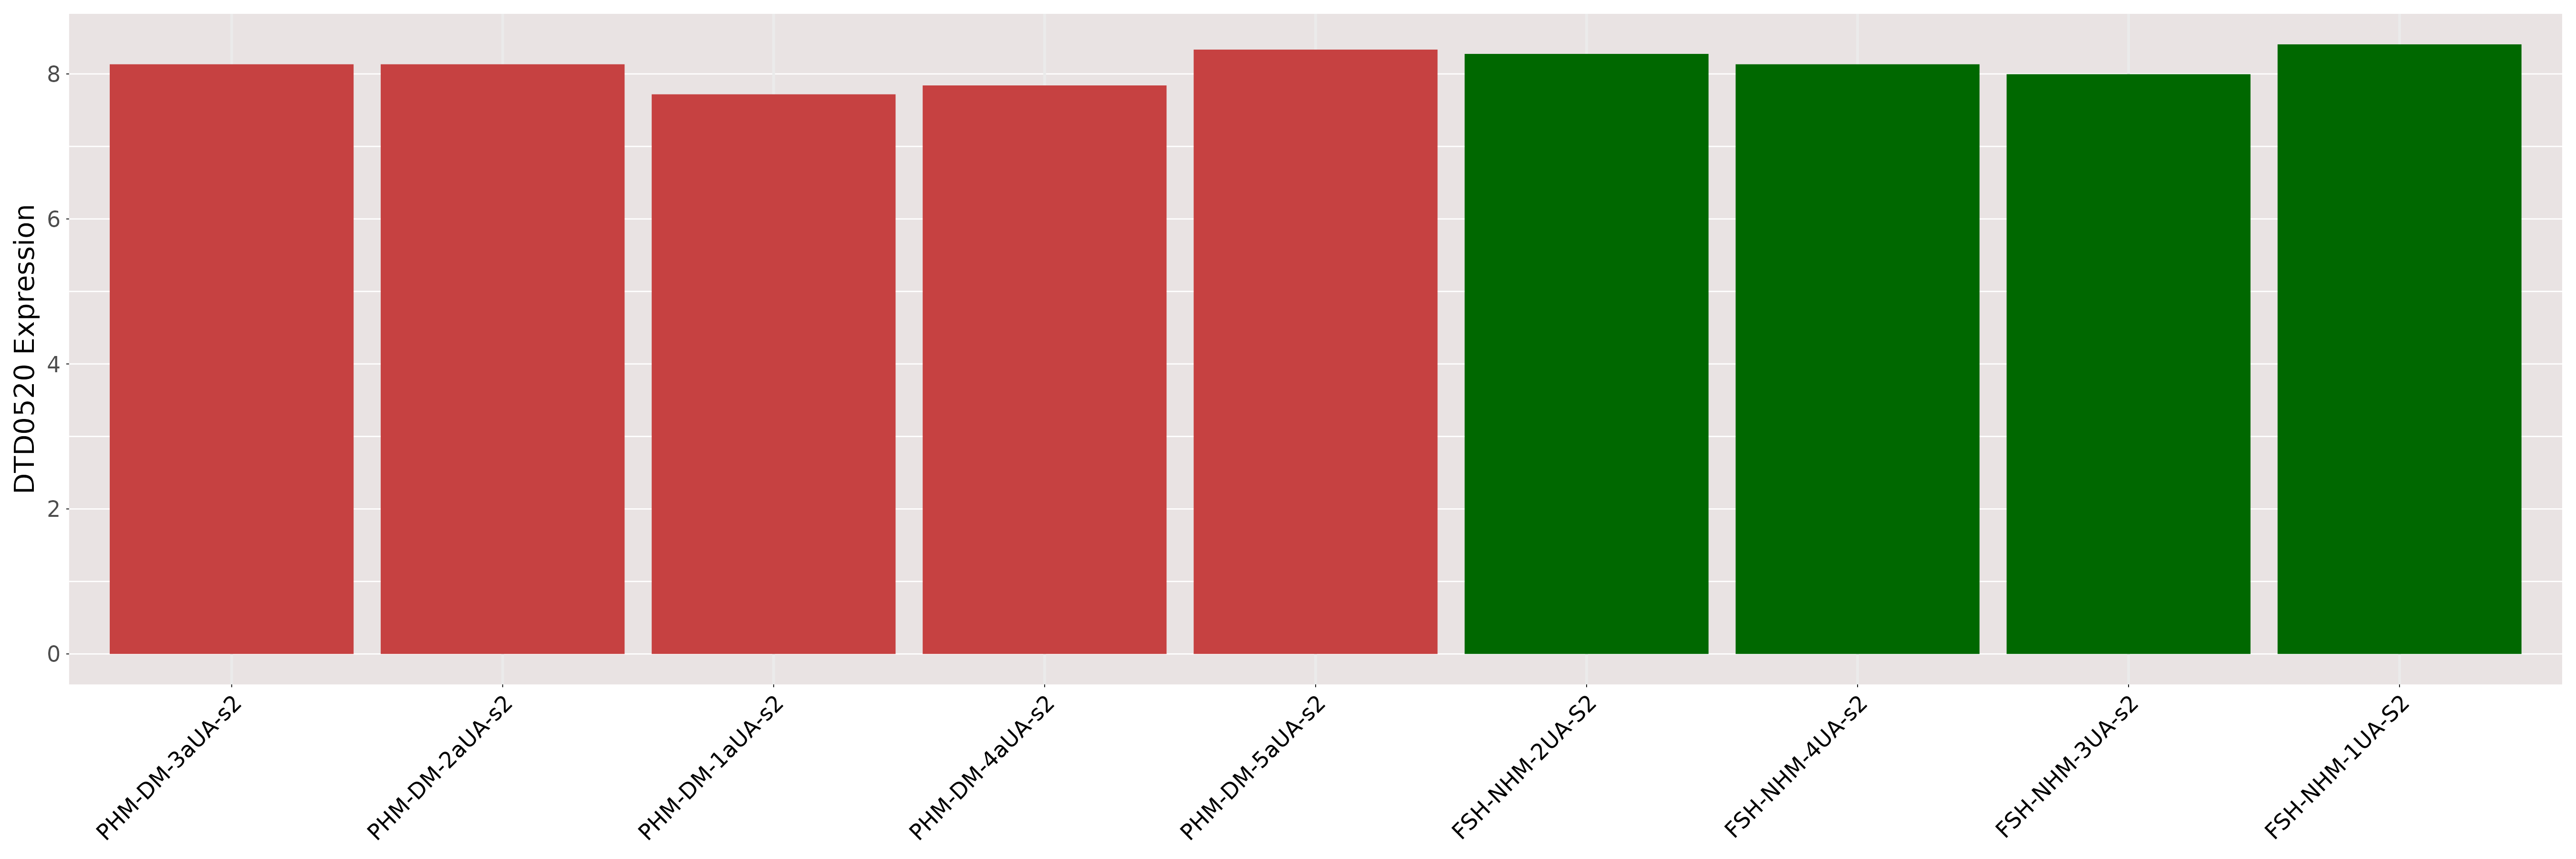
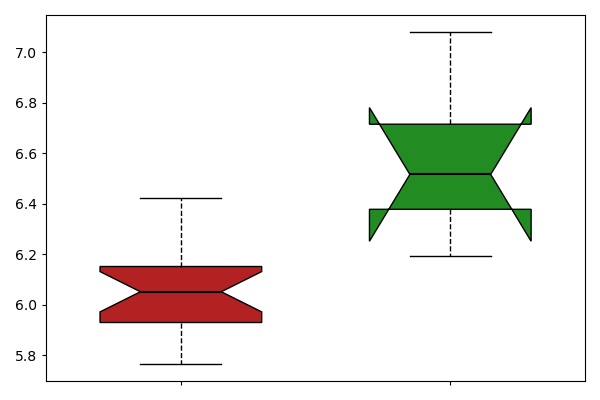
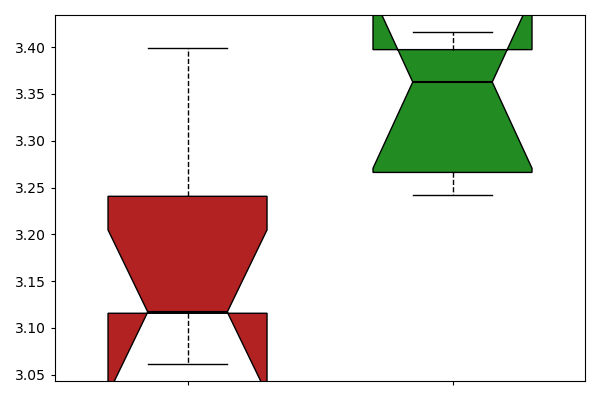
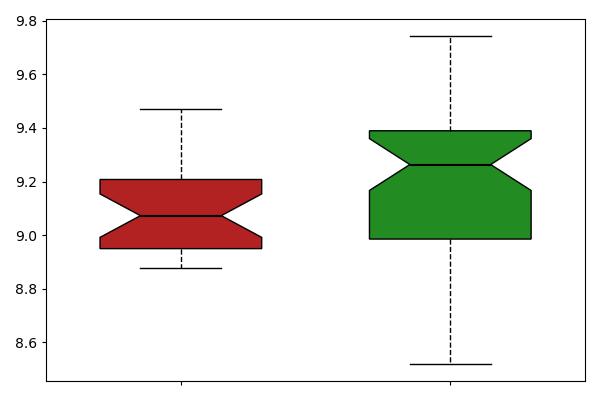
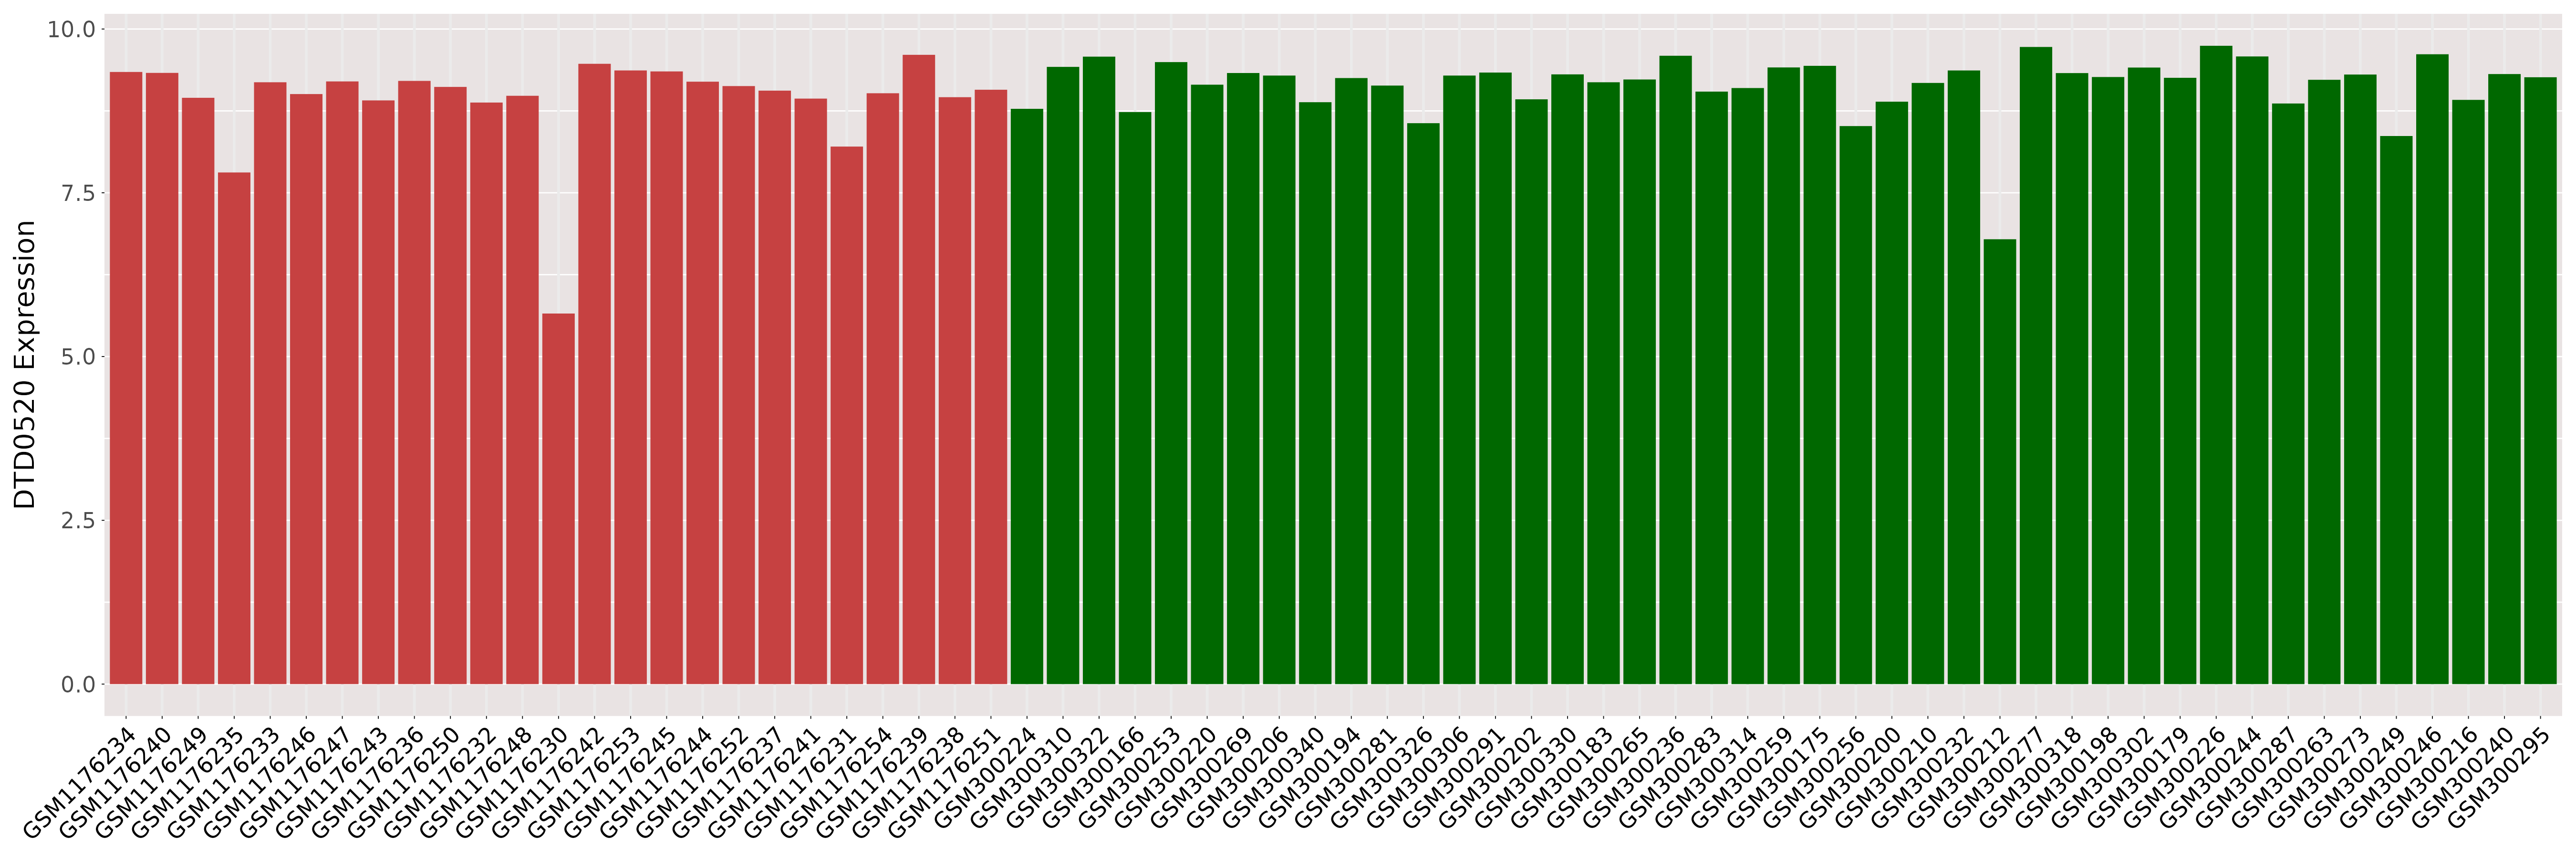
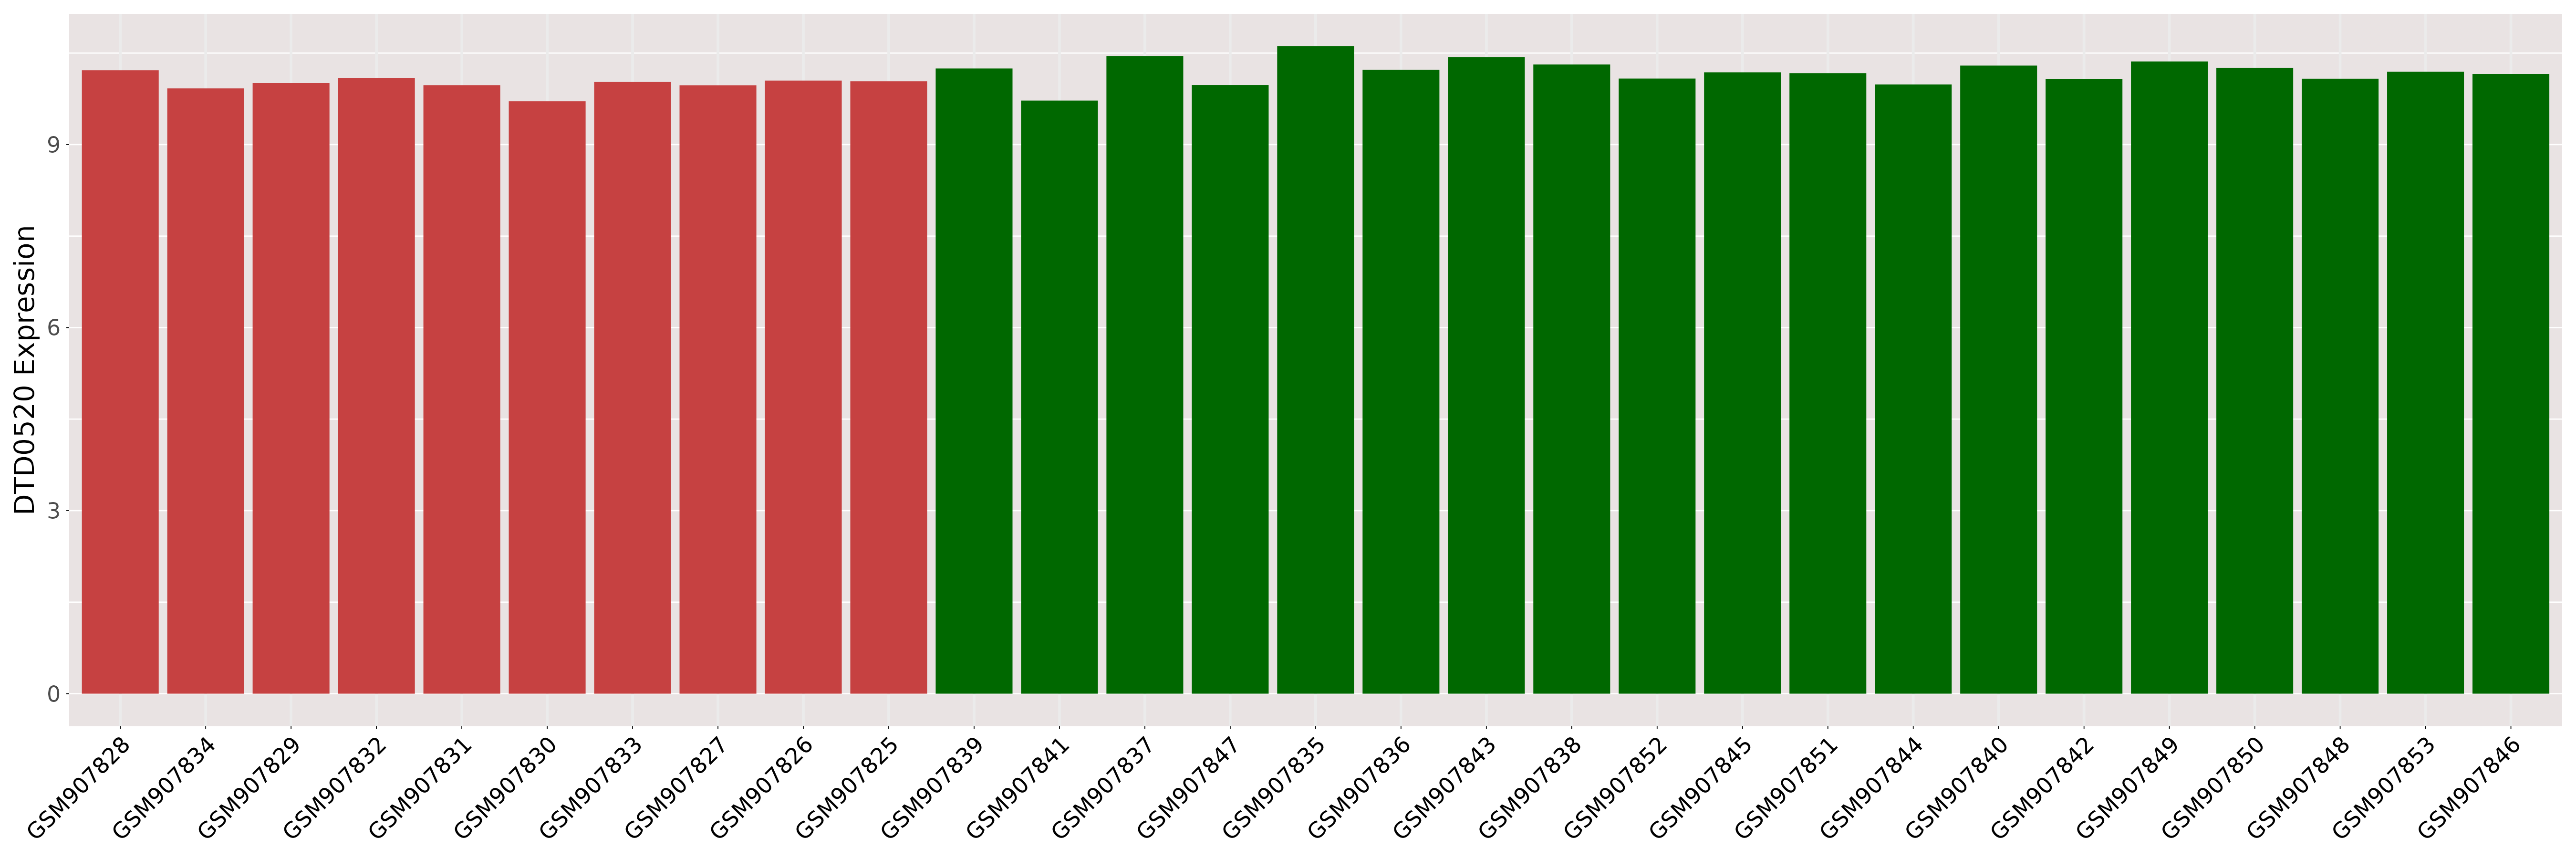
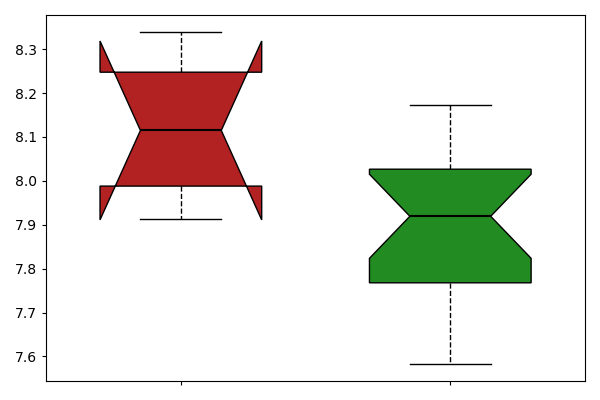
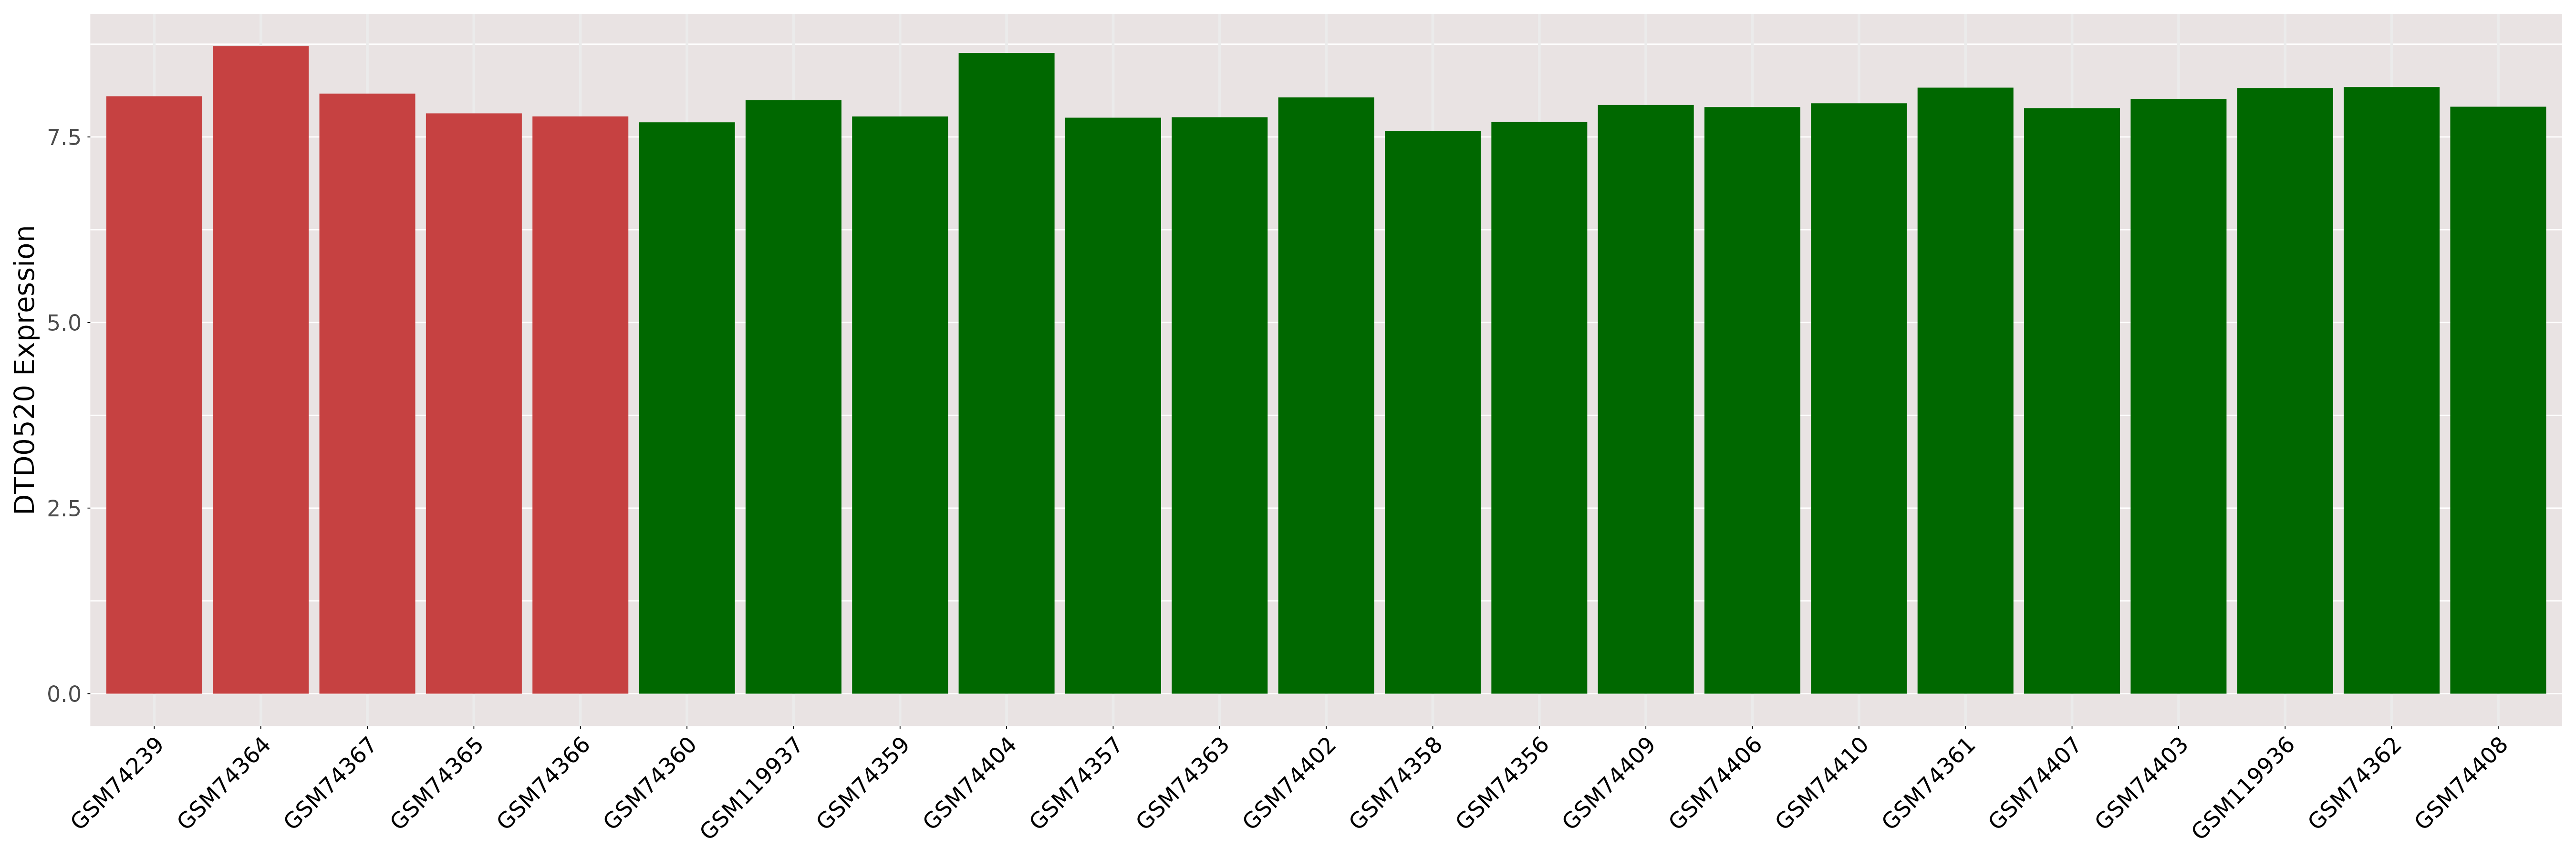
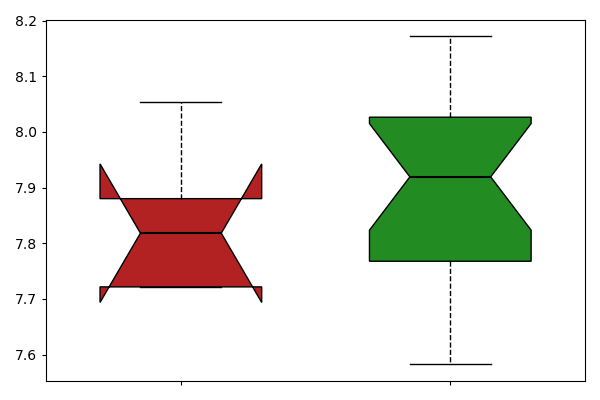
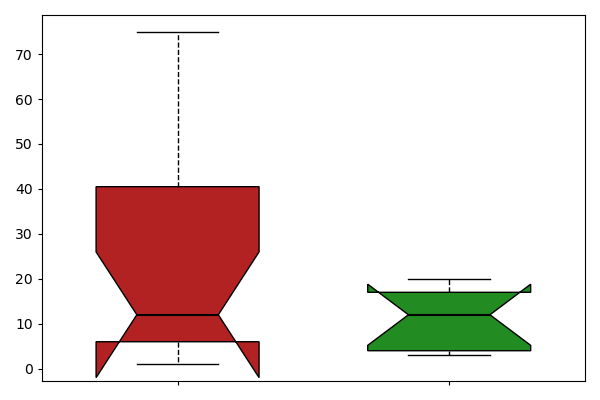
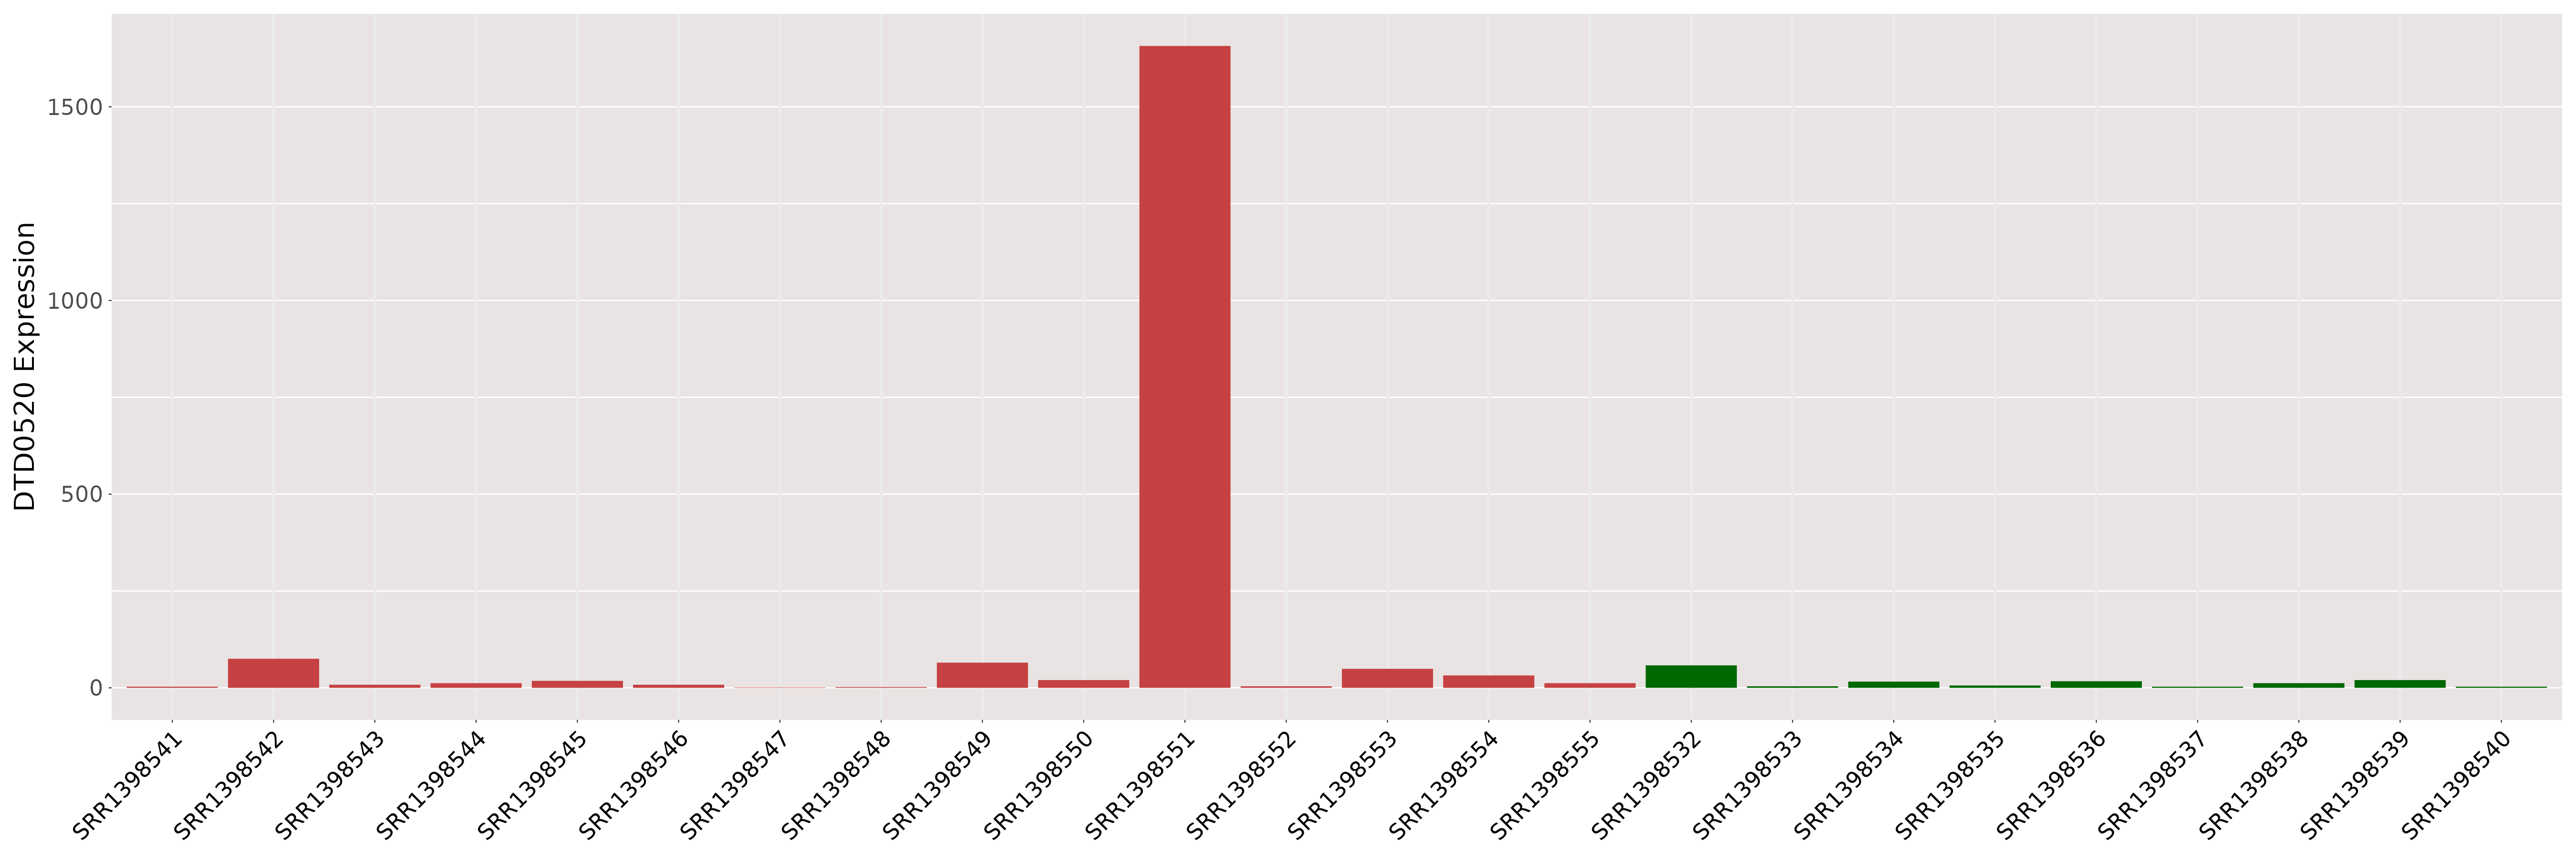
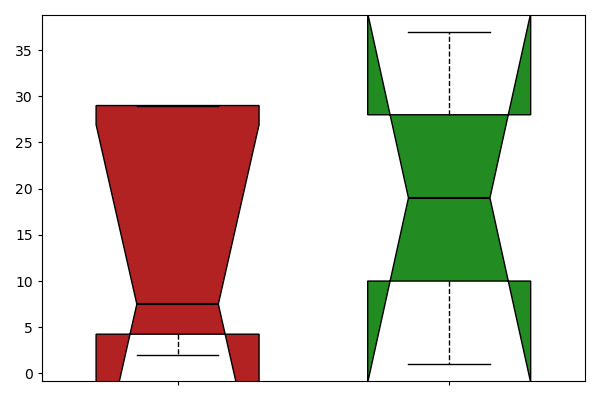
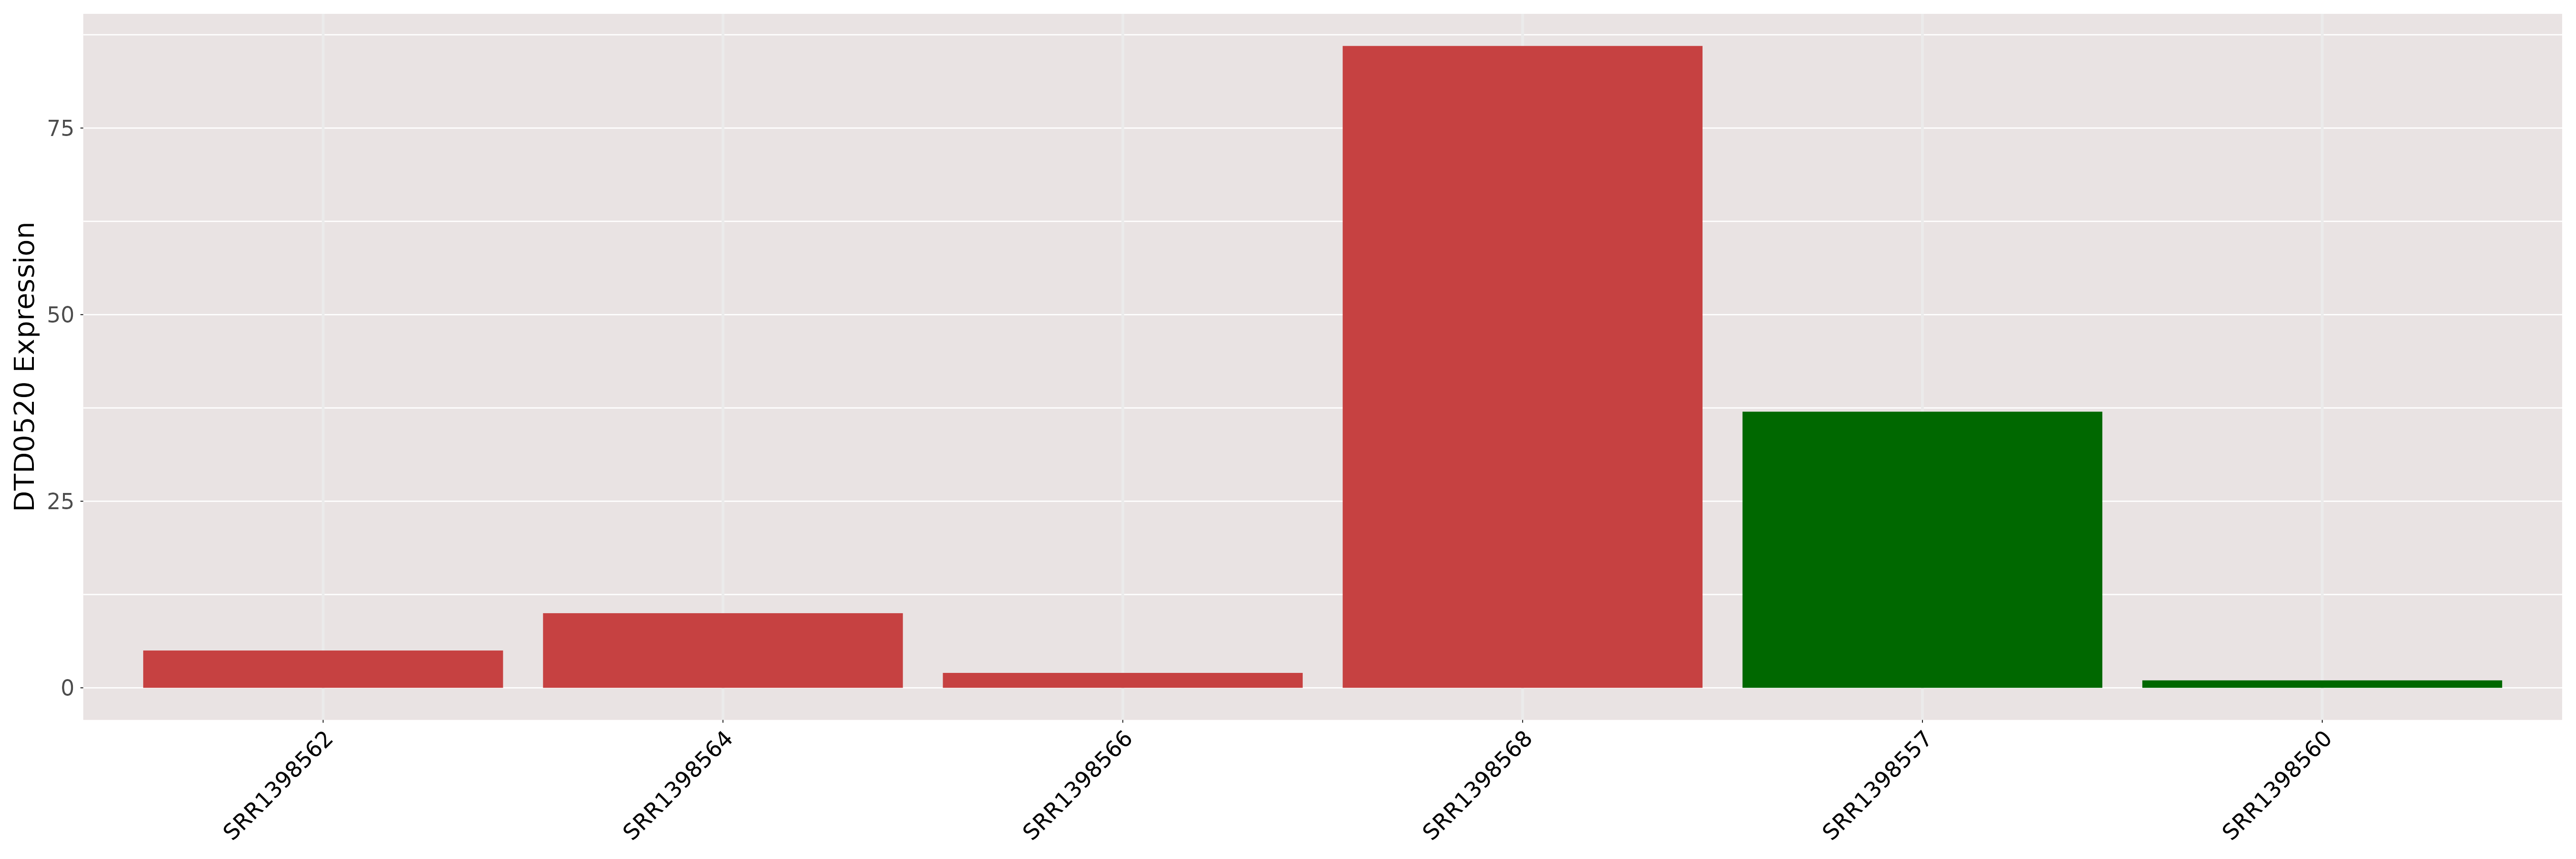
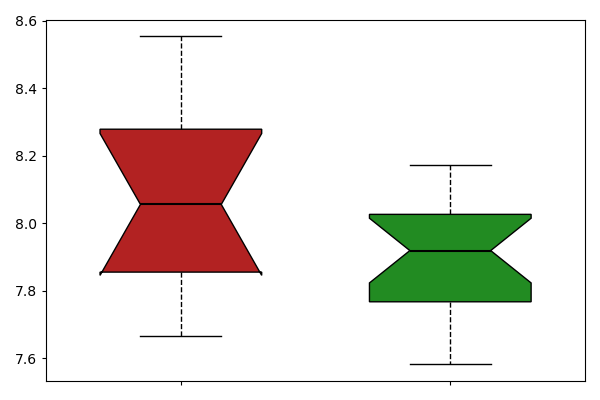
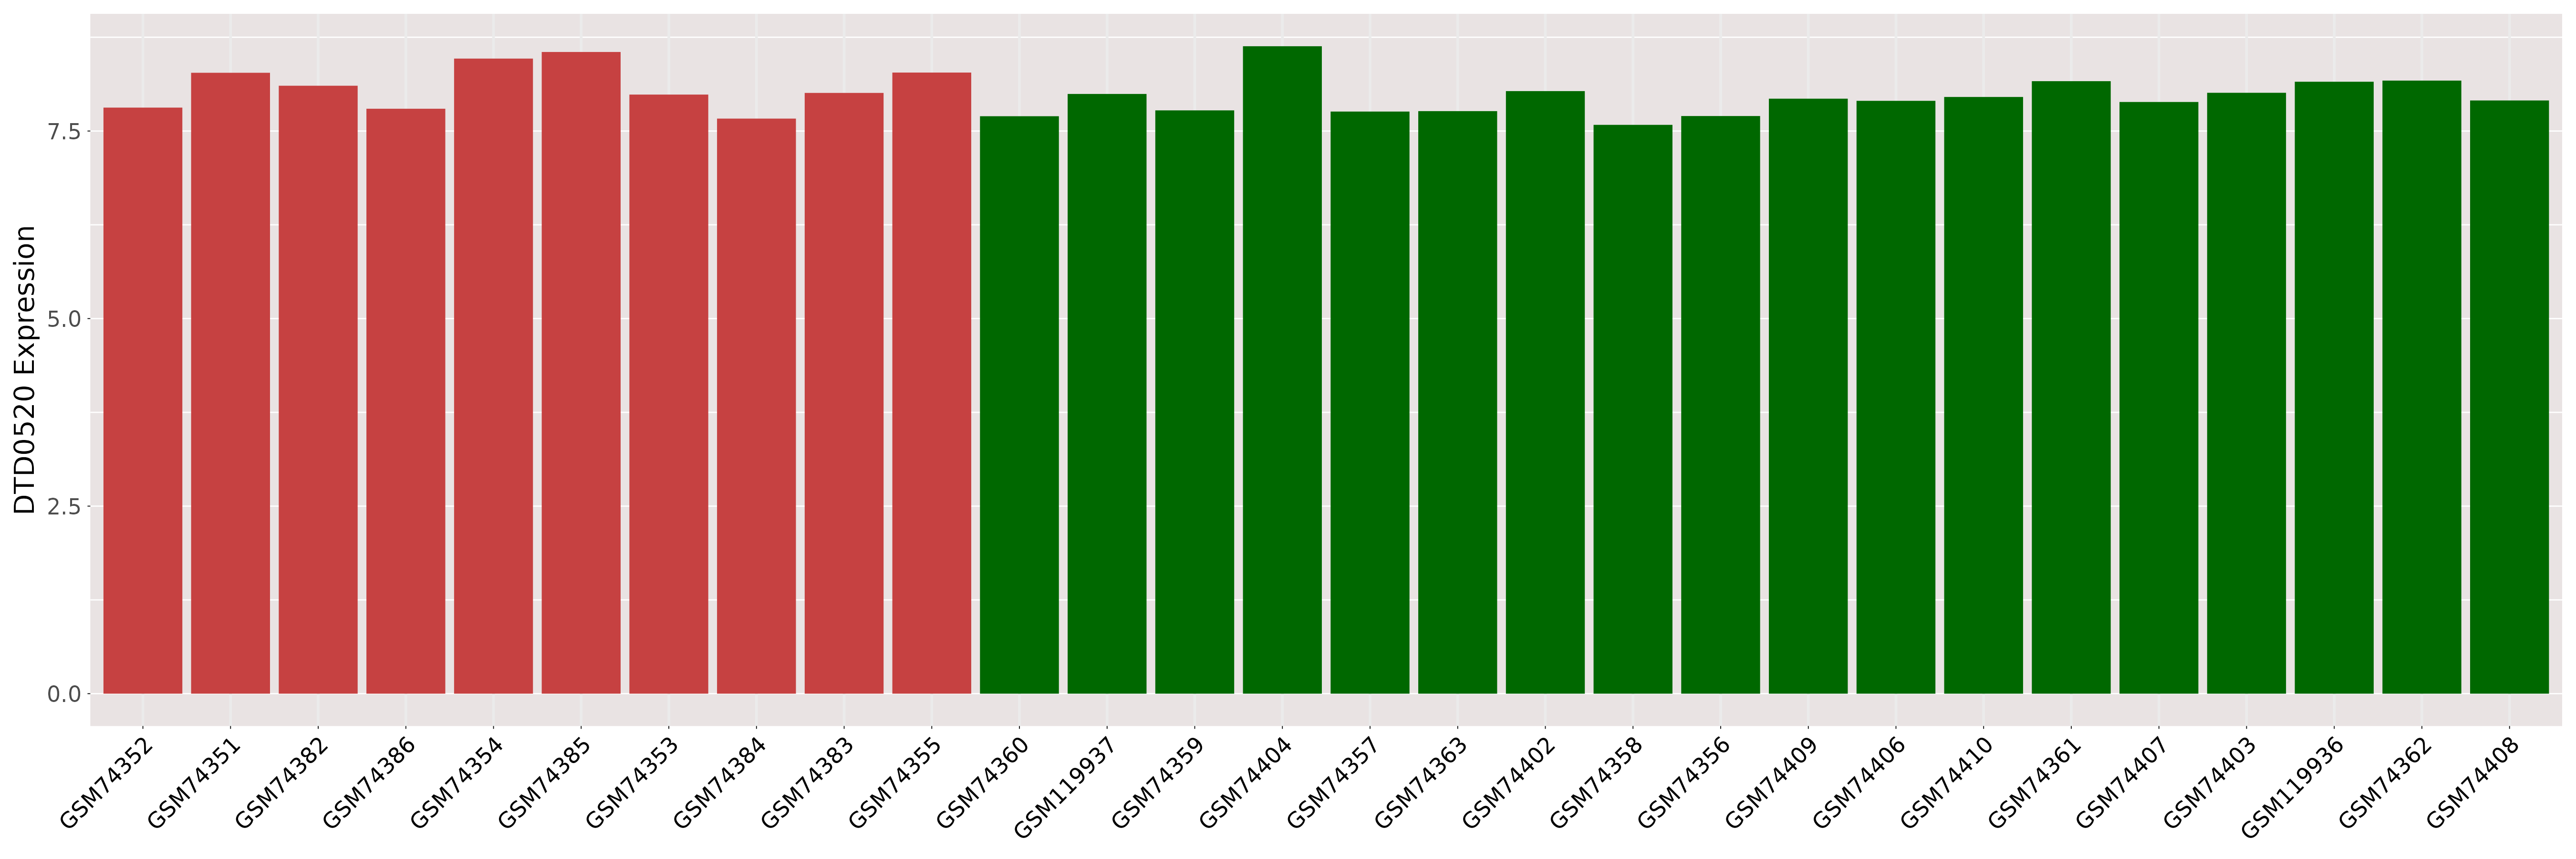
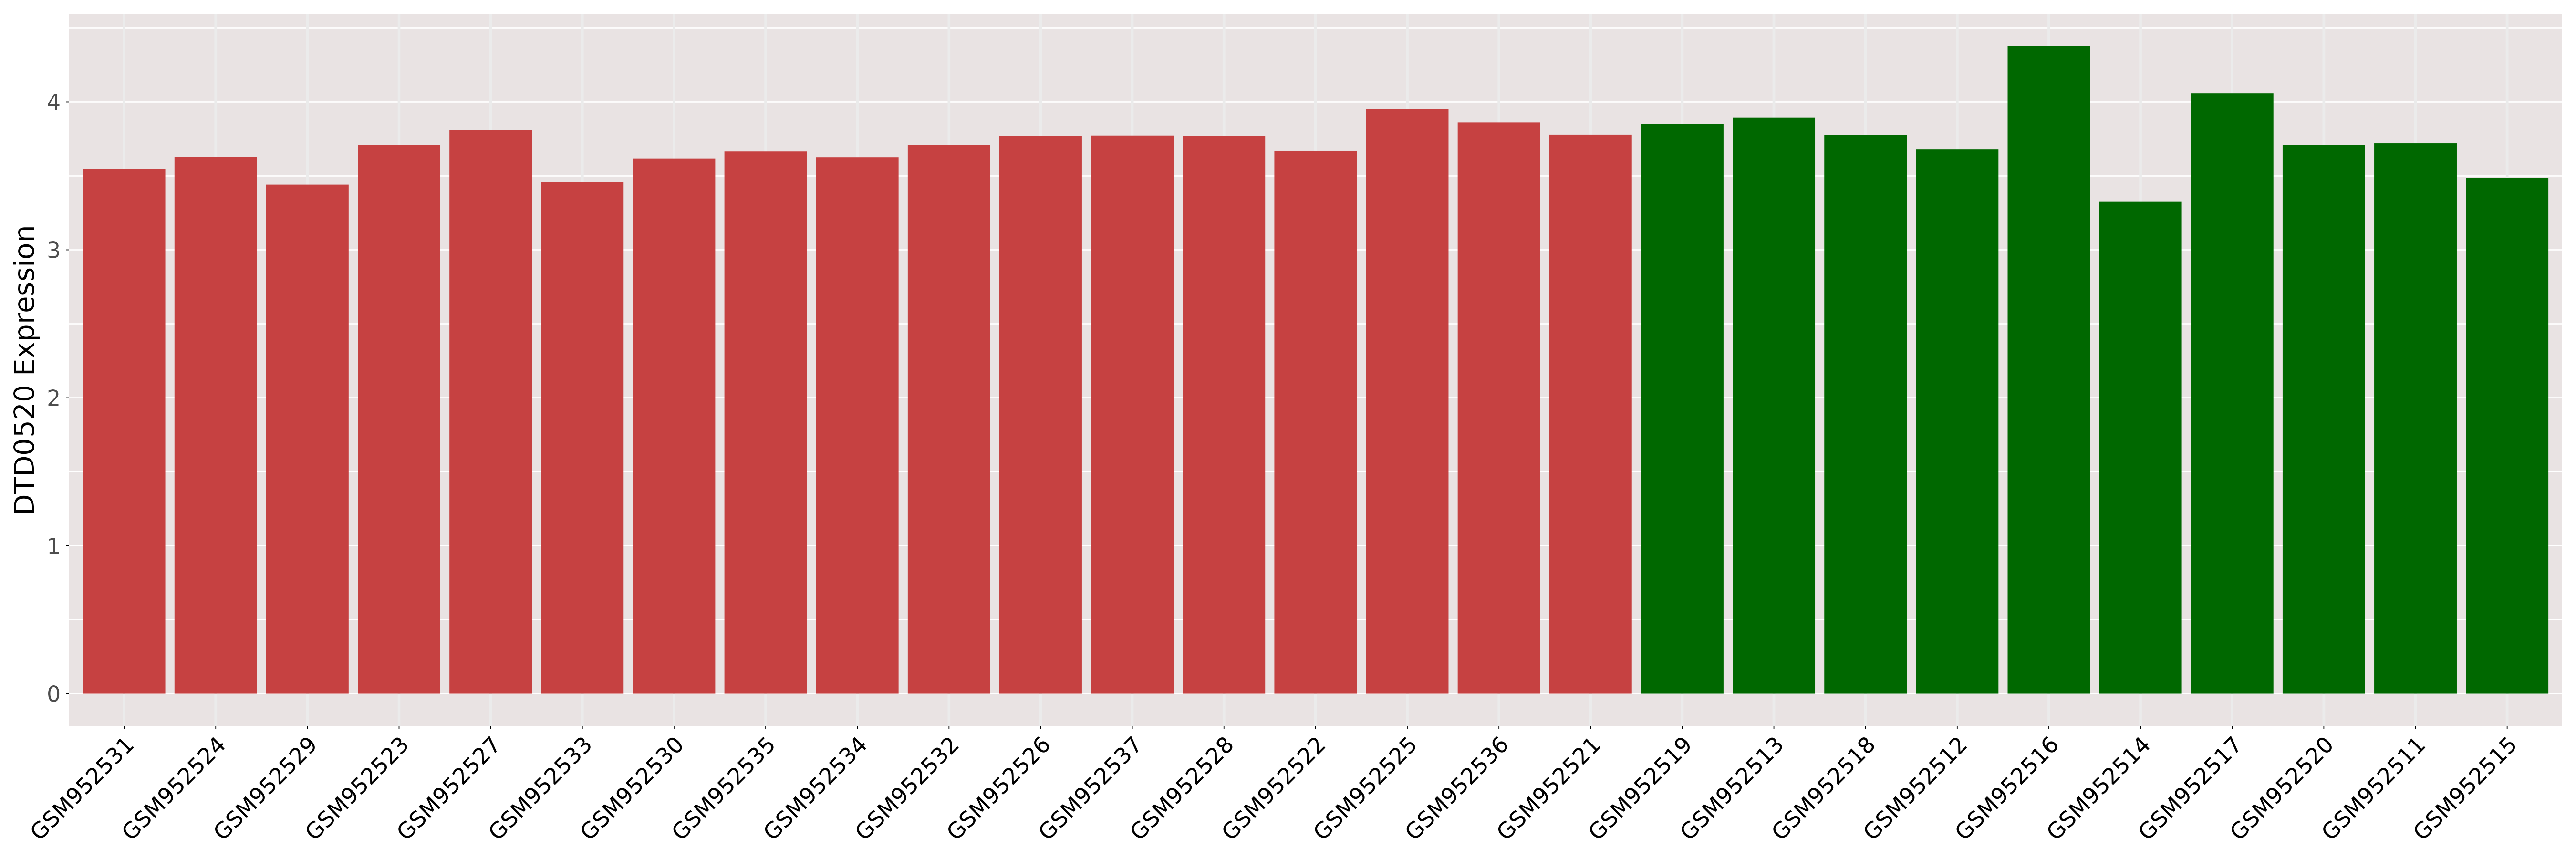
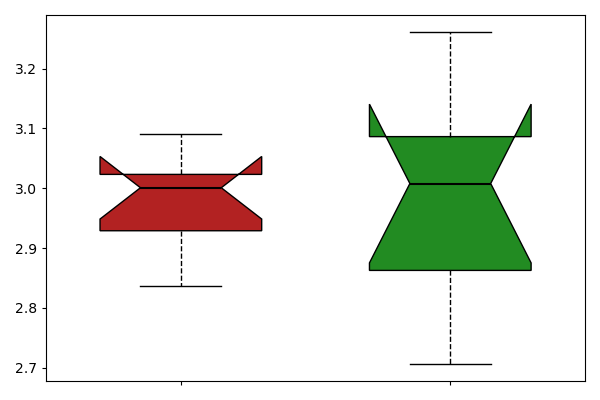
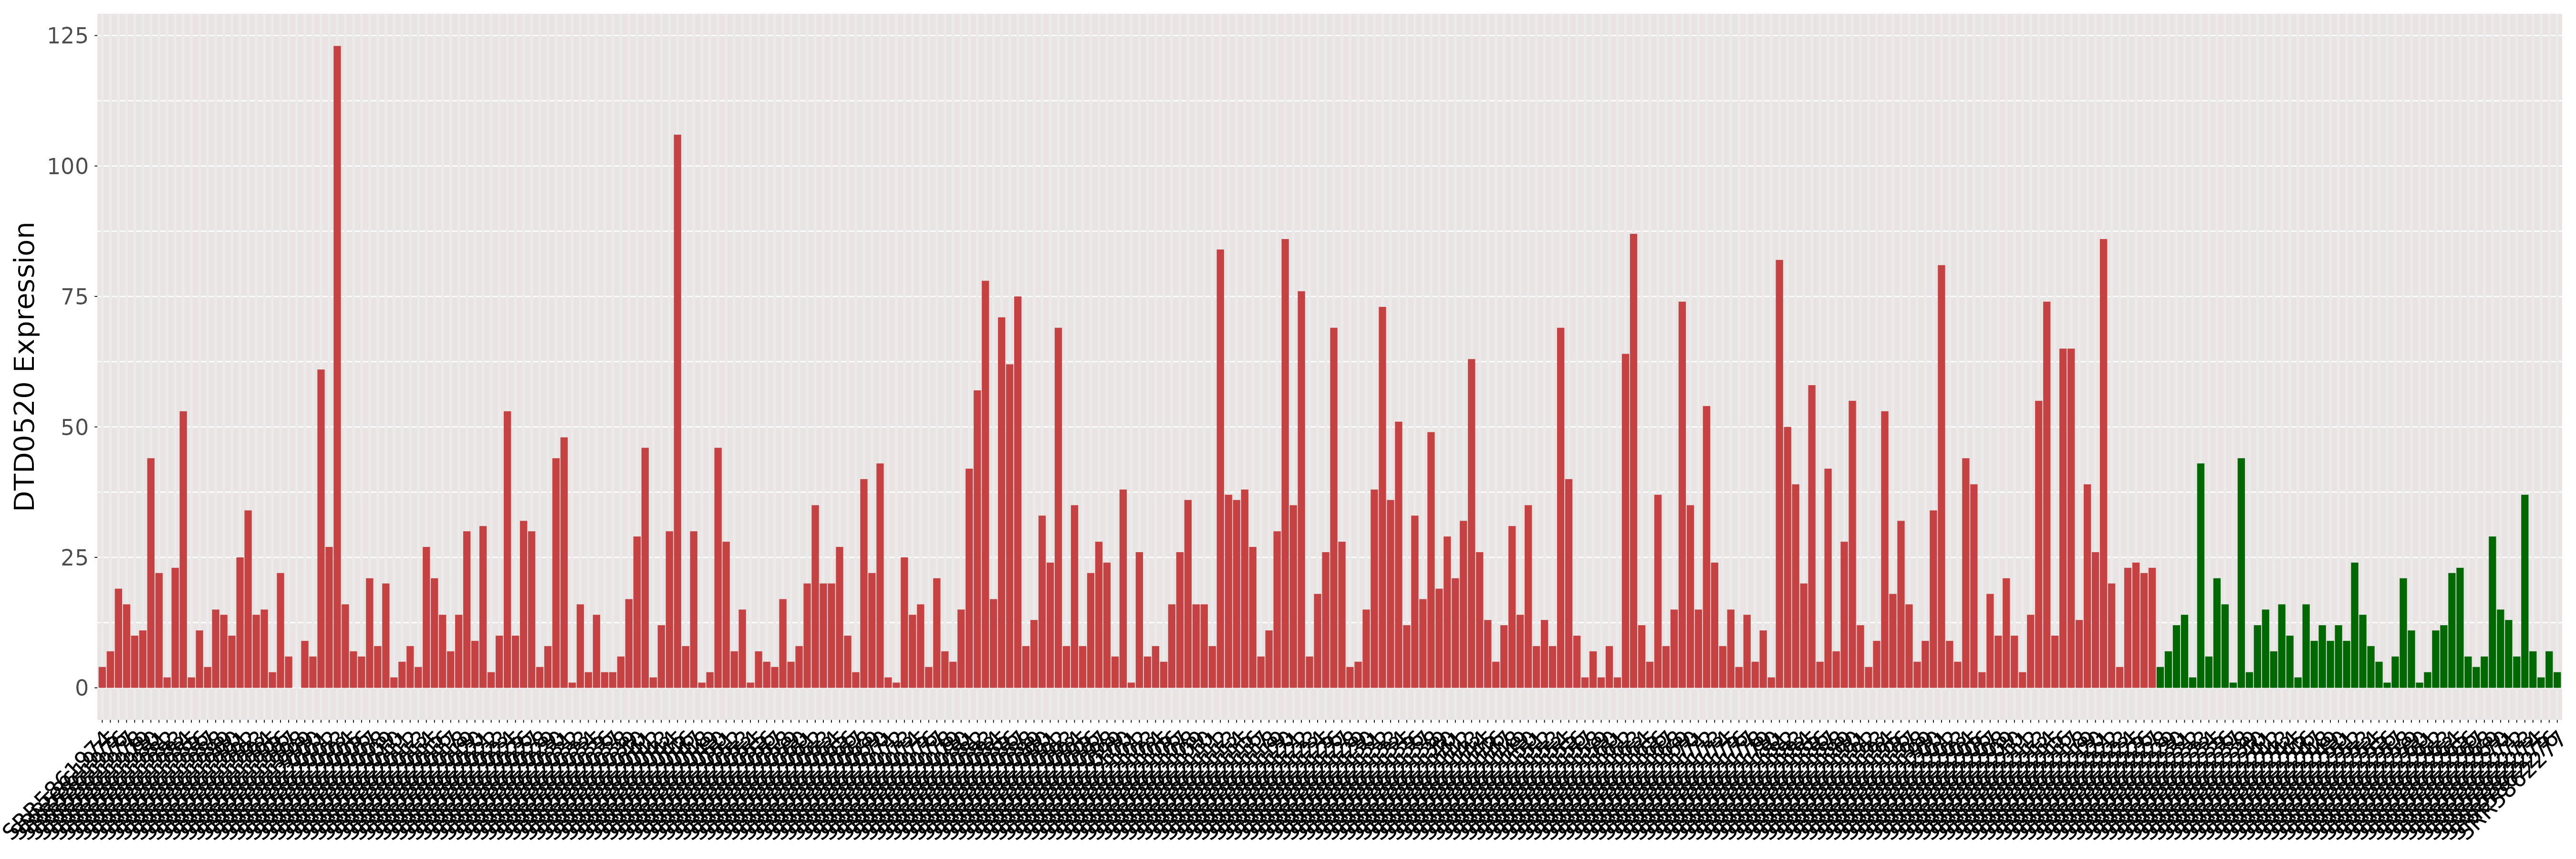
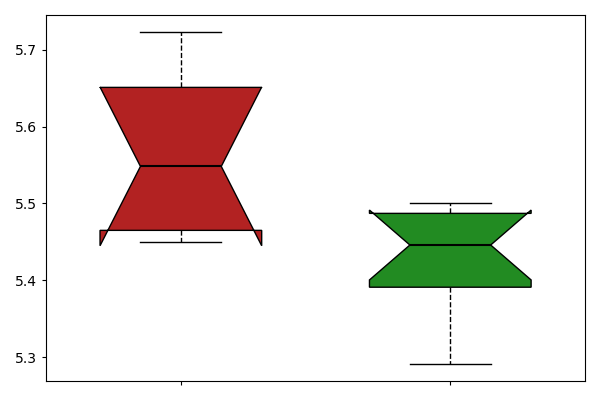
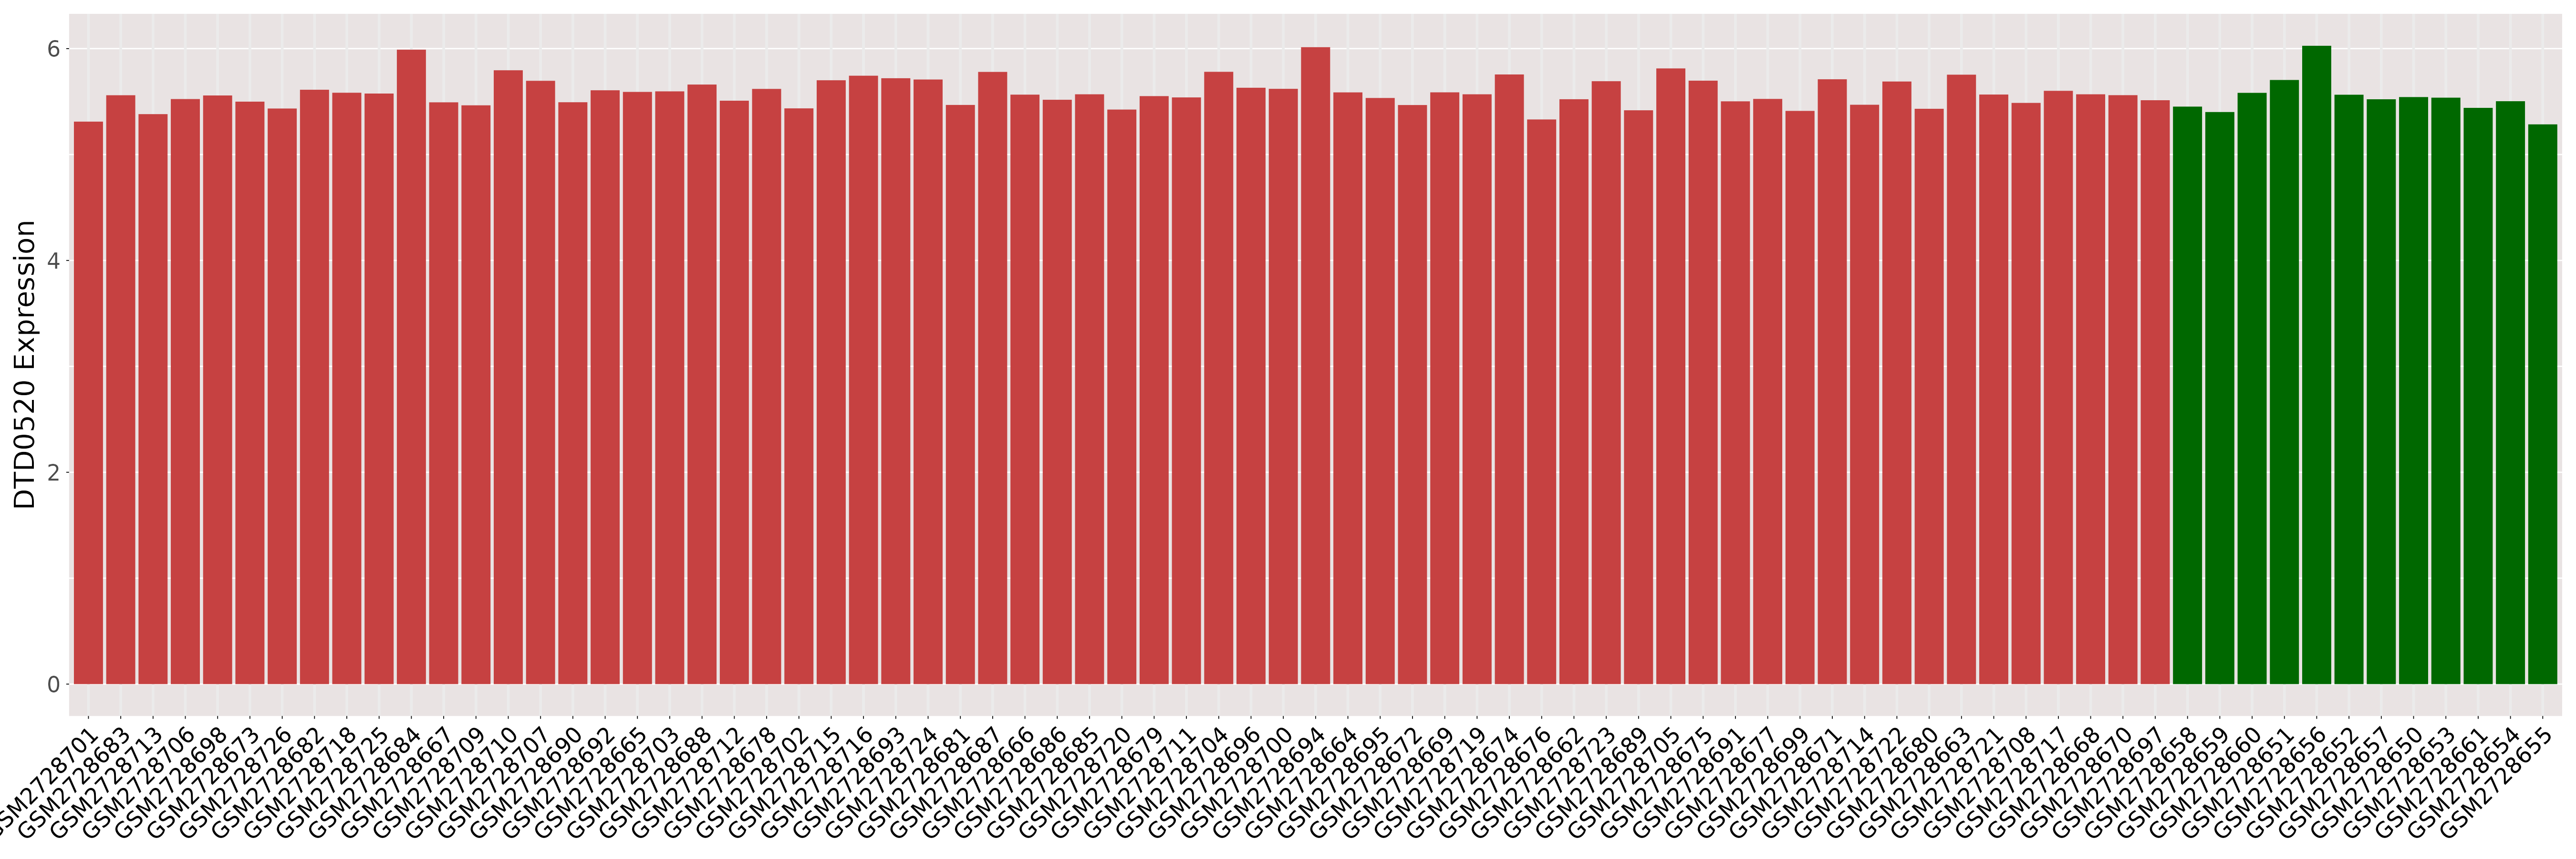
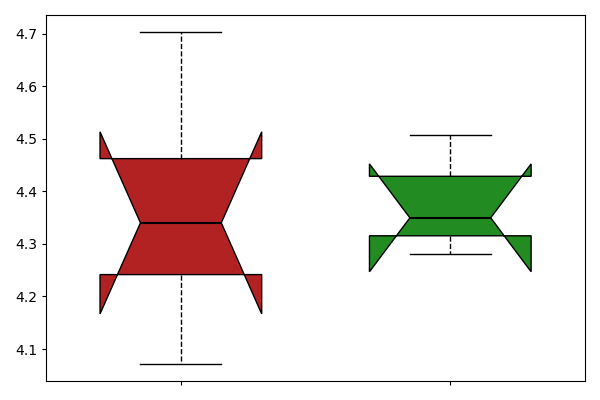
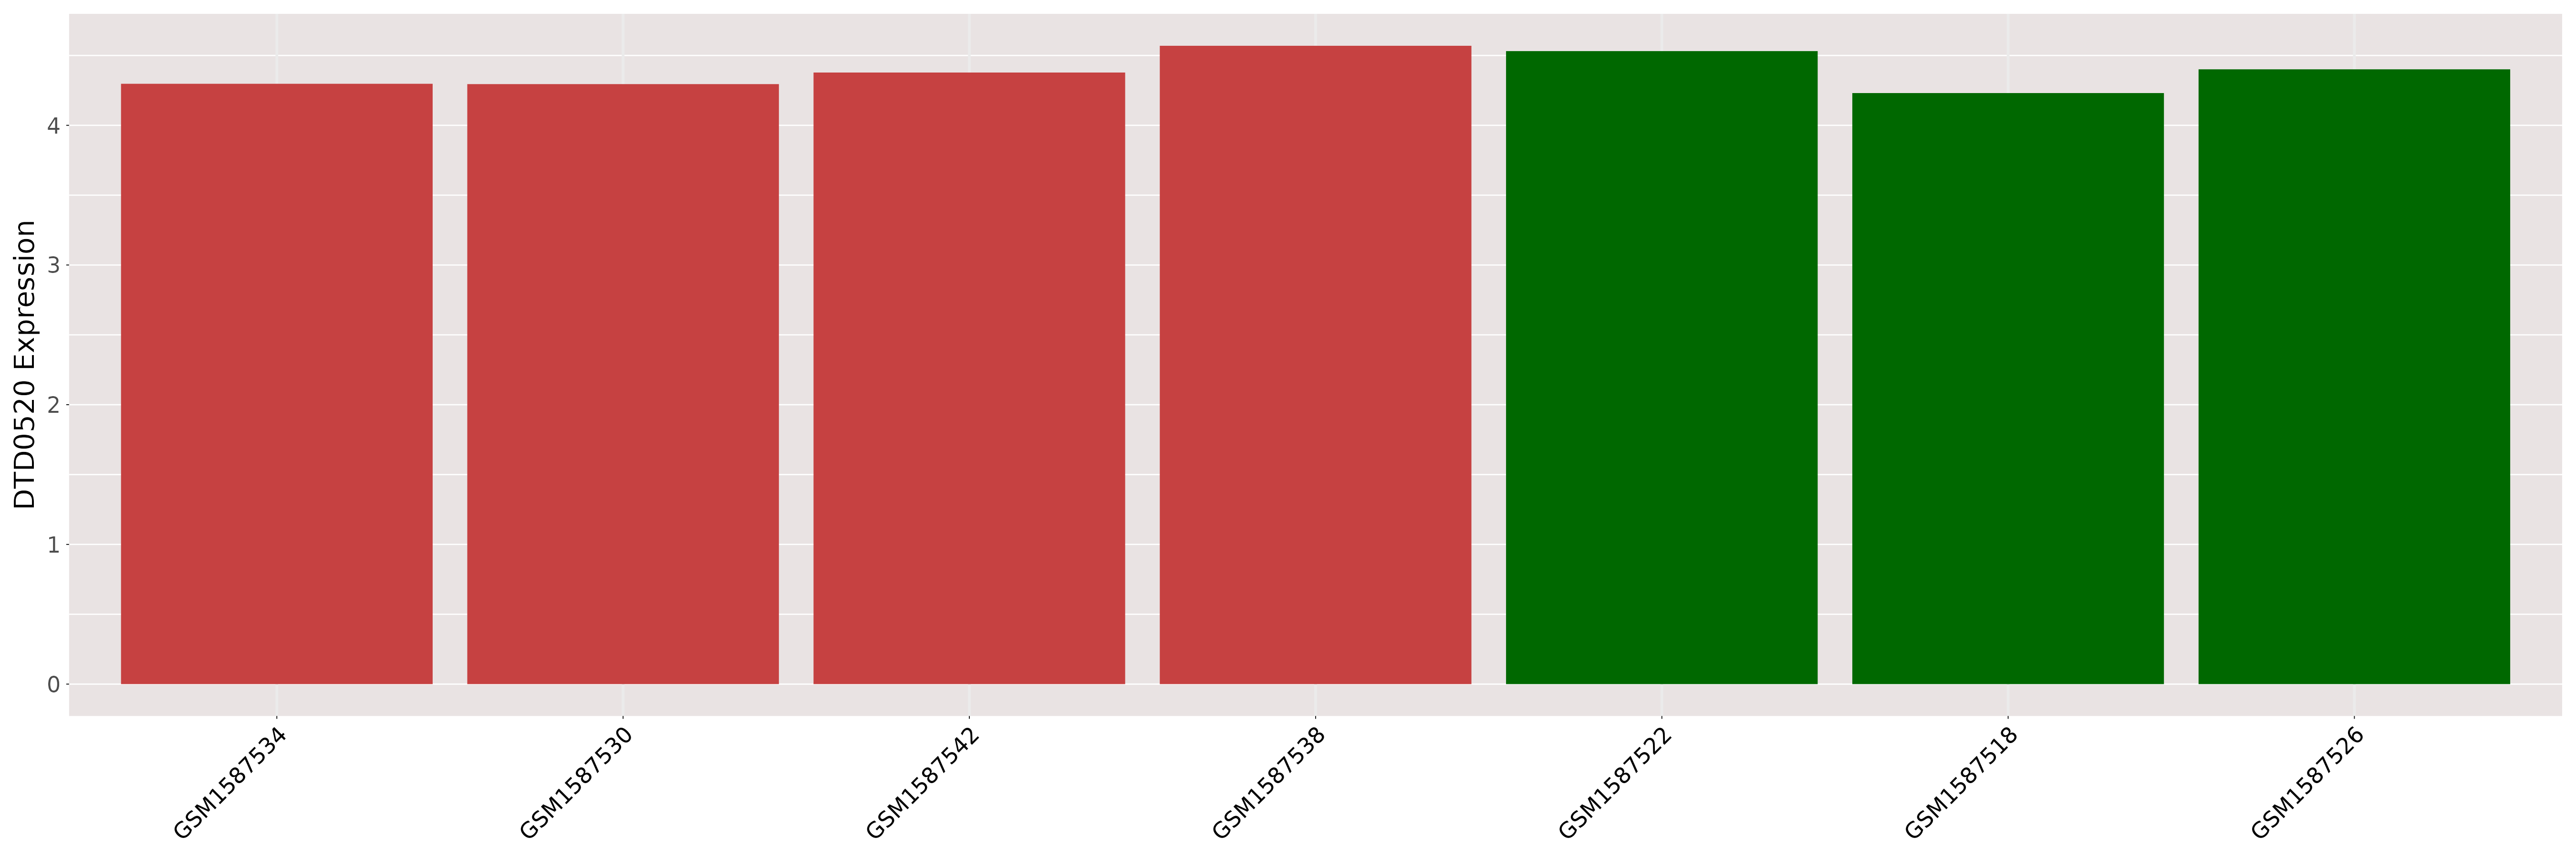
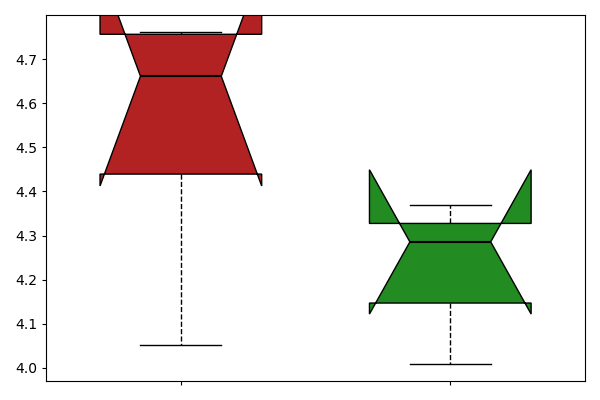
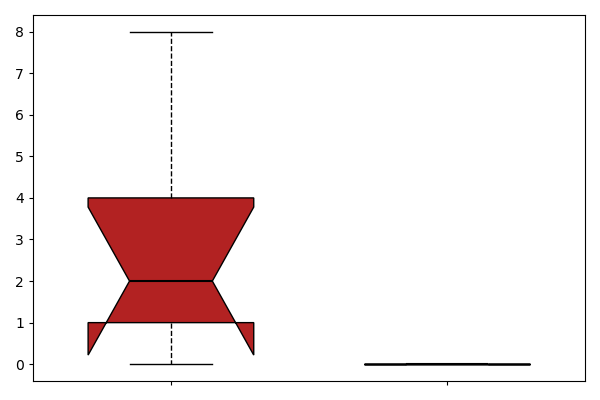
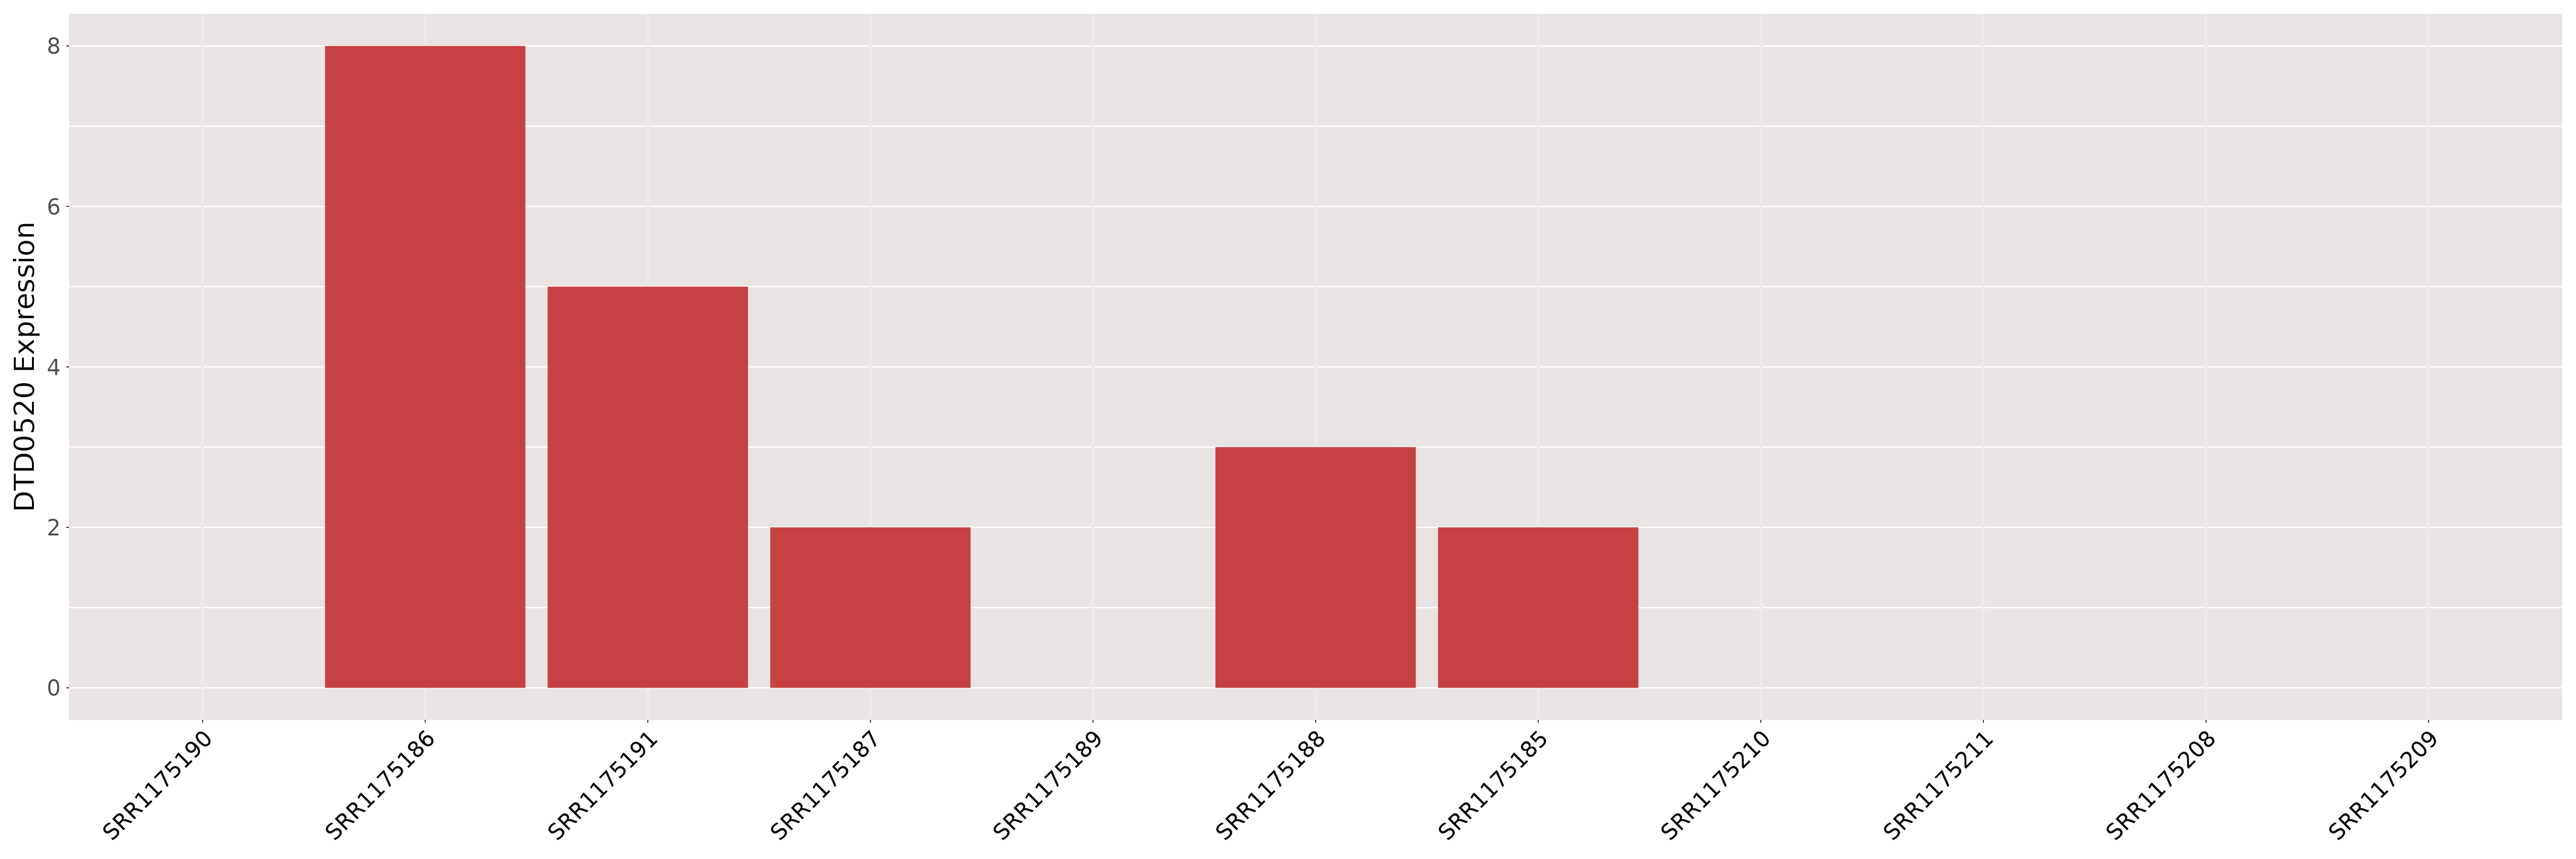
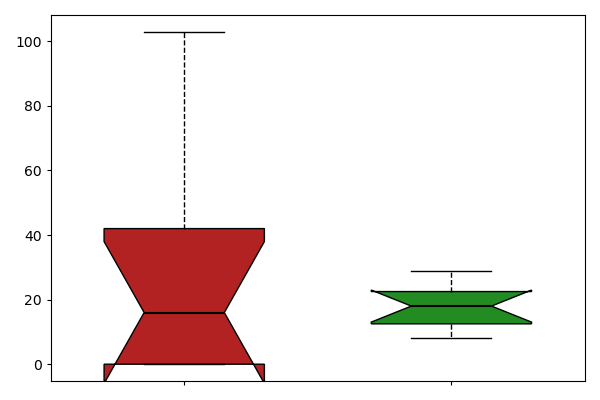
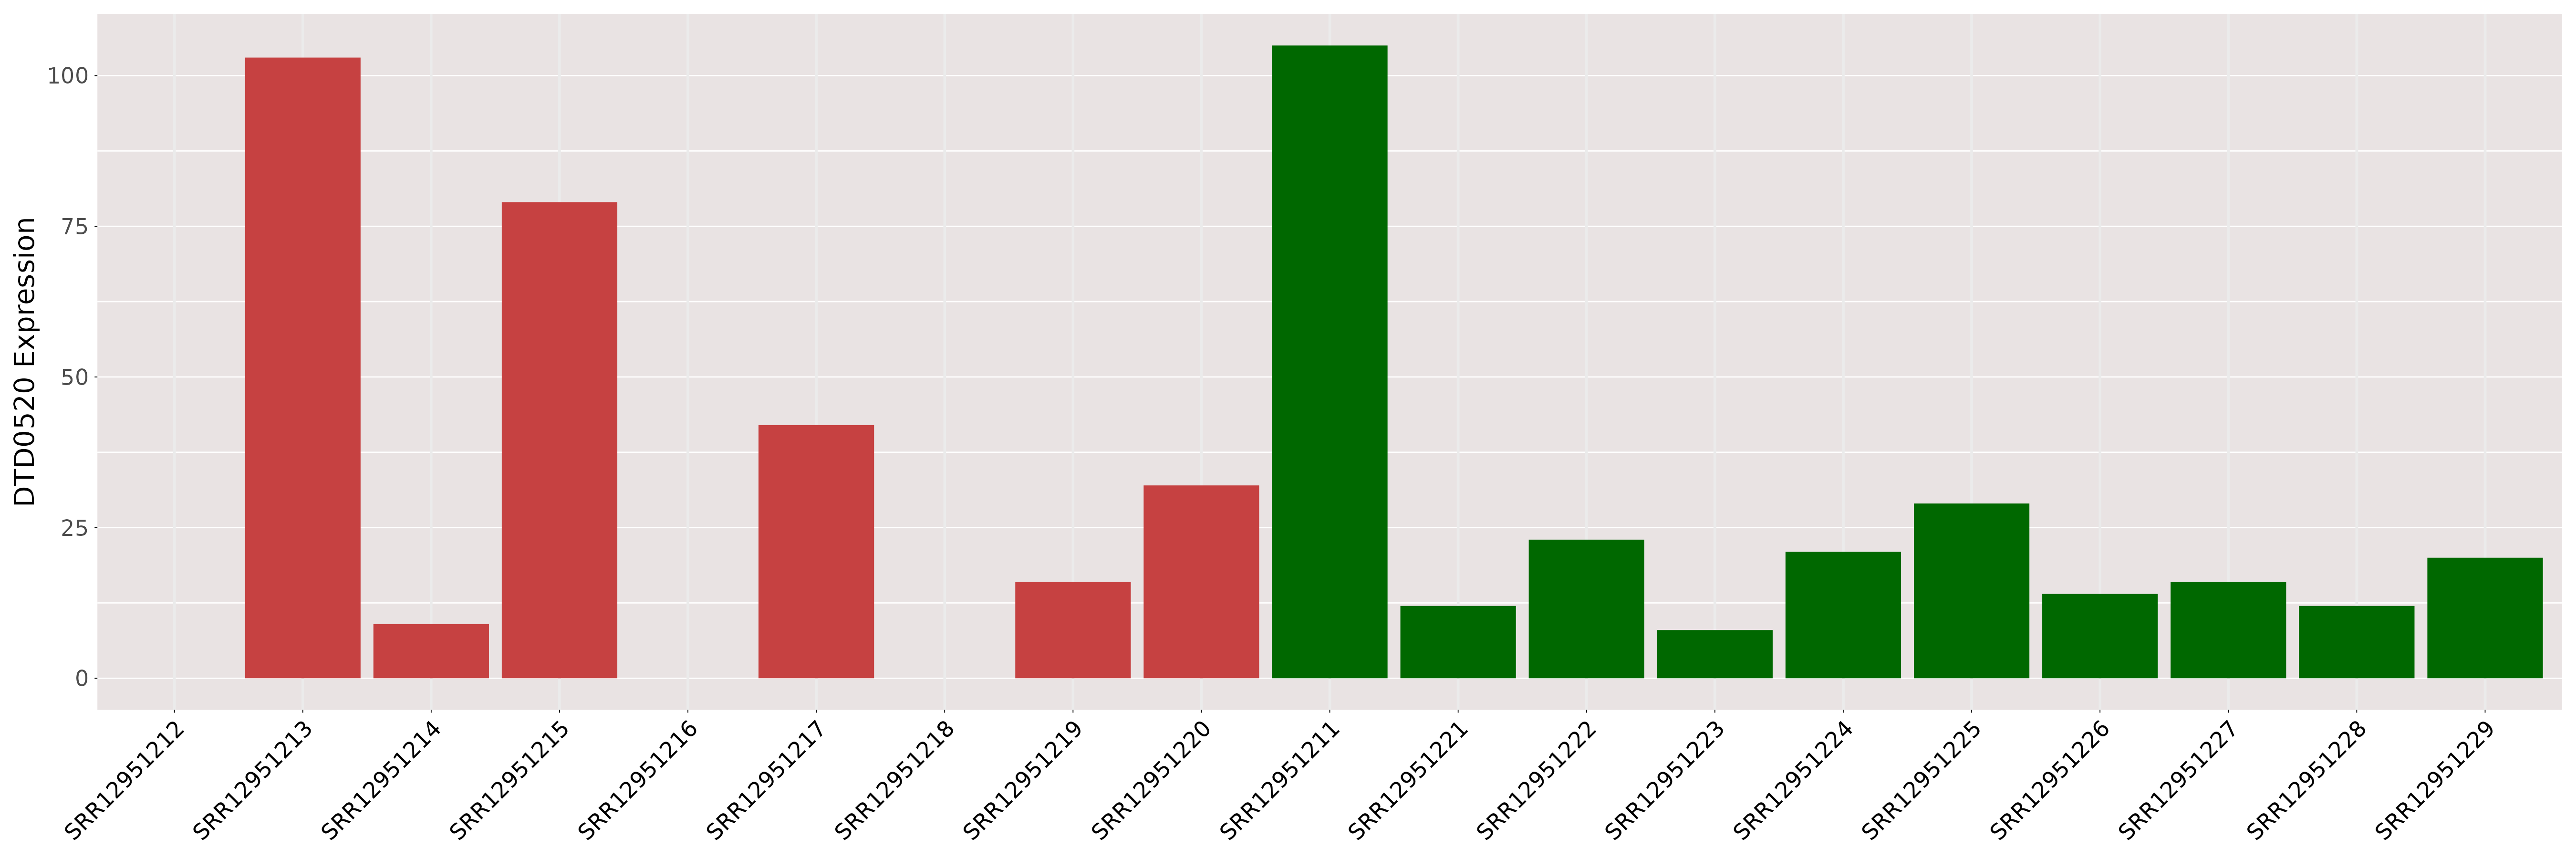
| [+] ICD-11: 2A00.0Y Ependymoma (other specified primary brain neoplasm) | Click to Show/Hide the Full List | ||||
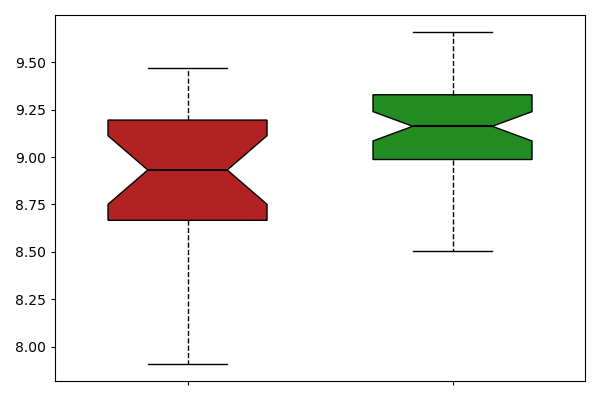
| The Studied Tissue | Brain | ||||
| The Specified Disease | Ependymoma [ICD-11:2A00.0Y] | ||||
| The Expression Level of Disease Section Compare with the Healthy Individual Tissue | p-value:3.672503768619197e-07; Fold-change:0.8105415318291332; Z-score:-2.694475371 | ||||
| DT expression in the diseased tissue of patients
DT expression in the normal tissue of healthy individuals
|
|||||
|
 Please Click the above Thumbnail to View/Download
the Expression Barchart for All Samples Please Click the above Thumbnail to View/Download
the Expression Barchart for All Samples
|
||||
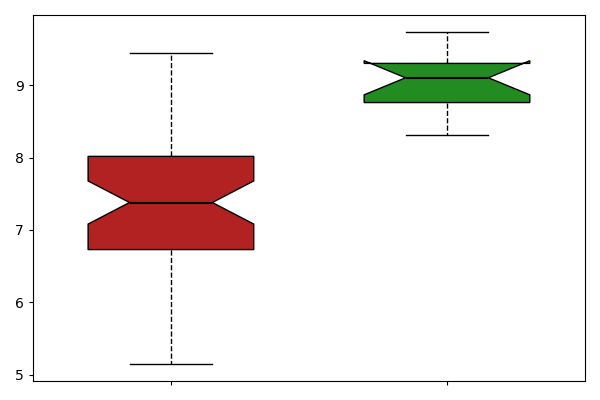
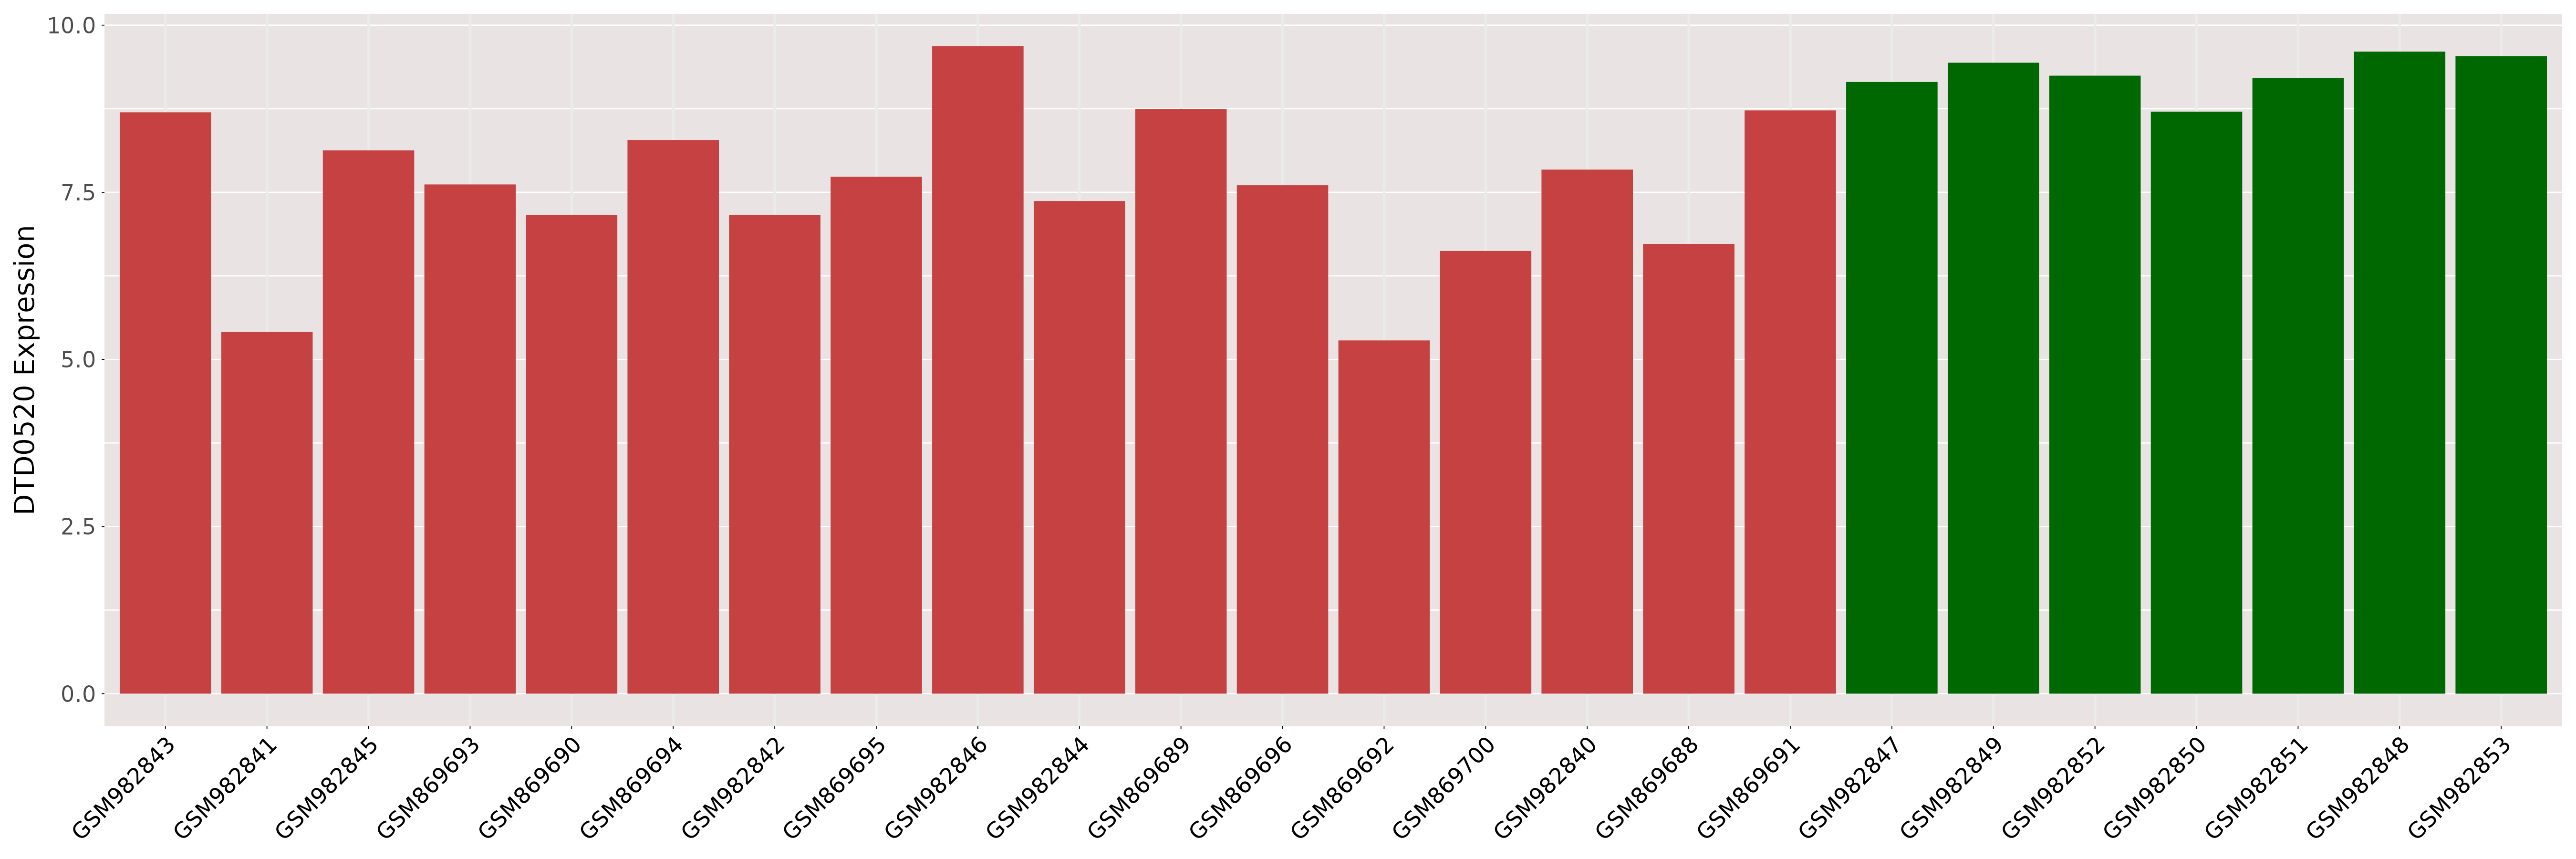
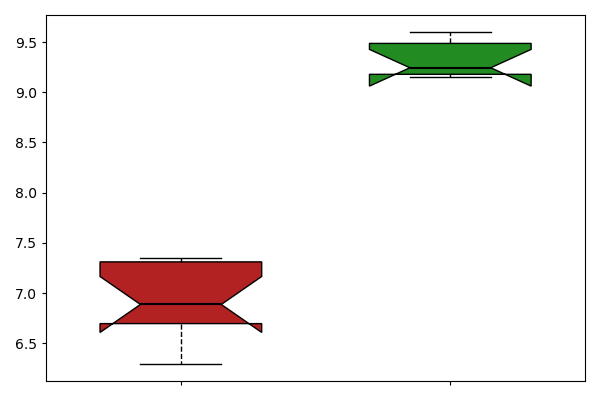
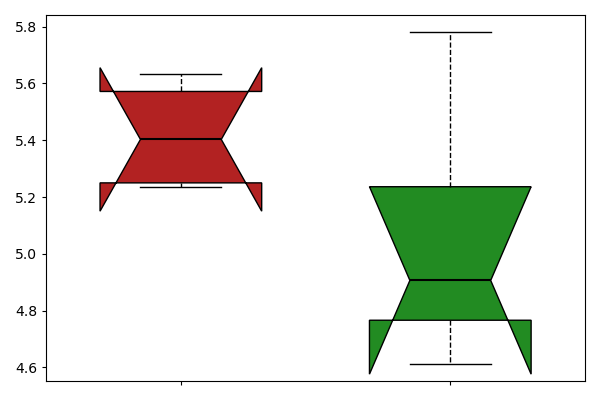
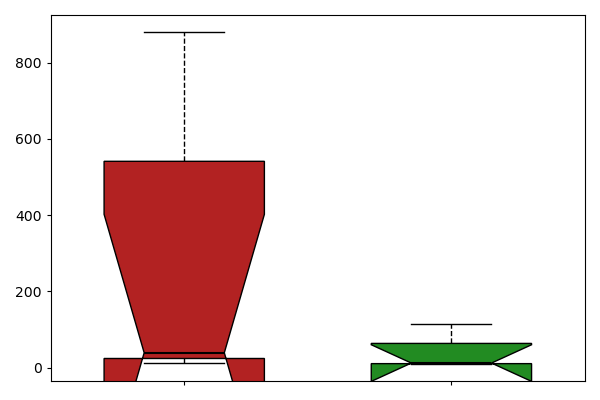
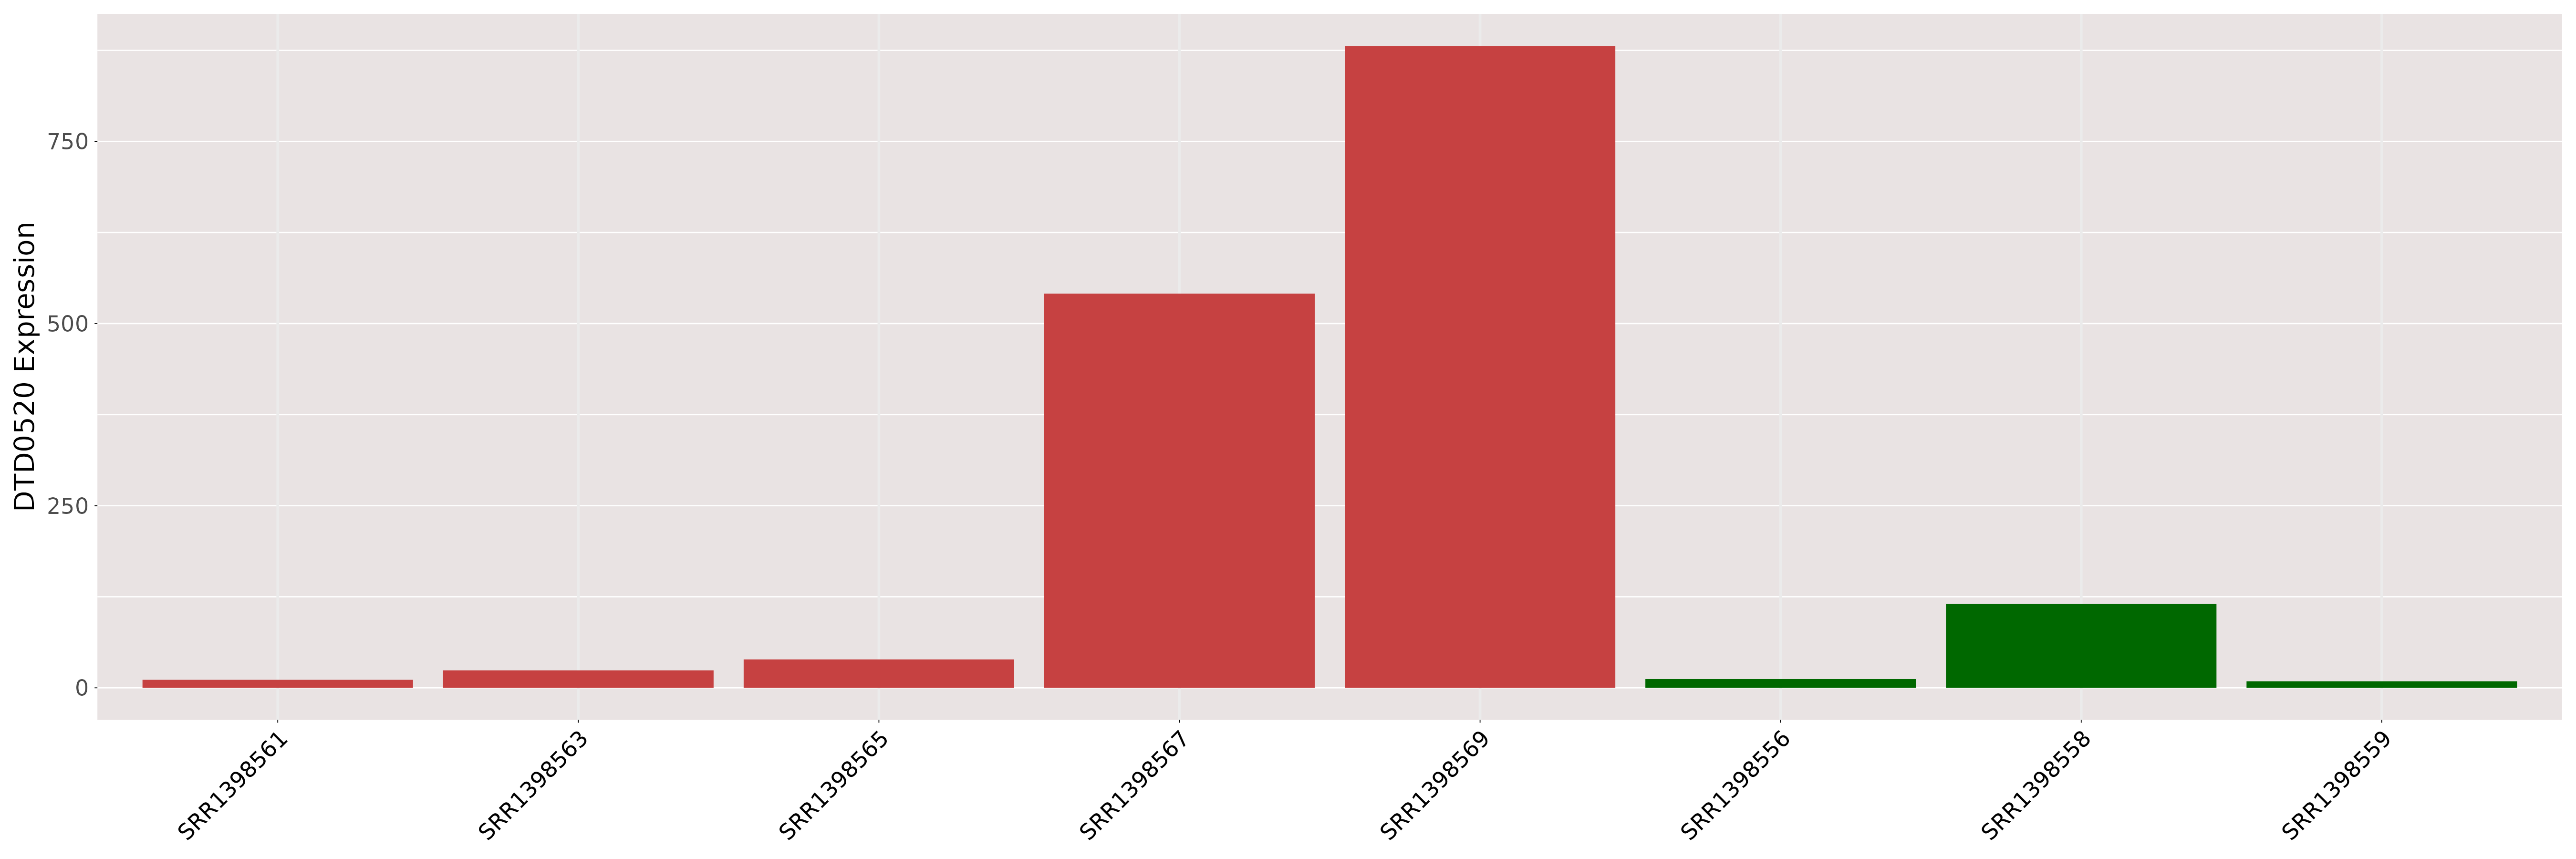
| [+] ICD-11: 2A00.10 Medulloblastoma | Click to Show/Hide the Full List | ||||
| The Studied Tissue | Brain | ||||
| The Specified Disease | Medulloblastoma [ICD-11:2A00.10] | ||||
| The Expression Level of Disease Section Compare with the Healthy Individual Tissue | p-value:0.0010071656147202; Fold-change:0.8240231615081458; Z-score:-5.610050408 | ||||
| DT expression in the diseased tissue of patients
DT expression in the normal tissue of healthy individuals
|
|||||
|
 Please Click the above Thumbnail to View/Download
the Expression Barchart for All Samples Please Click the above Thumbnail to View/Download
the Expression Barchart for All Samples
|
||||
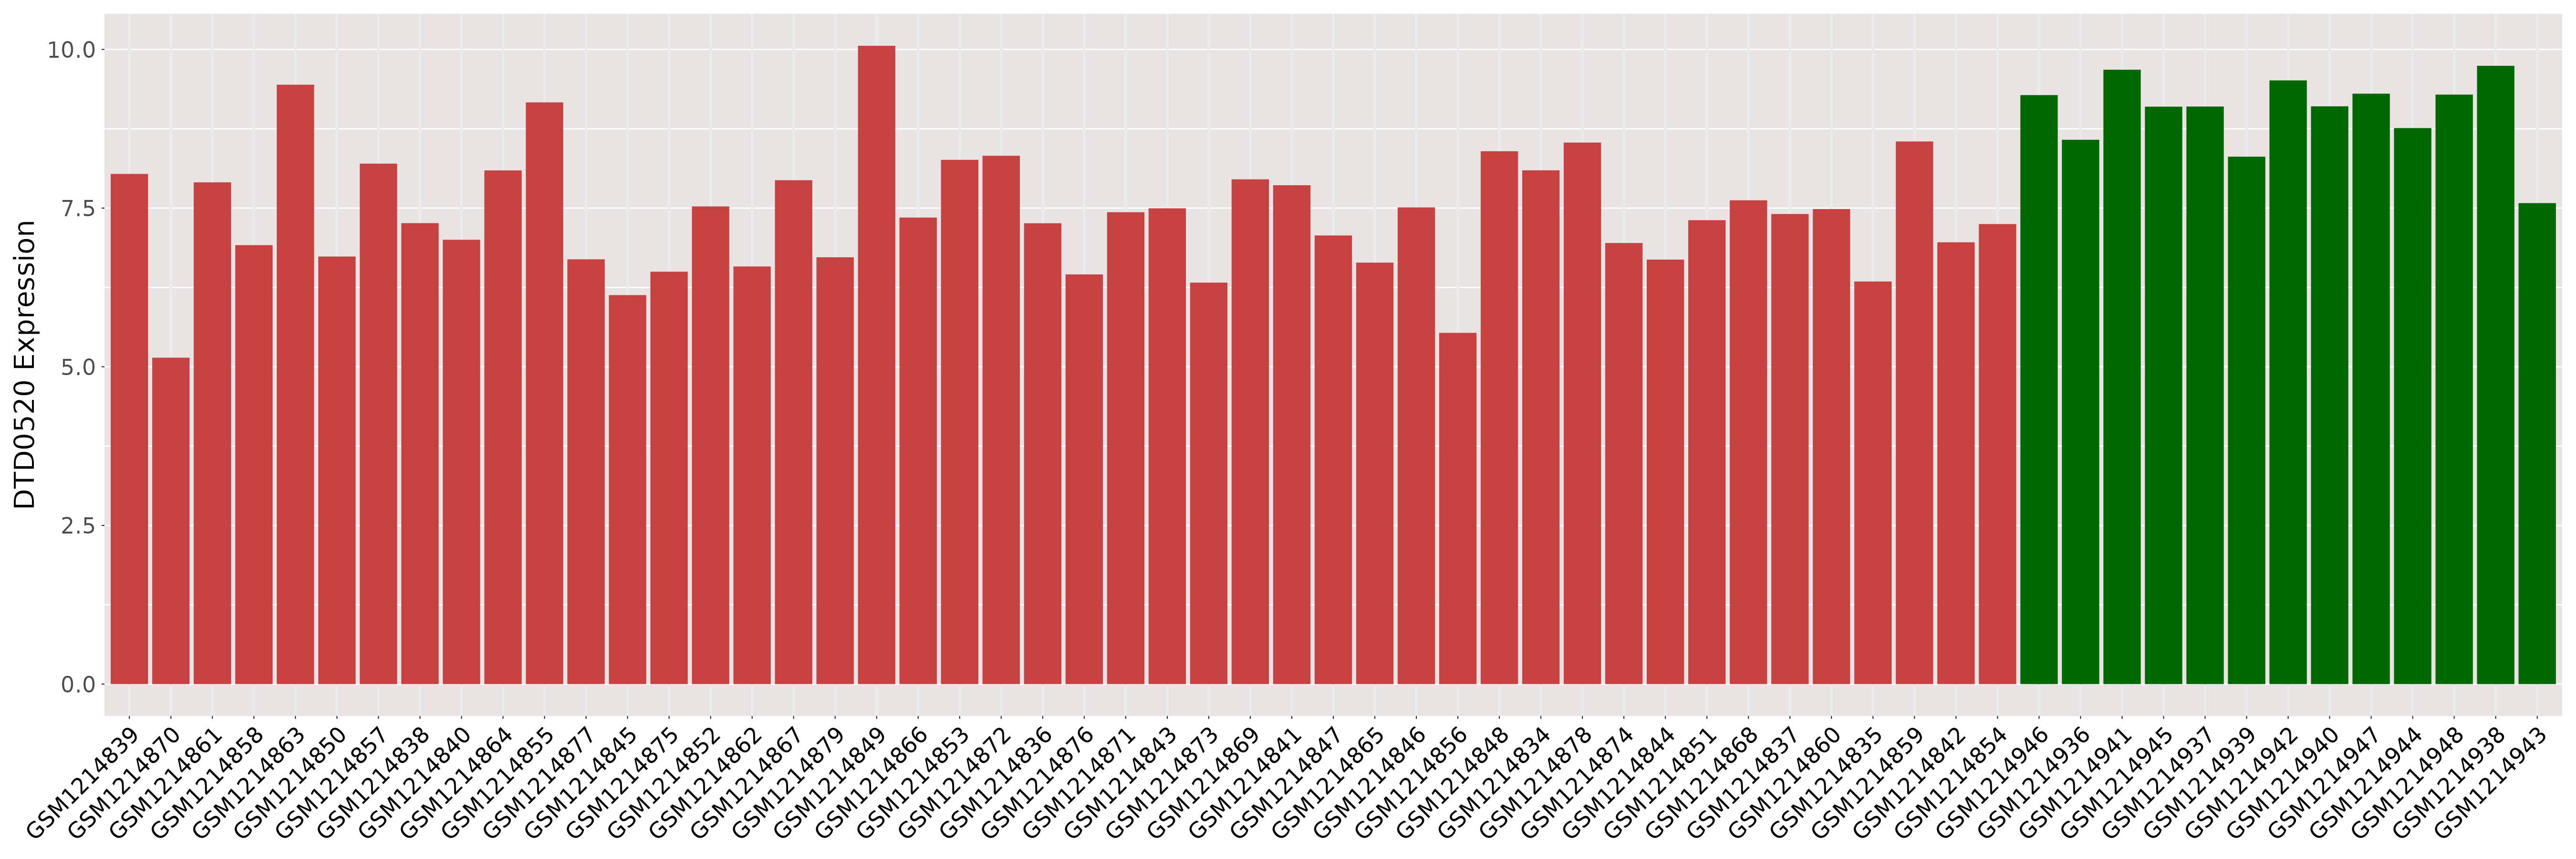
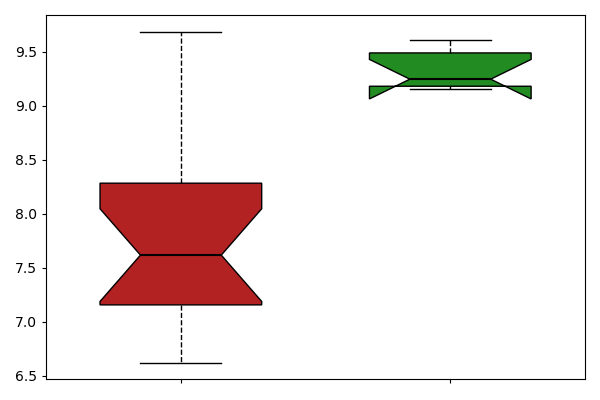
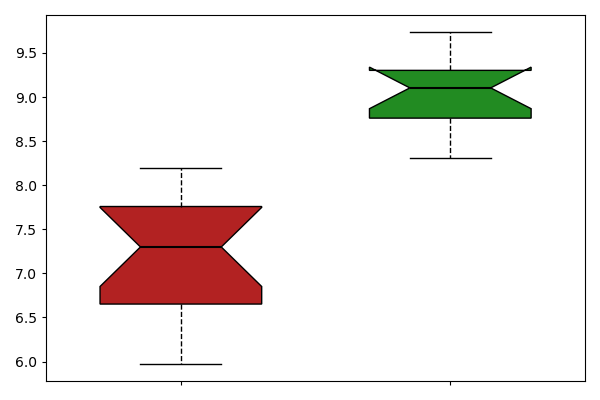
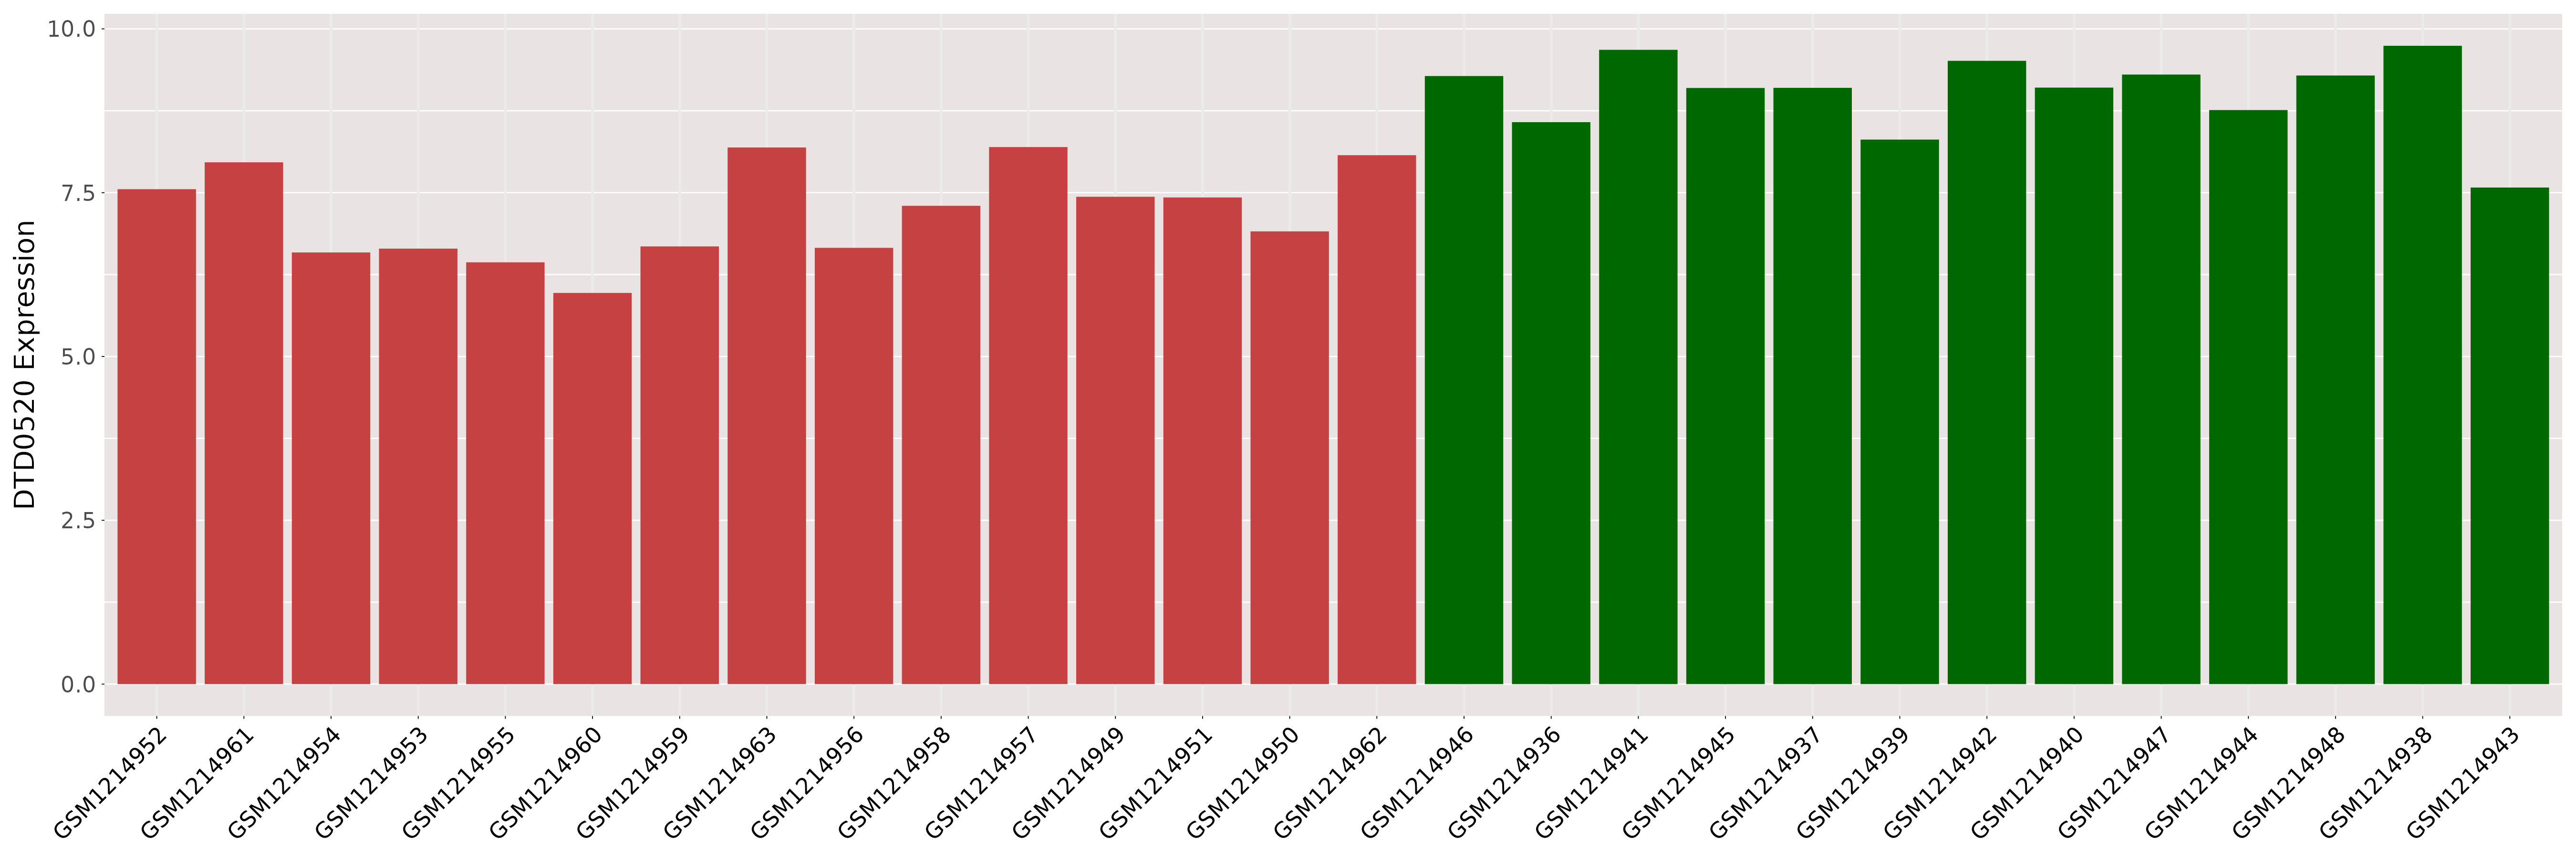
| [+] ICD-11: 2A00.1Y Glioblastoma (other specified malignant neoplasm of brain) | Click to Show/Hide the Full List | ||||
| The Studied Tissue | Brain | ||||
| The Specified Disease | Glioblastoma [ICD-11:2A00.1Y] | ||||
| The Expression Level of Disease Section Compare with the Healthy Individual Tissue | p-value:1.5243291395630798e-07; Fold-change:0.7449549685666231; Z-score:-7.230488713 | ||||
| DT expression in the diseased tissue of patients
DT expression in the normal tissue of healthy individuals
|
|||||
|
 Please Click the above Thumbnail to View/Download
the Expression Barchart for All Samples Please Click the above Thumbnail to View/Download
the Expression Barchart for All Samples
|
||||
| [+] ICD-11: 2A00.1Y Large-cell medulloblastoma | Click to Show/Hide the Full List | ||||
| The Studied Tissue | Brain | ||||
| The Specified Disease | Medulloblastoma, large cell [ICD-11:2A00.10] | ||||
| The Expression Level of Disease Section Compare with the Healthy Individual Tissue | p-value:0.0041249719318787; Fold-change:0.7796810556383503; Z-score:-5.627392776 | ||||
| DT expression in the diseased tissue of patients
DT expression in the normal tissue of healthy individuals
|
|||||
|
 Please Click the above Thumbnail to View/Download
the Expression Barchart for All Samples Please Click the above Thumbnail to View/Download
the Expression Barchart for All Samples
|
||||
| [+] ICD-11: 2A00.1Y Primitive neuroectodermal tumor (PNET) | Click to Show/Hide the Full List | ||||
| The Studied Tissue | Brain | ||||
| The Specified Disease | Primitive neuroectodermal tumor [ICD-11:2A00.Y] | ||||
| The Expression Level of Disease Section Compare with the Healthy Individual Tissue | p-value:0.5773343617359386; Fold-change:0.9806180228791564; Z-score:-1.460018171 | ||||
| DT expression in the diseased tissue of patients
DT expression in the normal tissue of healthy individuals
|
|||||
|
 Please Click the above Thumbnail to View/Download
the Expression Barchart for All Samples Please Click the above Thumbnail to View/Download
the Expression Barchart for All Samples
|
||||
| [+] ICD-11: 2A82.0 Chronic lymphocytic leukaemia of B-cell type | Click to Show/Hide the Full List | ||||
| The Studied Tissue | Blood | ||||
| The Specified Disease | Cll [ICD-11:2A82.00] | ||||
| The Expression Level of Disease Section Compare with the Healthy Individual Tissue | p-value:0.3705330820315957; Fold-change:0.9990990429558688; Z-score:-0.207978547 | ||||
| DT expression in the diseased tissue of patients
DT expression in the normal tissue of healthy individuals
|
|||||
|
 Please Click the above Thumbnail to View/Download
the Expression Barchart for All Samples Please Click the above Thumbnail to View/Download
the Expression Barchart for All Samples
|
||||
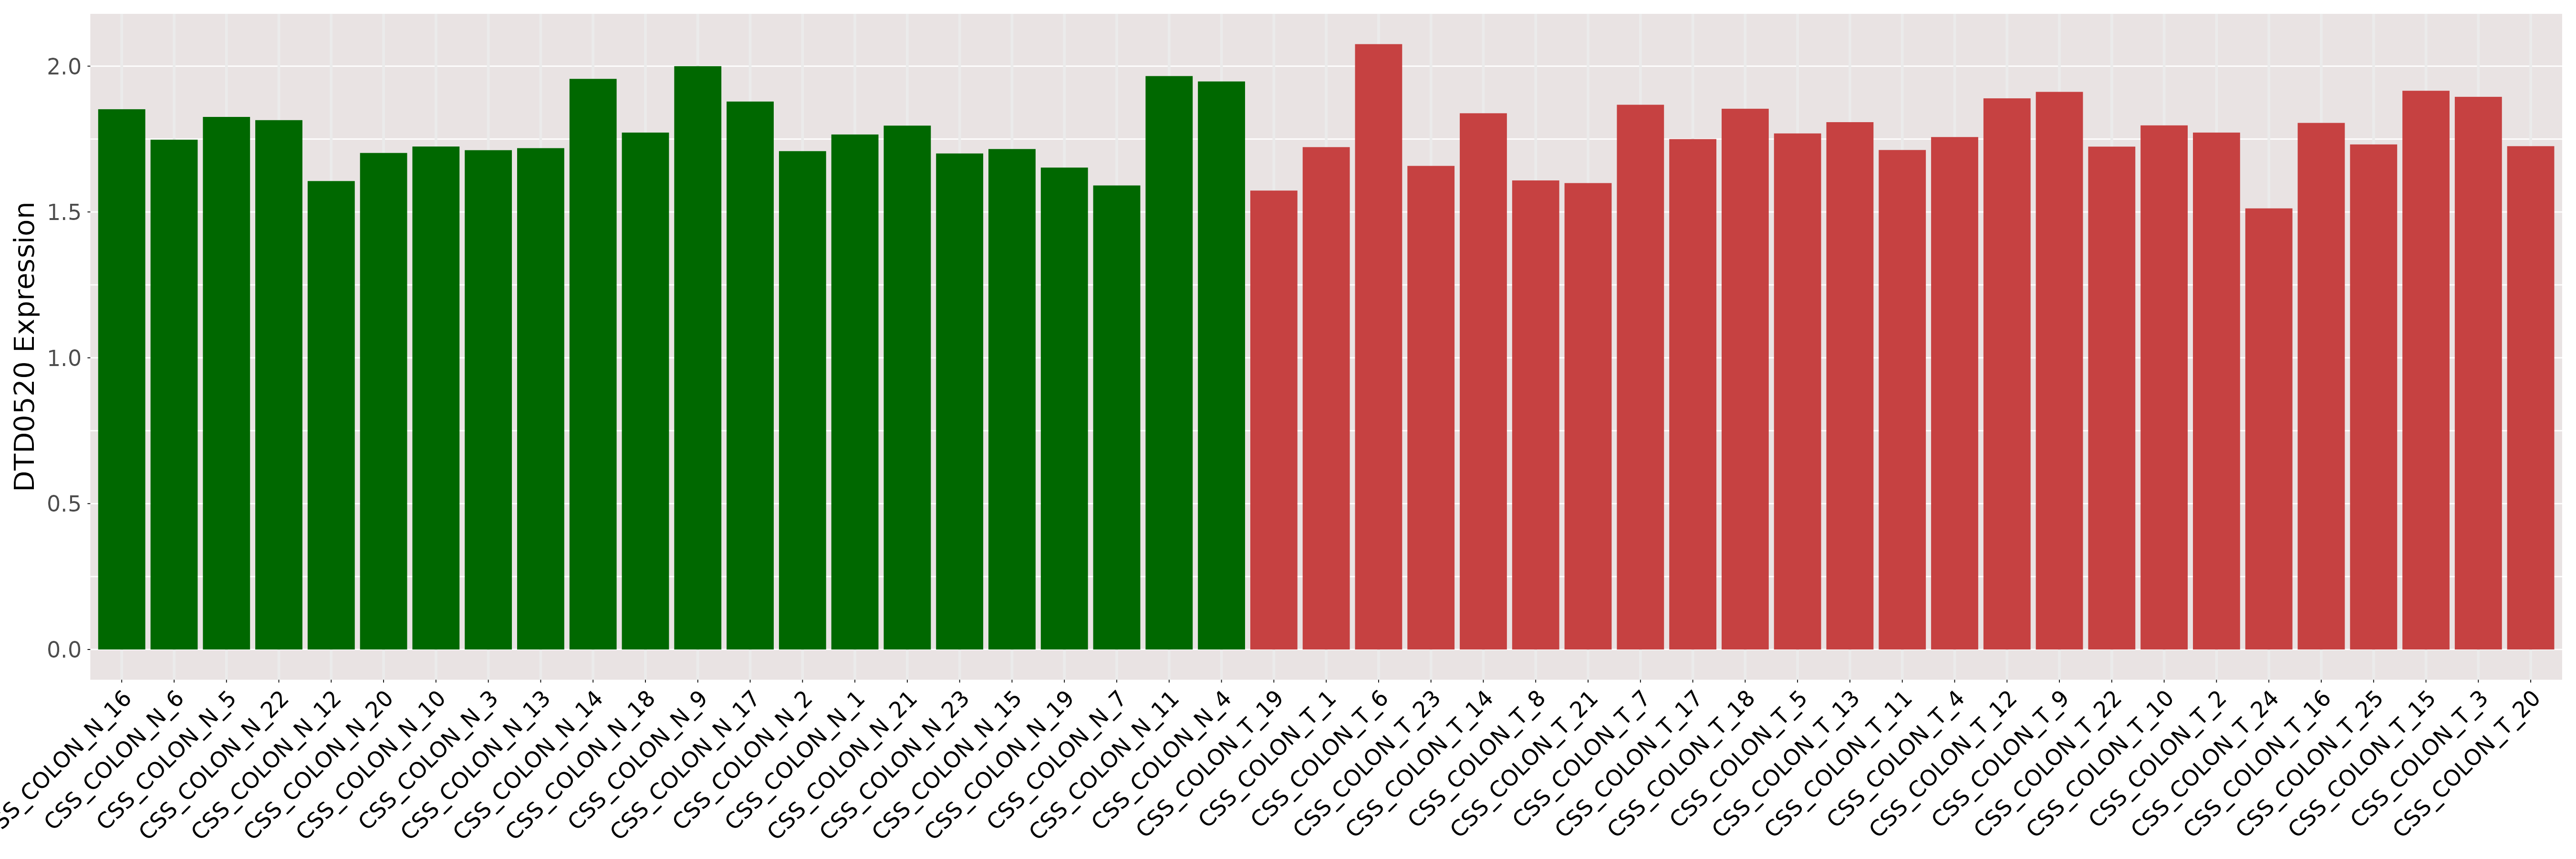
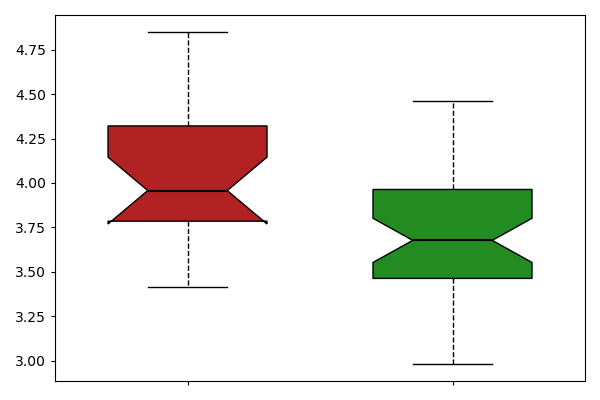
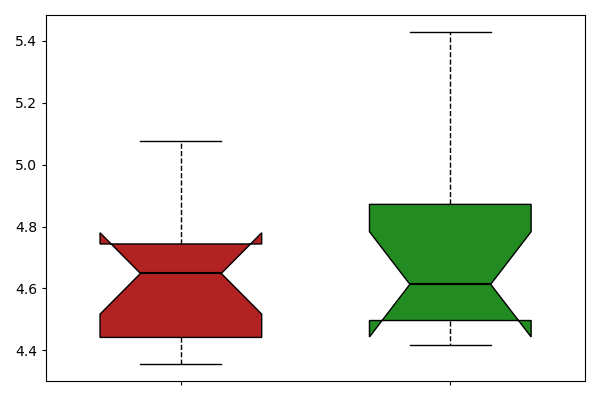
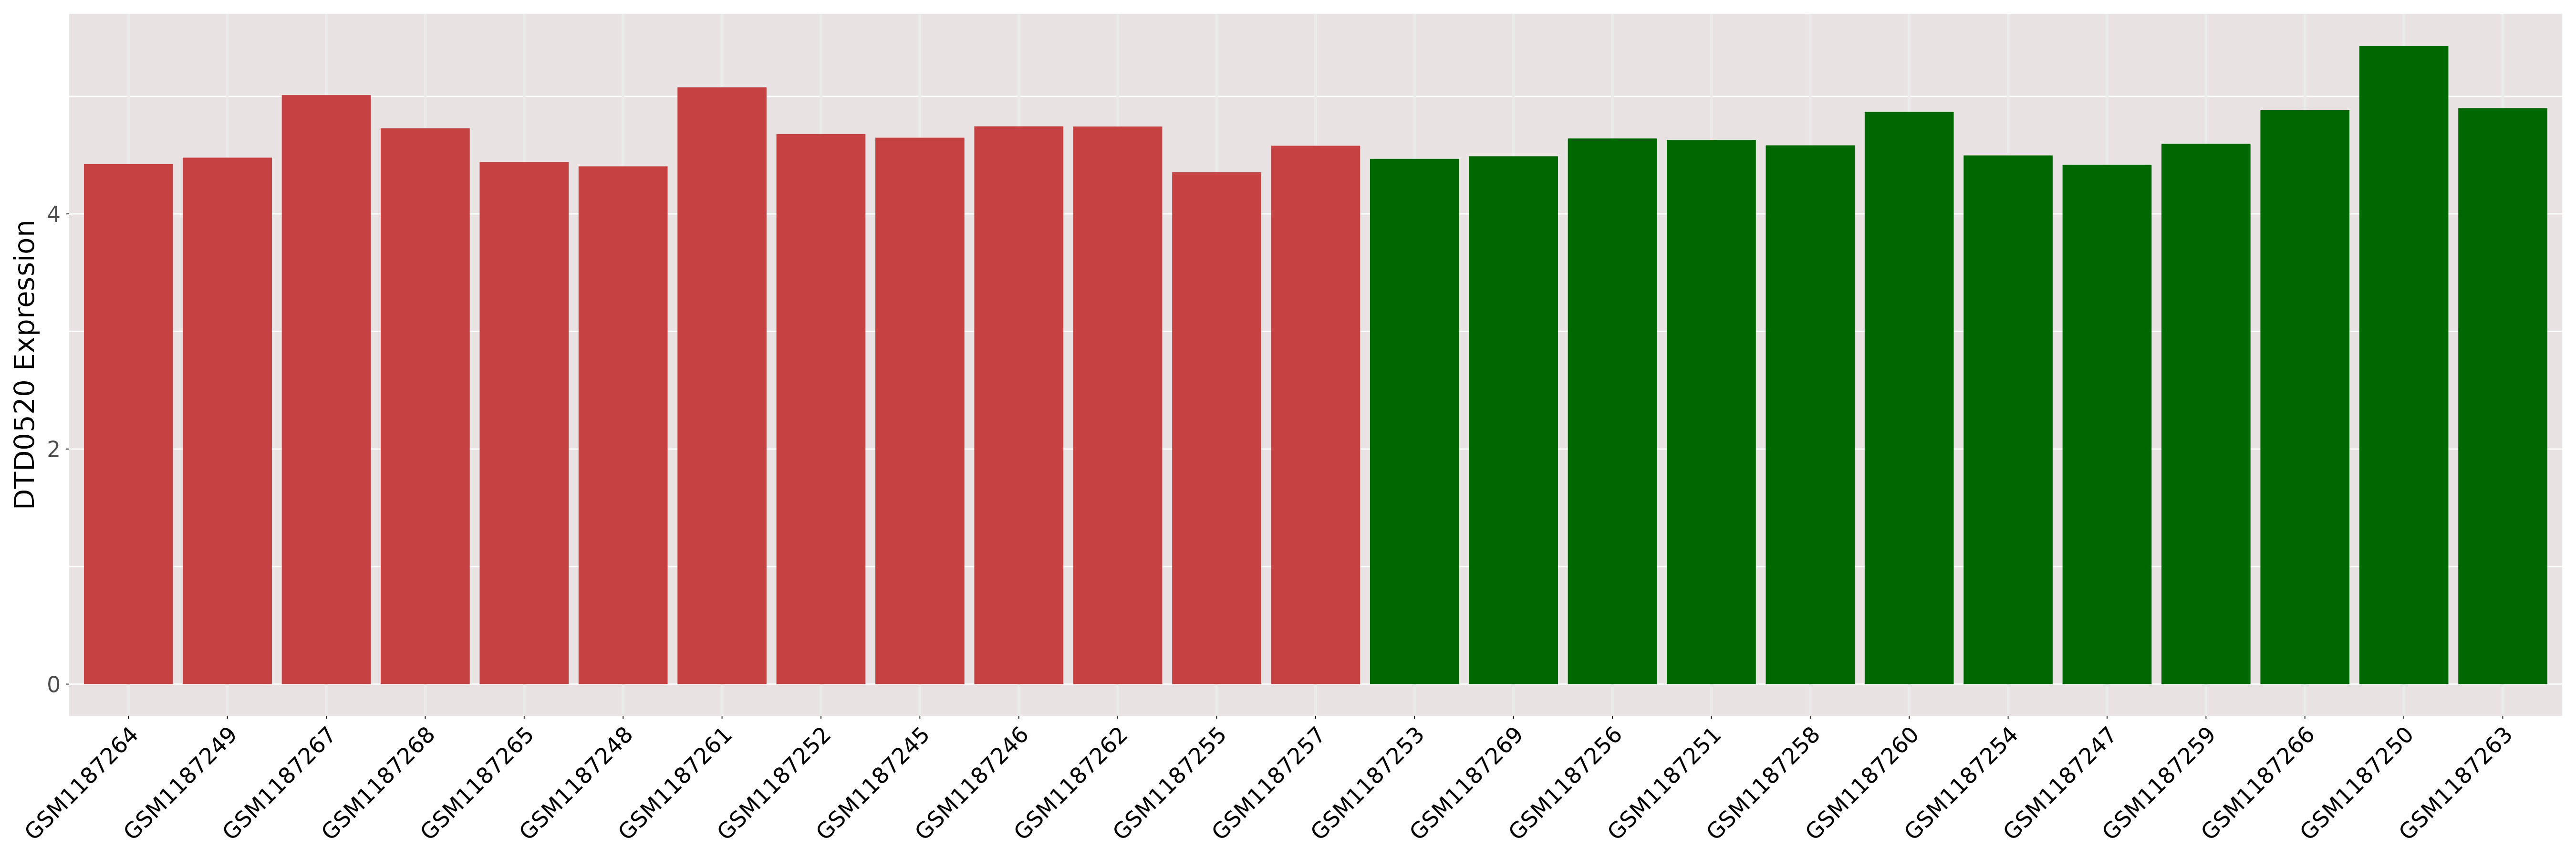
| [+] ICD-11: 2B91 Colorectal adenocarcinoma | Click to Show/Hide the Full List | ||||
| The Studied Tissue | Colon | ||||
| The Specified Disease | Colorectal adenocarcinoma [ICD-11:2B91] | ||||
| The Expression Level of Disease Section Compare with the Healthy Individual Tissue | p-value:0.8025338235698688; Fold-change:1.0071317650541096; Z-score:-0.076979535 | ||||
| DT expression in the diseased tissue of patients
DT expression in the normal tissue of healthy individuals
|
|||||
|
 Please Click the above Thumbnail to View/Download
the Expression Barchart for All Samples Please Click the above Thumbnail to View/Download
the Expression Barchart for All Samples
|
||||
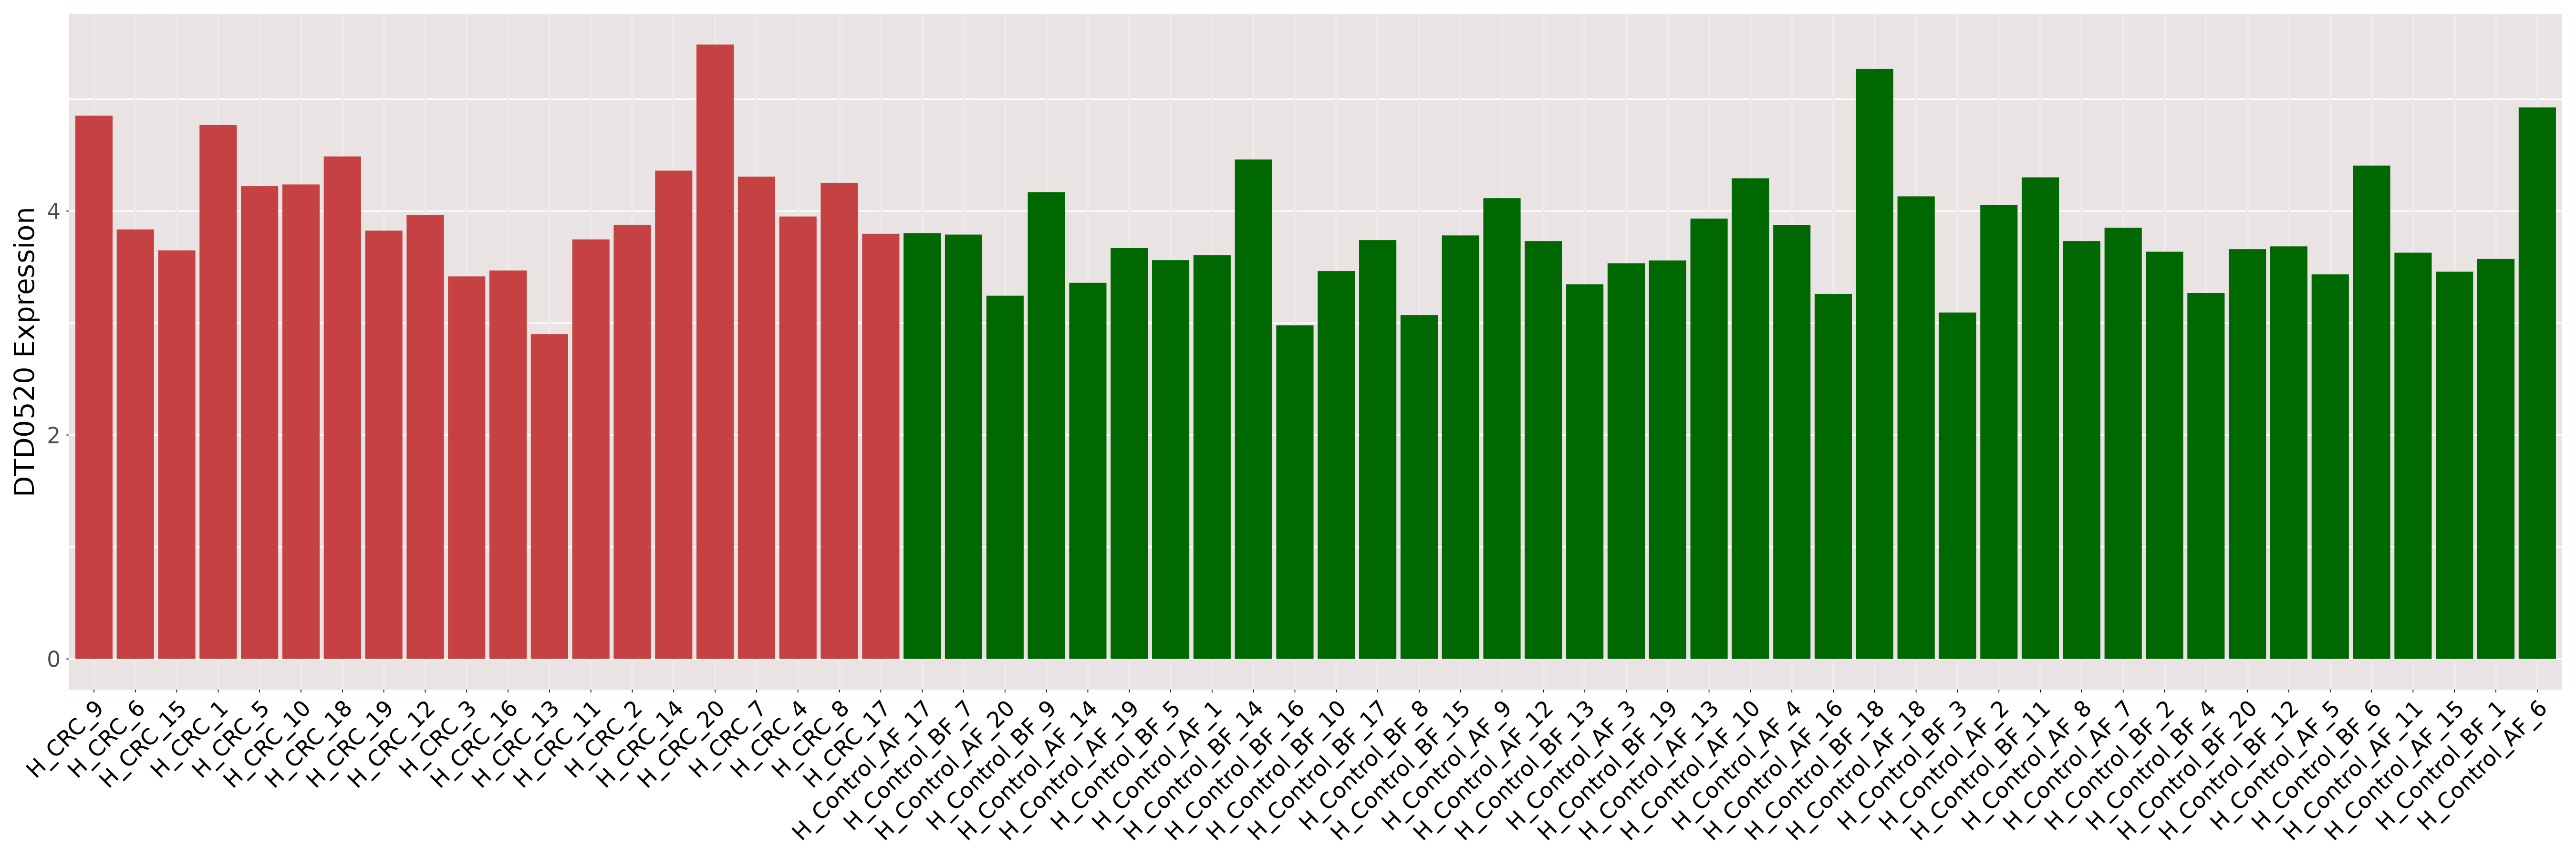
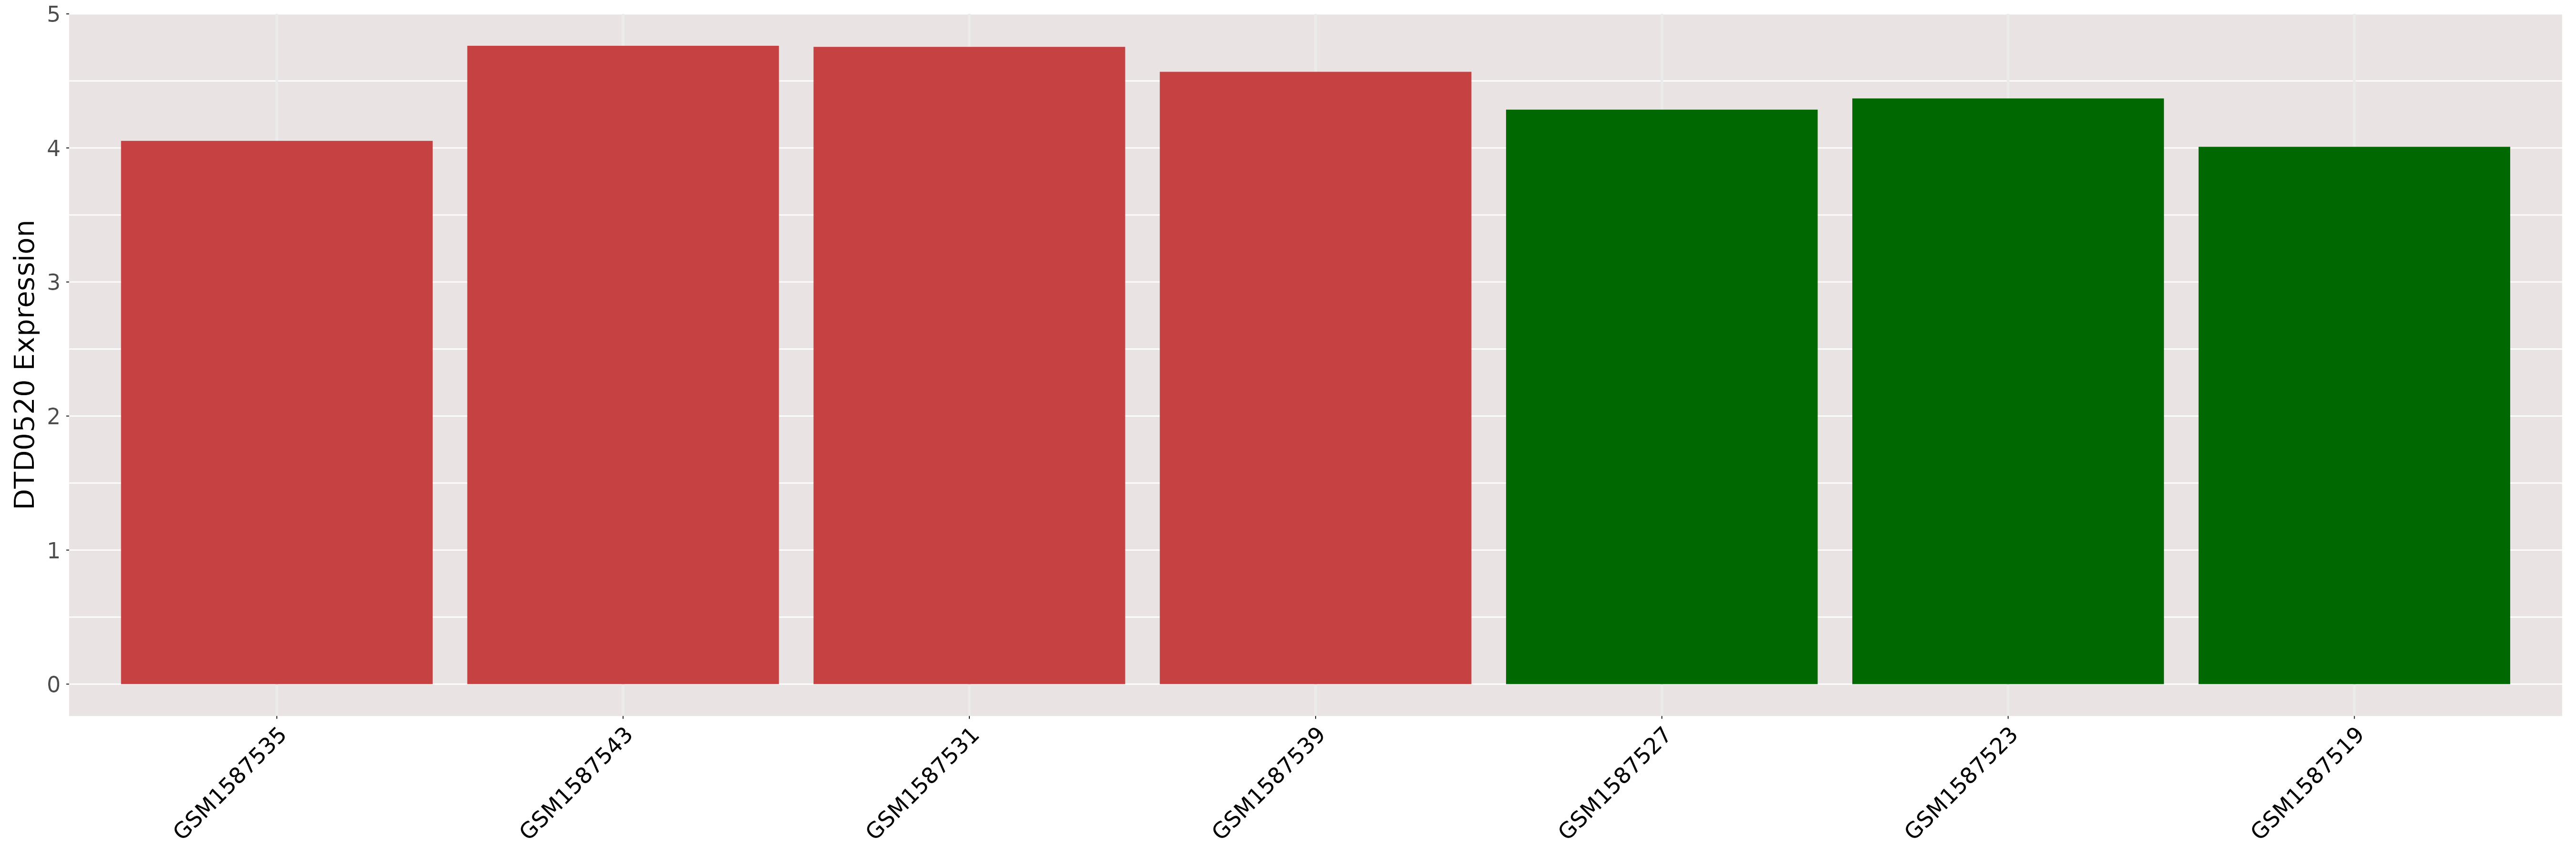
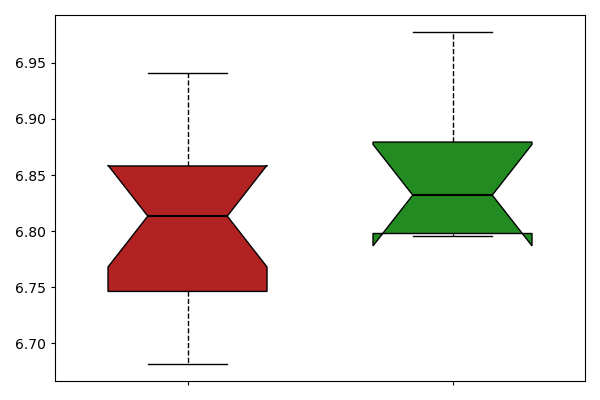
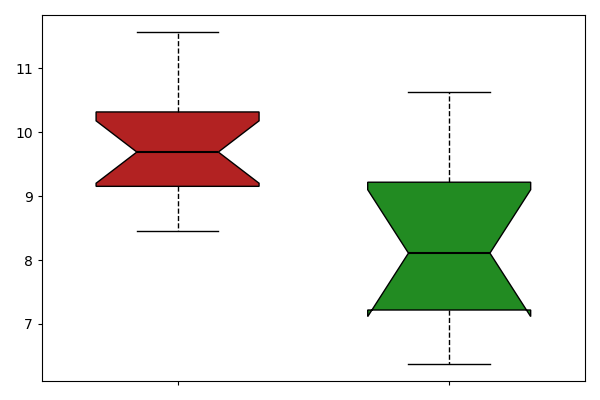
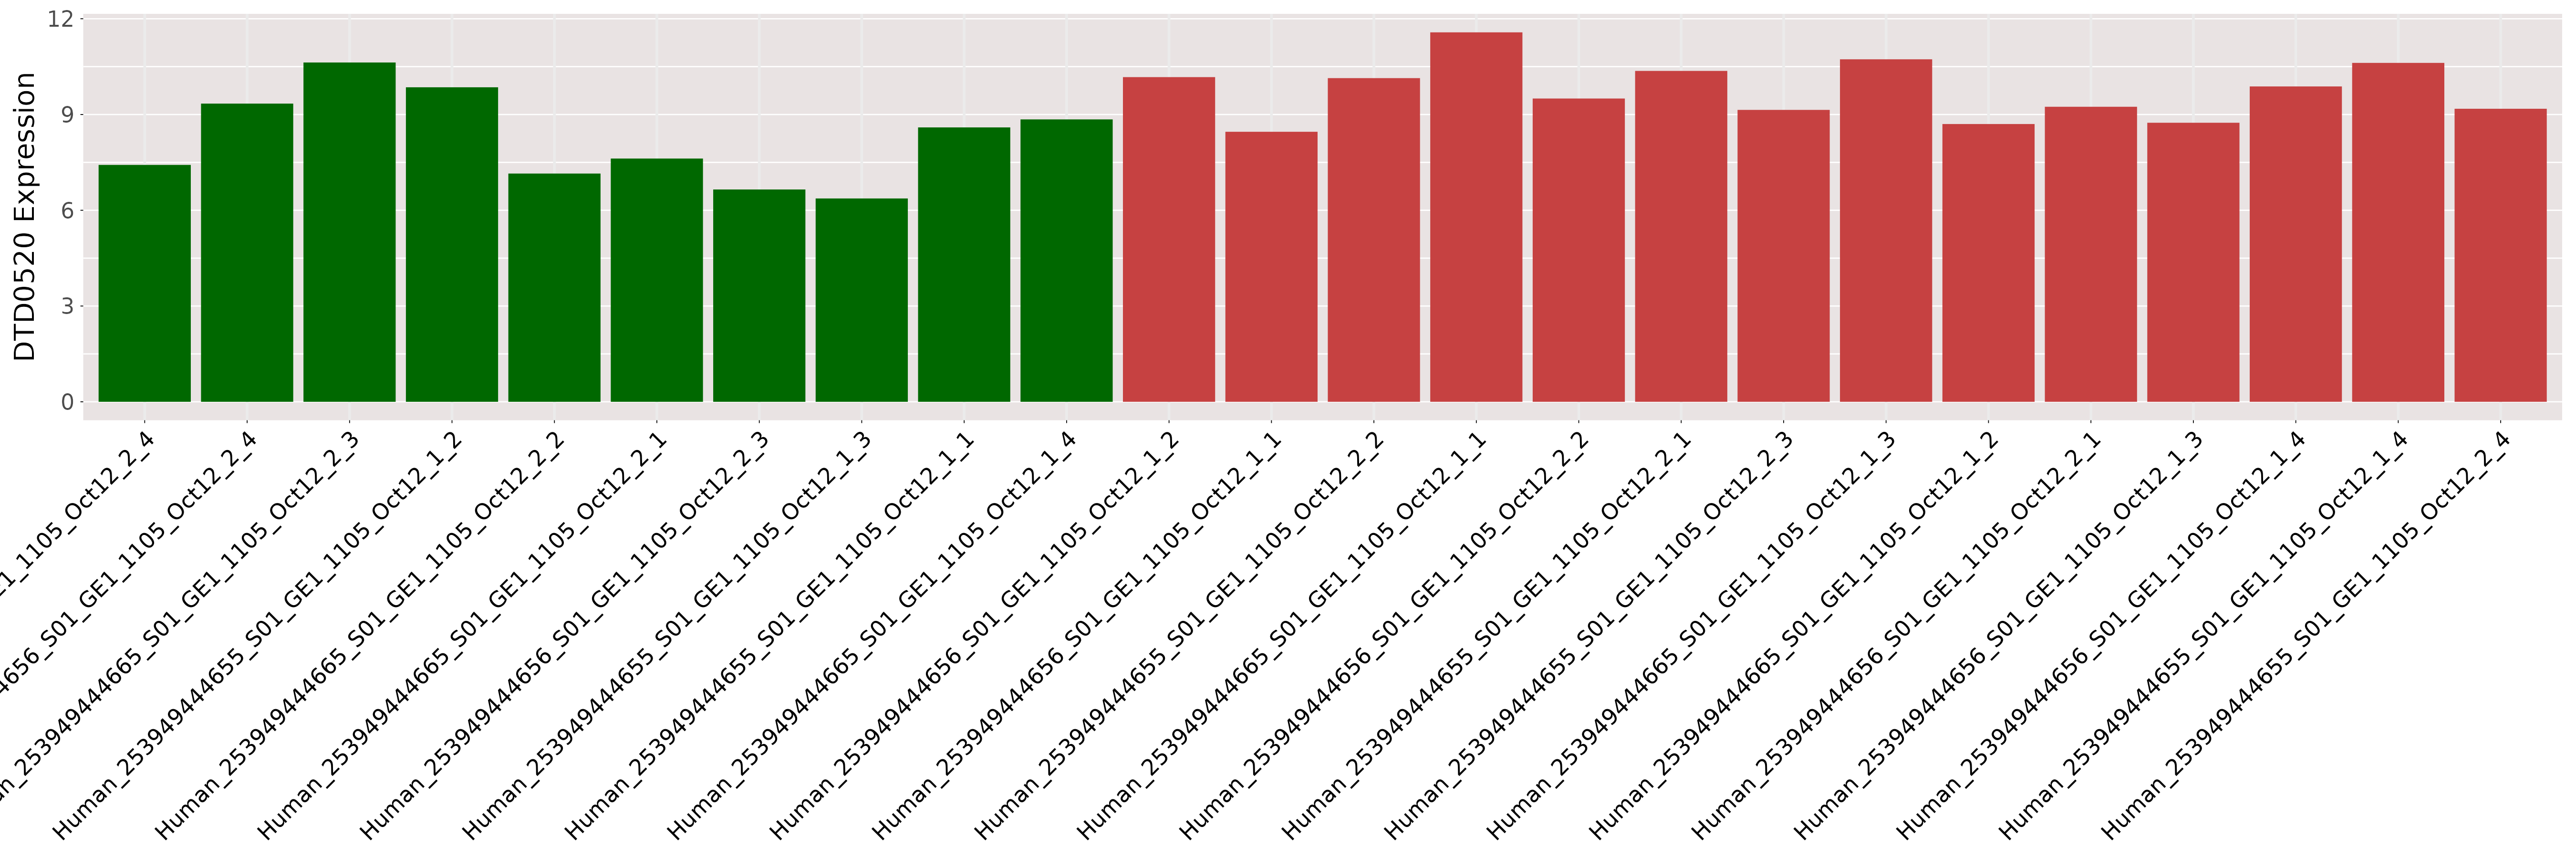
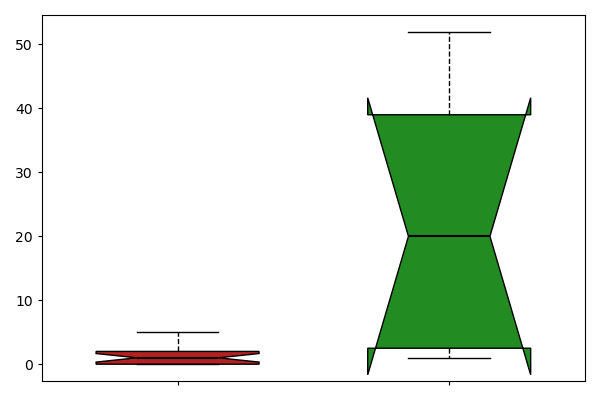
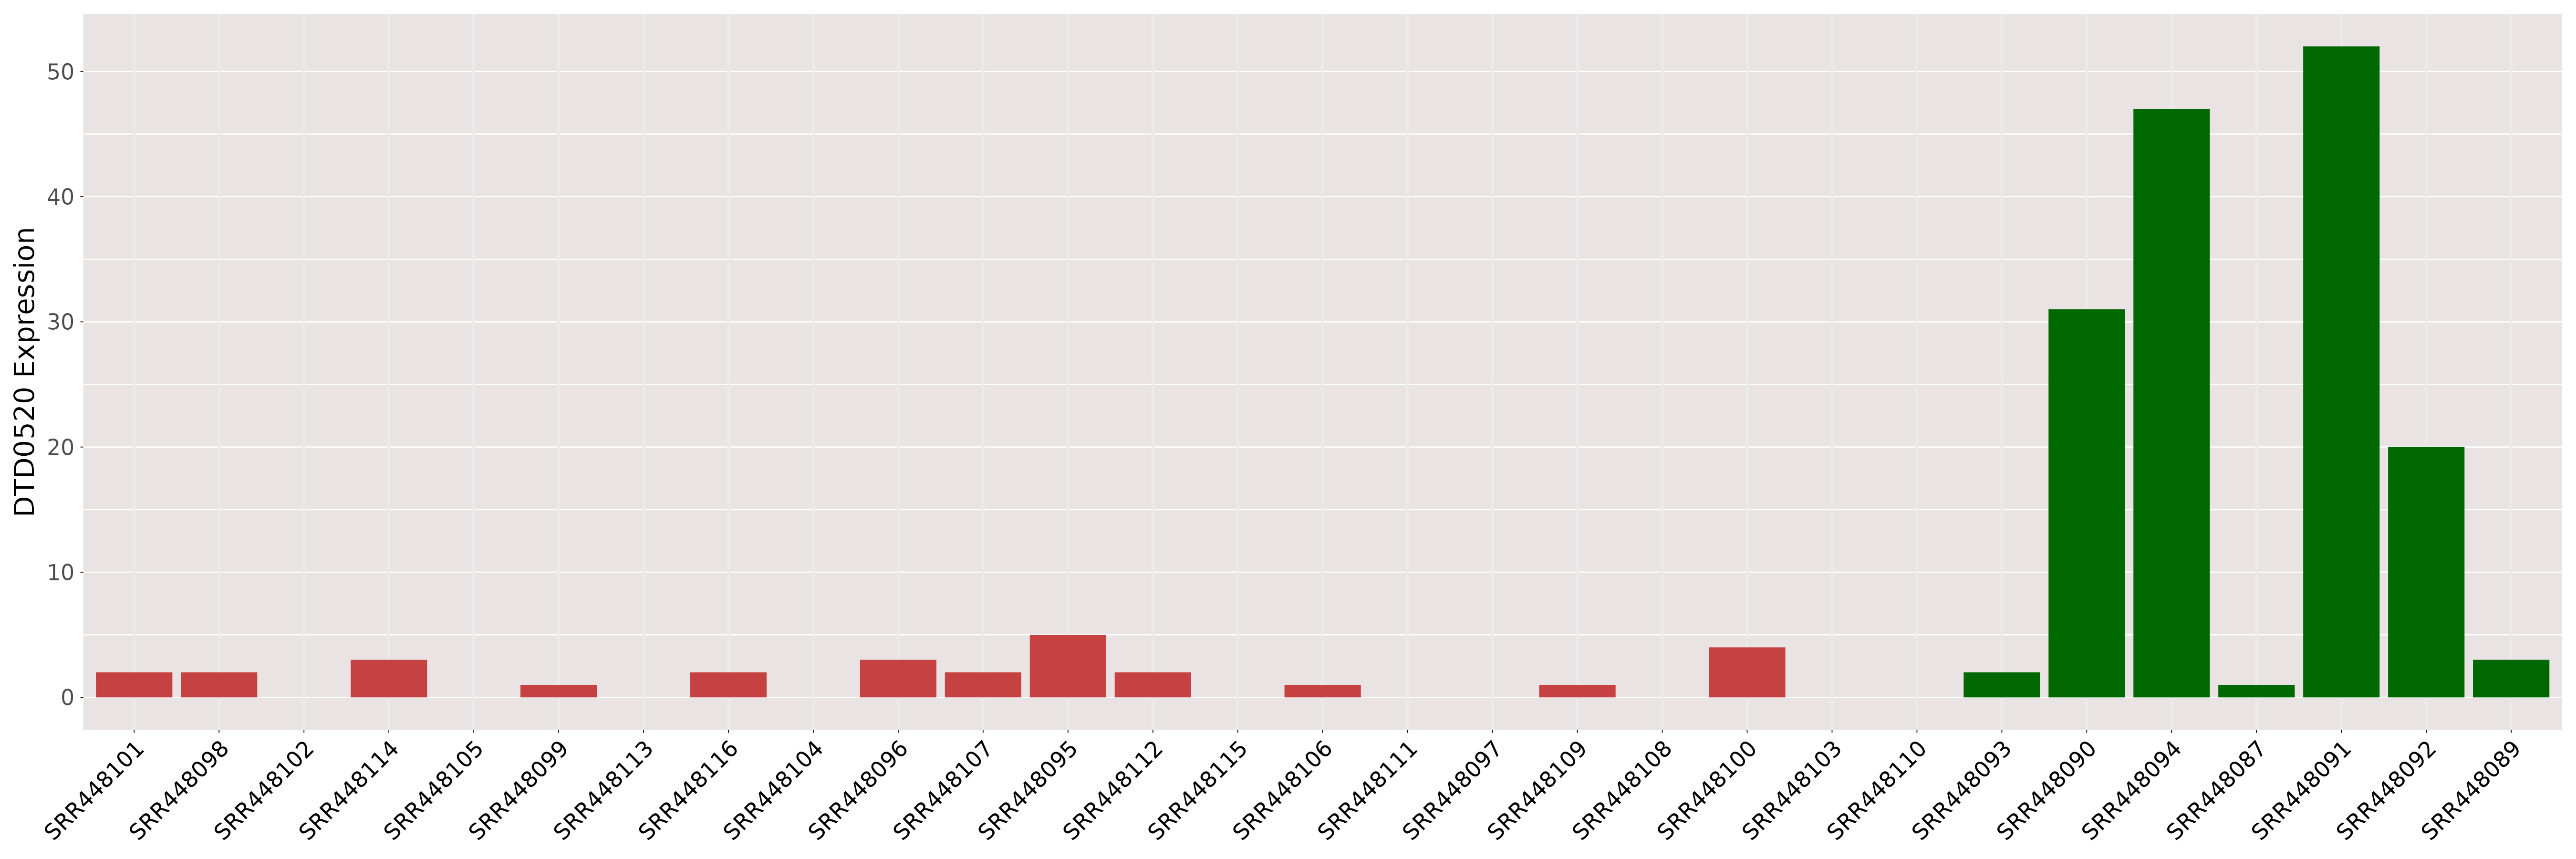
| [+] ICD-11: 2B91 Colorectal carcinoma (colorectal cancer) | Click to Show/Hide the Full List | ||||
| The Studied Tissue | Blood | ||||
| The Specified Disease | Colorectal cancer [ICD-11:2B91] | ||||
| The Expression Level of Disease Section Compare with the Healthy Individual Tissue | p-value:0.0305886056418965; Fold-change:1.0762727089967694; Z-score:0.6490266138297343 | ||||
| DT expression in the diseased tissue of patients
DT expression in the normal tissue of healthy individuals
|
|||||
|
 Please Click the above Thumbnail to View/Download
the Expression Barchart for All Samples Please Click the above Thumbnail to View/Download
the Expression Barchart for All Samples
|
||||
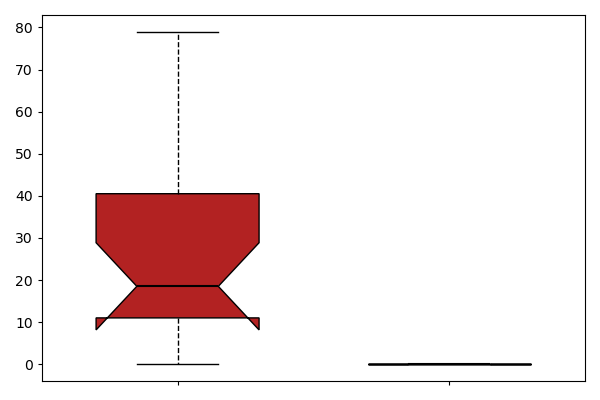
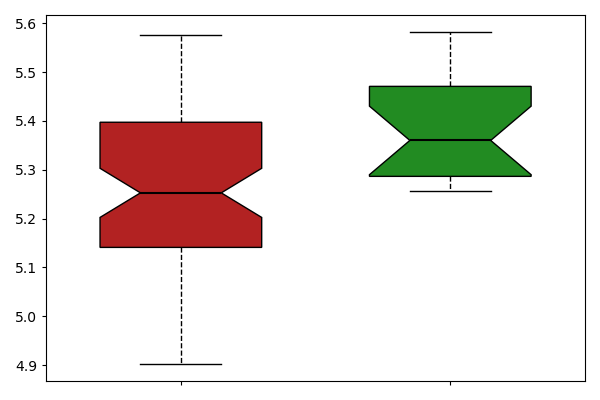
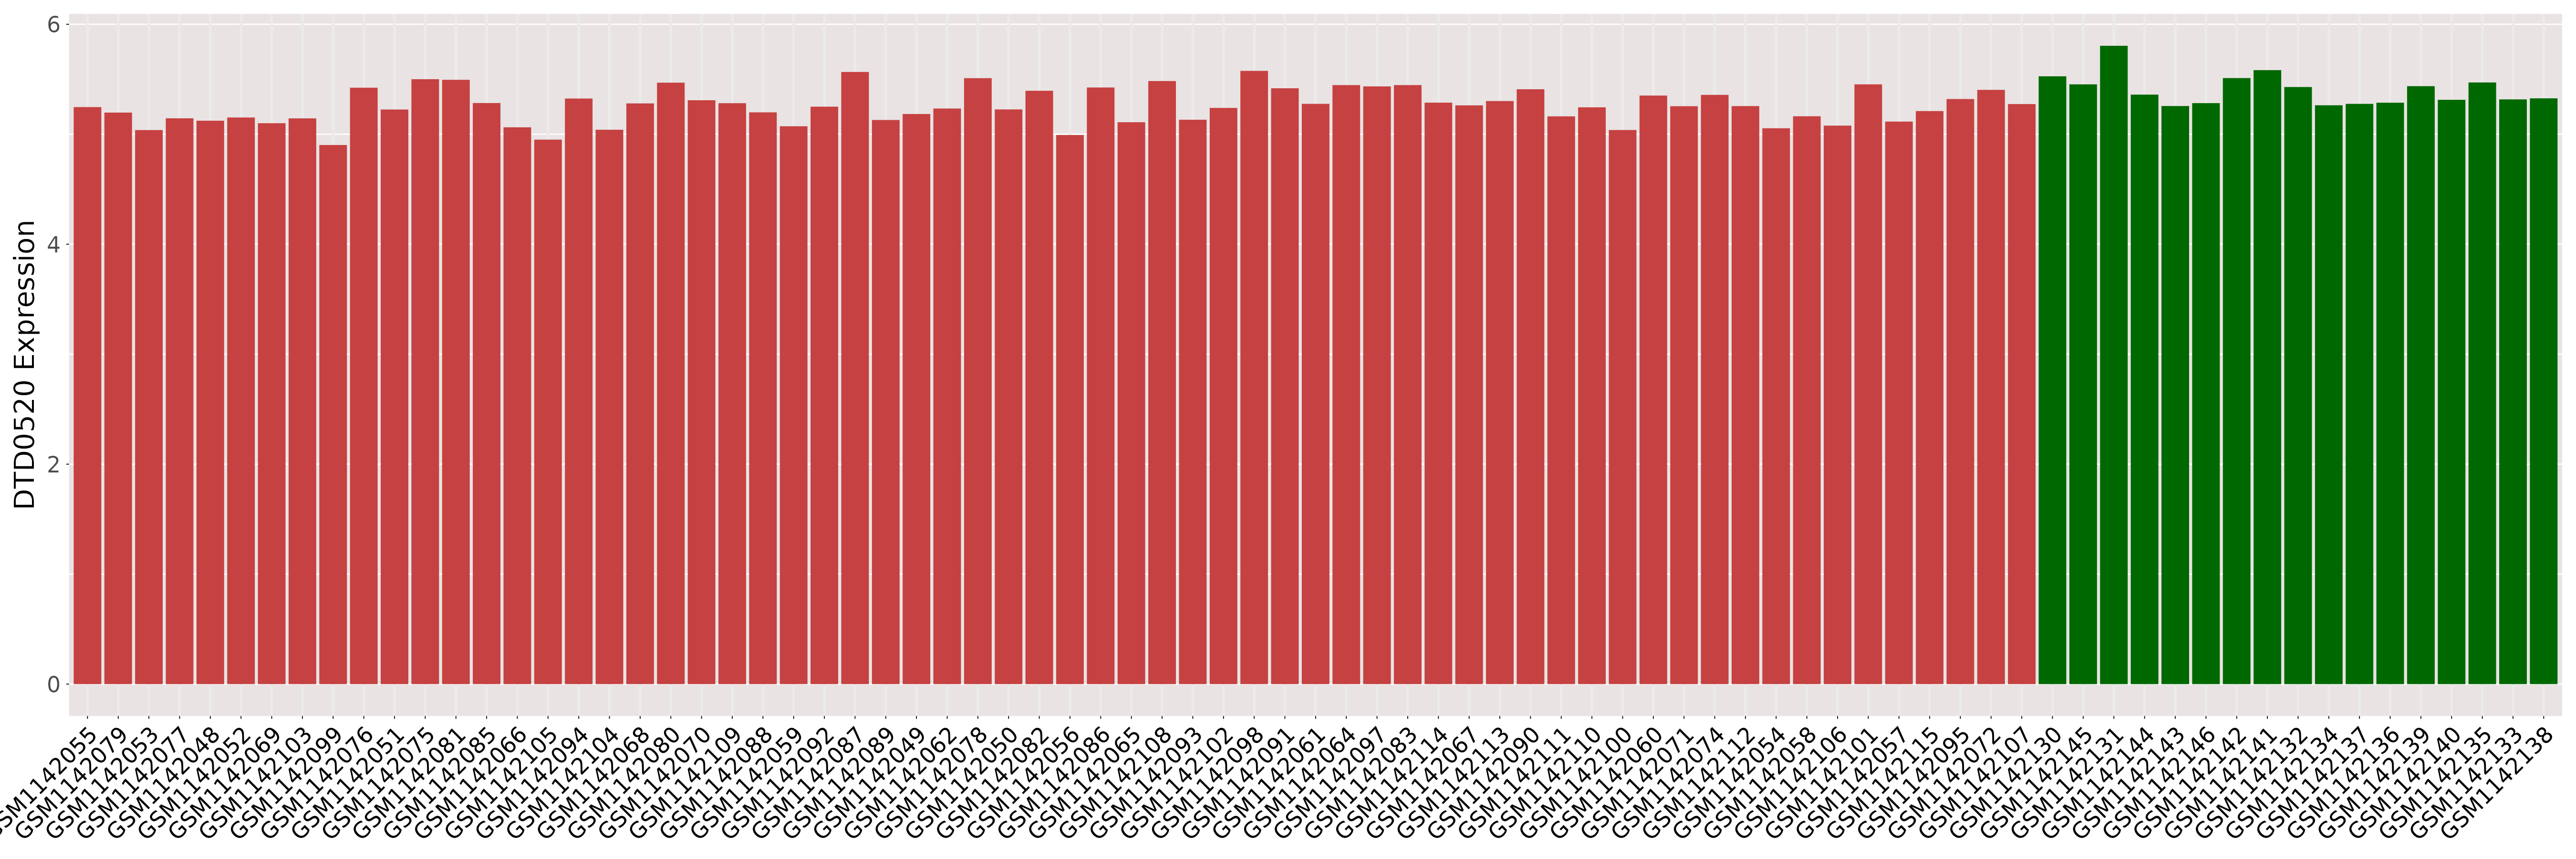
| The Studied Tissue | Colon | ||||
| The Specified Disease | Colorectal cancer [ICD-11:2B91] | ||||
| The Expression Level of Disease Section Compare with the Healthy Individual Tissue | p-value:0.0017345837794033; Fold-change:inf; Z-score:4.4712356812666885 | ||||
| DT expression in the diseased tissue of patients
DT expression in the normal tissue of healthy individuals
|
|||||
|
 Please Click the above Thumbnail to View/Download
the Expression Barchart for All Samples Please Click the above Thumbnail to View/Download
the Expression Barchart for All Samples
|
||||
| [+] ICD-11: 2C10 Malignant neoplasm of pancreas (ductal adenocarcinoma) | Click to Show/Hide the Full List | ||||
| The Studied Tissue | Liver | ||||
| The Specified Disease | Primary pancreatic ductal adenocarcinoma [ICD-11:2C10] | ||||
| The Expression Level of Disease Section Compare with the Healthy Individual Tissue | p-value:0.3489097297781197; Fold-change:1.02046969595036; Z-score:0.9047881276031404 | ||||
| DT expression in the diseased tissue of patients
DT expression in the normal tissue of healthy individuals
|
|||||
|
 Please Click the above Thumbnail to View/Download
the Expression Barchart for All Samples Please Click the above Thumbnail to View/Download
the Expression Barchart for All Samples
|
||||
| The Studied Tissue | Pancreas | ||||
| The Specified Disease | Primary pancreatic ductal adenocarcinoma [ICD-11:2C10] | ||||
| The Expression Level of Disease Section Compare with the Healthy Individual Tissue | p-value:0.0362881609199796; Fold-change:0.9685863990562312; Z-score:-1.997518337 | ||||
| DT expression in the diseased tissue of patients
DT expression in the normal tissue of healthy individuals
|
|||||
|
 Please Click the above Thumbnail to View/Download
the Expression Barchart for All Samples Please Click the above Thumbnail to View/Download
the Expression Barchart for All Samples
|
||||
| [+] ICD-11: 2C25 Malignant neoplasms of bronchus or lung | Click to Show/Hide the Full List | ||||
| The Studied Tissue | Saliva | ||||
| The Specified Disease | Lung cancer [ICD-11:2C25] | ||||
| The Expression Level of Disease Section Compare with the Healthy Individual Tissue | p-value:0.4367596475146359; Fold-change:1.076635778732763; Z-score:0.4826175956591032 | ||||
| DT expression in the diseased tissue of patients
DT expression in the normal tissue of healthy individuals
|
|||||
|
 Please Click the above Thumbnail to View/Download
the Expression Barchart for All Samples Please Click the above Thumbnail to View/Download
the Expression Barchart for All Samples
|
||||
| [+] ICD-11: 2C25.0 Adenocarcinoma of bronchus or lung | Click to Show/Hide the Full List | ||||
| The Studied Tissue | Blood | ||||
| The Specified Disease | Lung adenocarcinoma [ICD-11:2C25] | ||||
| The Expression Level of Disease Section Compare with the Healthy Individual Tissue | p-value:0.5514510978144798; Fold-change:1.003334731262683; Z-score:0.0937986985953309 | ||||
| DT expression in the diseased tissue of patients
DT expression in the normal tissue of healthy individuals
|
|||||
|
 Please Click the above Thumbnail to View/Download
the Expression Barchart for All Samples Please Click the above Thumbnail to View/Download
the Expression Barchart for All Samples
|
||||
| The Studied Tissue | Lung | ||||
| The Specified Disease | Lung adenocarcinoma [ICD-11:2C25] | ||||
| The Expression Level of Disease Section Compare with the Healthy Individual Tissue | p-value:0.0005215368577926; Fold-change:1.033703016628414; Z-score:1.894099215588839 | ||||
| DT expression in the diseased tissue of patients
DT expression in the normal tissue of healthy individuals
|
|||||
|
 Please Click the above Thumbnail to View/Download
the Expression Barchart for All Samples Please Click the above Thumbnail to View/Download
the Expression Barchart for All Samples
|
||||
| The Studied Tissue | Lung | ||||
| The Specified Disease | Lung adenocarcinomas [ICD-11:2C25] | ||||
| The Expression Level of Disease Section Compare with the Healthy Individual Tissue | p-value:0.361318309215033; Fold-change:0.9802246321432526; Z-score:-0.57909473 | ||||
| DT expression in the diseased tissue of patients
DT expression in the normal tissue of healthy individuals
|
|||||
|
 Please Click the above Thumbnail to View/Download
the Expression Barchart for All Samples Please Click the above Thumbnail to View/Download
the Expression Barchart for All Samples
|
||||
| [+] ICD-11: 2C25.0Z Non-small cell carcinoma of lung, unspecified | Click to Show/Hide the Full List | ||||
| The Studied Tissue | Lung | ||||
| The Specified Disease | Non small cell lung cancer [ICD-11:2C25] | ||||
| The Expression Level of Disease Section Compare with the Healthy Individual Tissue | p-value:0.9121593518880868; Fold-change:0.9904564688860524; Z-score:-0.020297659 | ||||
| DT expression in the diseased tissue of patients
DT expression in the normal tissue of healthy individuals
|
|||||
|
 Please Click the above Thumbnail to View/Download
the Expression Barchart for All Samples Please Click the above Thumbnail to View/Download
the Expression Barchart for All Samples
|
||||
| [+] ICD-11: 2C25.1 Small cell carcinoma of bronchus or lung | Click to Show/Hide the Full List | ||||
| The Studied Tissue | Lung | ||||
| The Specified Disease | Small cell lung carcinoma [ICD-11:2C25] | ||||
| The Expression Level of Disease Section Compare with the Healthy Individual Tissue | p-value:0.0864563078856332; Fold-change:5.851063829787234; Z-score:1.885052721912728 | ||||
| DT expression in the diseased tissue of patients
DT expression in the normal tissue of healthy individuals
|
|||||
|
 Please Click the above Thumbnail to View/Download
the Expression Barchart for All Samples Please Click the above Thumbnail to View/Download
the Expression Barchart for All Samples
|
||||
| [+] ICD-11: 2C31 Squamous cell carcinoma of skin | Click to Show/Hide the Full List | ||||
| The Studied Tissue | Skin | ||||
| The Specified Disease | Squamous cell carcinoma [ICD-11:2C31.Z] | ||||
| The Expression Level of Disease Section Compare with the Healthy Individual Tissue | p-value:0.5638062359367568; Fold-change:0.6666666666666666; Z-score:-0.277100063 | ||||
| DT expression in the diseased tissue of patients
DT expression in the normal tissue of healthy individuals
|
|||||
|
 Please Click the above Thumbnail to View/Download
the Expression Barchart for All Samples Please Click the above Thumbnail to View/Download
the Expression Barchart for All Samples
|
||||
| [+] ICD-11: 2C90 Malignant neoplasm of kidney, except renal pelvis (clear cell type) | Click to Show/Hide the Full List | ||||
| The Studied Tissue | Kidney | ||||
| The Specified Disease | Clear cell renal carcinomas [ICD-11:2C90] | ||||
| The Expression Level of Disease Section Compare with the Healthy Individual Tissue | p-value:0.0007430639883453; Fold-change:0.8287559447684333; Z-score:-1.038833731 | ||||
| DT expression in the diseased tissue of patients
DT expression in the normal tissue of healthy individuals
|
|||||
|
|
|
||||
| [+] ICD-11: 2C90.0 Renal cell carcinoma of kidney, except renal pelvis (chromophobe type) | Click to Show/Hide the Full List | ||||
| The Studied Tissue | Kidney | ||||
| The Specified Disease | Chromophobe renal cell carcinoma [ICD-11:2C90.Y] | ||||
| The Expression Level of Disease Section Compare with the Healthy Individual Tissue | p-value:0.0162526383362676; Fold-change:1.0976624419525212; Z-score:3.0151998324630904 | ||||
| DT expression in the diseased tissue of patients
DT expression in the normal tissue of healthy individuals
|
|||||
|
 Please Click the above Thumbnail to View/Download
the Expression Barchart for All Samples Please Click the above Thumbnail to View/Download
the Expression Barchart for All Samples
|
||||
| [+] ICD-11: 2C90.0 Renal cell carcinoma of kidney, except renal pelvis (papillary type) | Click to Show/Hide the Full List | ||||
| The Studied Tissue | Kidney | ||||
| The Specified Disease | Papillary renal cell carcinoma [ICD-11:2C90.Y] | ||||
| The Expression Level of Disease Section Compare with the Healthy Individual Tissue | p-value:0.5902434437394458; Fold-change:1.0213848174171485; Z-score:0.3979398720732744 | ||||
| DT expression in the diseased tissue of patients
DT expression in the normal tissue of healthy individuals
|
|||||
|
 Please Click the above Thumbnail to View/Download
the Expression Barchart for All Samples Please Click the above Thumbnail to View/Download
the Expression Barchart for All Samples
|
||||
| [+] ICD-11: 2C90.Y Nephroblastoma (Wilms tumor) | Click to Show/Hide the Full List | ||||
| The Studied Tissue | Kidney | ||||
| The Specified Disease | Nephroblastoma [ICD-11:2C90.Y] | ||||
| The Expression Level of Disease Section Compare with the Healthy Individual Tissue | p-value:0.7164287425592899; Fold-change:0.9629491979021992; Z-score:-0.350192227 | ||||
| DT expression in the diseased tissue of patients
DT expression in the normal tissue of healthy individuals
|
|||||
|
 Please Click the above Thumbnail to View/Download
the Expression Barchart for All Samples Please Click the above Thumbnail to View/Download
the Expression Barchart for All Samples
|
||||
| [+] ICD-11: 2C94.2 Urothelial carcinoma of bladder | Click to Show/Hide the Full List | ||||
| The Studied Tissue | Bladder | ||||
| The Specified Disease | Urothelial carcinoma [ICD-11:2C94.2] | ||||
| The Expression Level of Disease Section Compare with the Healthy Individual Tissue | p-value:0.1553495980118643; Fold-change:1.066848302680447; Z-score:0.6189871949466714 | ||||
| DT expression in the diseased tissue of patients
DT expression in the normal tissue of healthy individuals
|
|||||
|
 Please Click the above Thumbnail to View/Download
the Expression Barchart for All Samples Please Click the above Thumbnail to View/Download
the Expression Barchart for All Samples
|
||||
| [+] ICD-11: 2E86.0 Leiomyoma of uterus (uterine fibroid) | Click to Show/Hide the Full List | ||||
| The Studied Tissue | Uterus | ||||
| The Specified Disease | Uterine fibroid [ICD-11:2E86.0] | ||||
| The Expression Level of Disease Section Compare with the Healthy Individual Tissue | p-value:0.7885179758880441; Fold-change:0.976191529056146; Z-score:-0.263058445 | ||||
| DT expression in the diseased tissue of patients
DT expression in the normal tissue of healthy individuals
|
|||||
|
 Please Click the above Thumbnail to View/Download
the Expression Barchart for All Samples Please Click the above Thumbnail to View/Download
the Expression Barchart for All Samples
|
||||
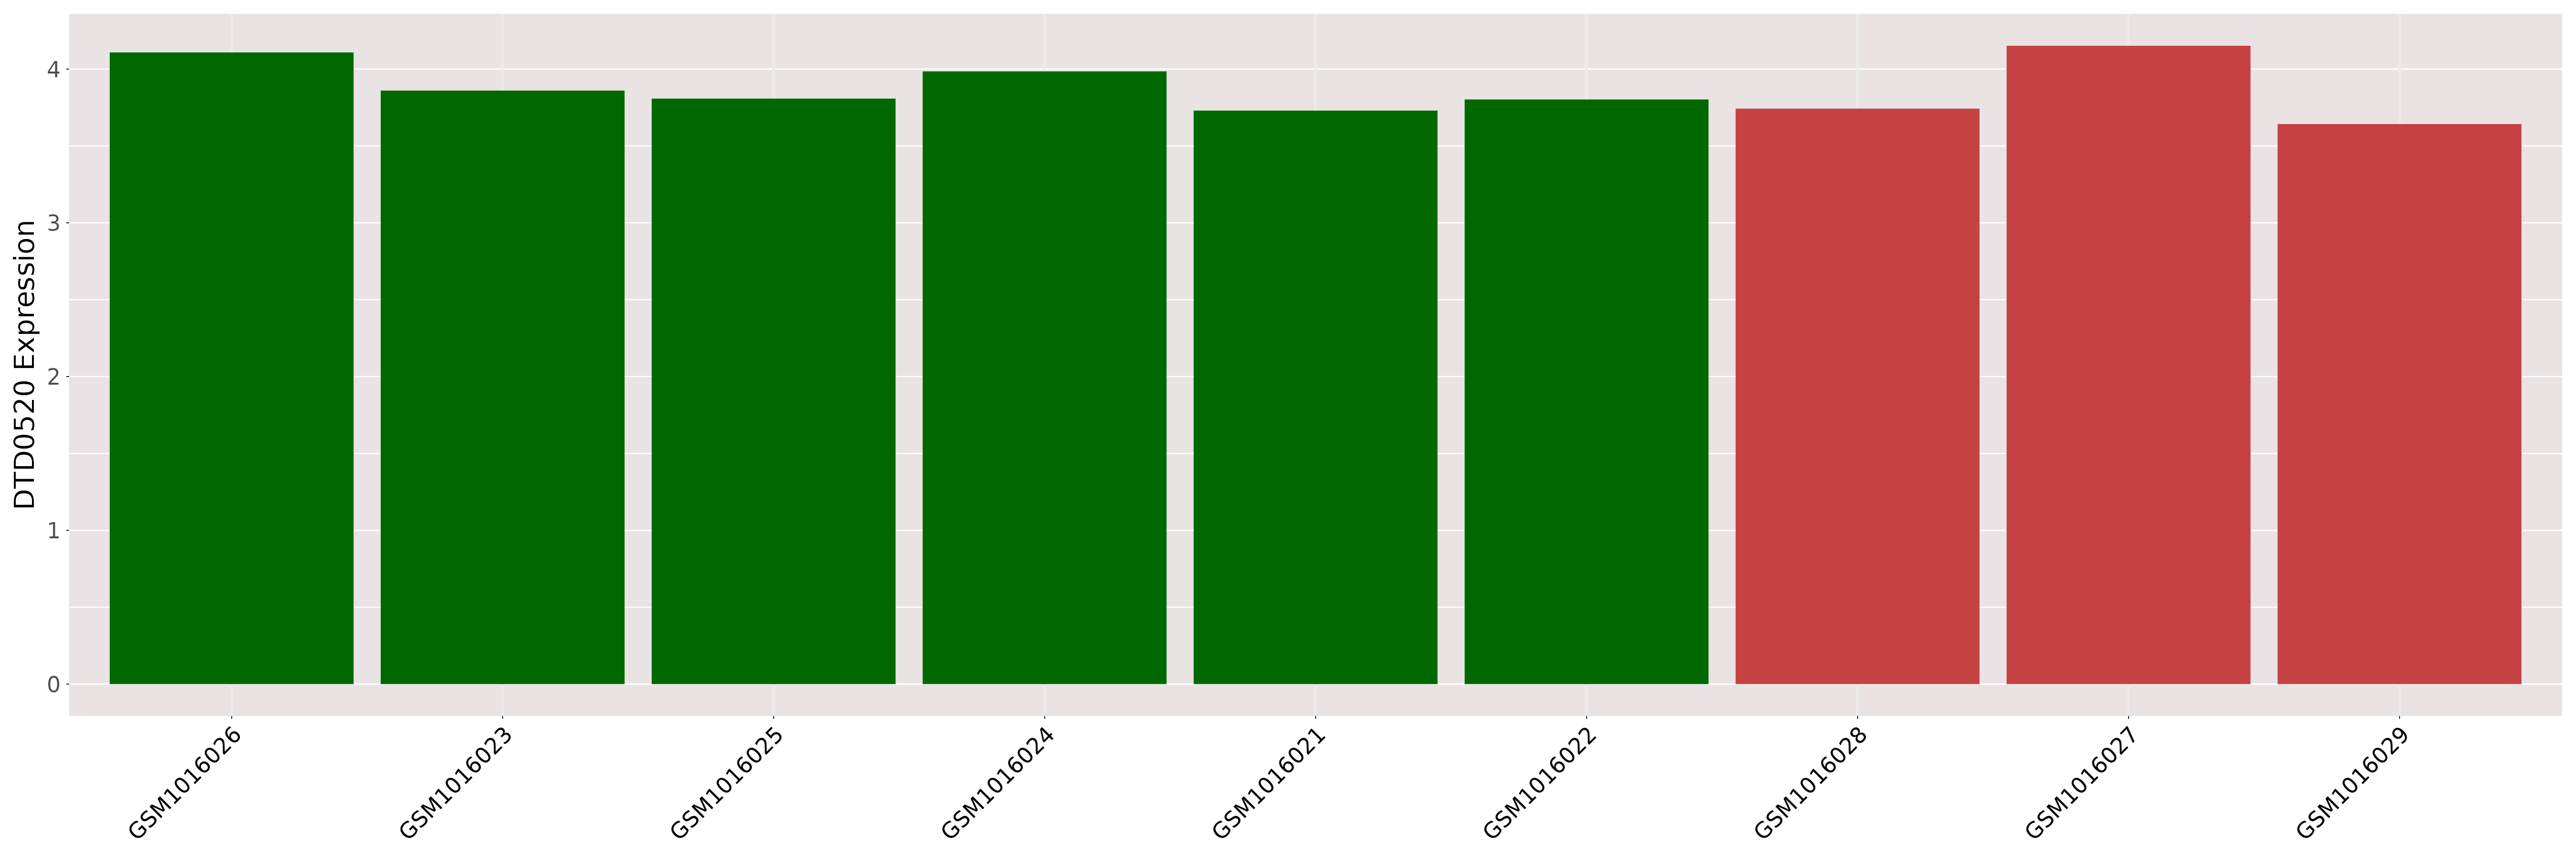
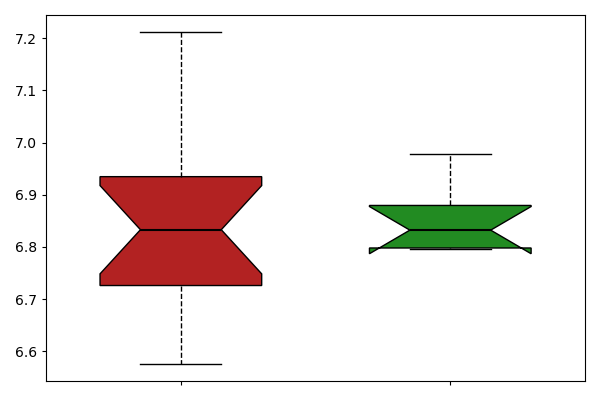
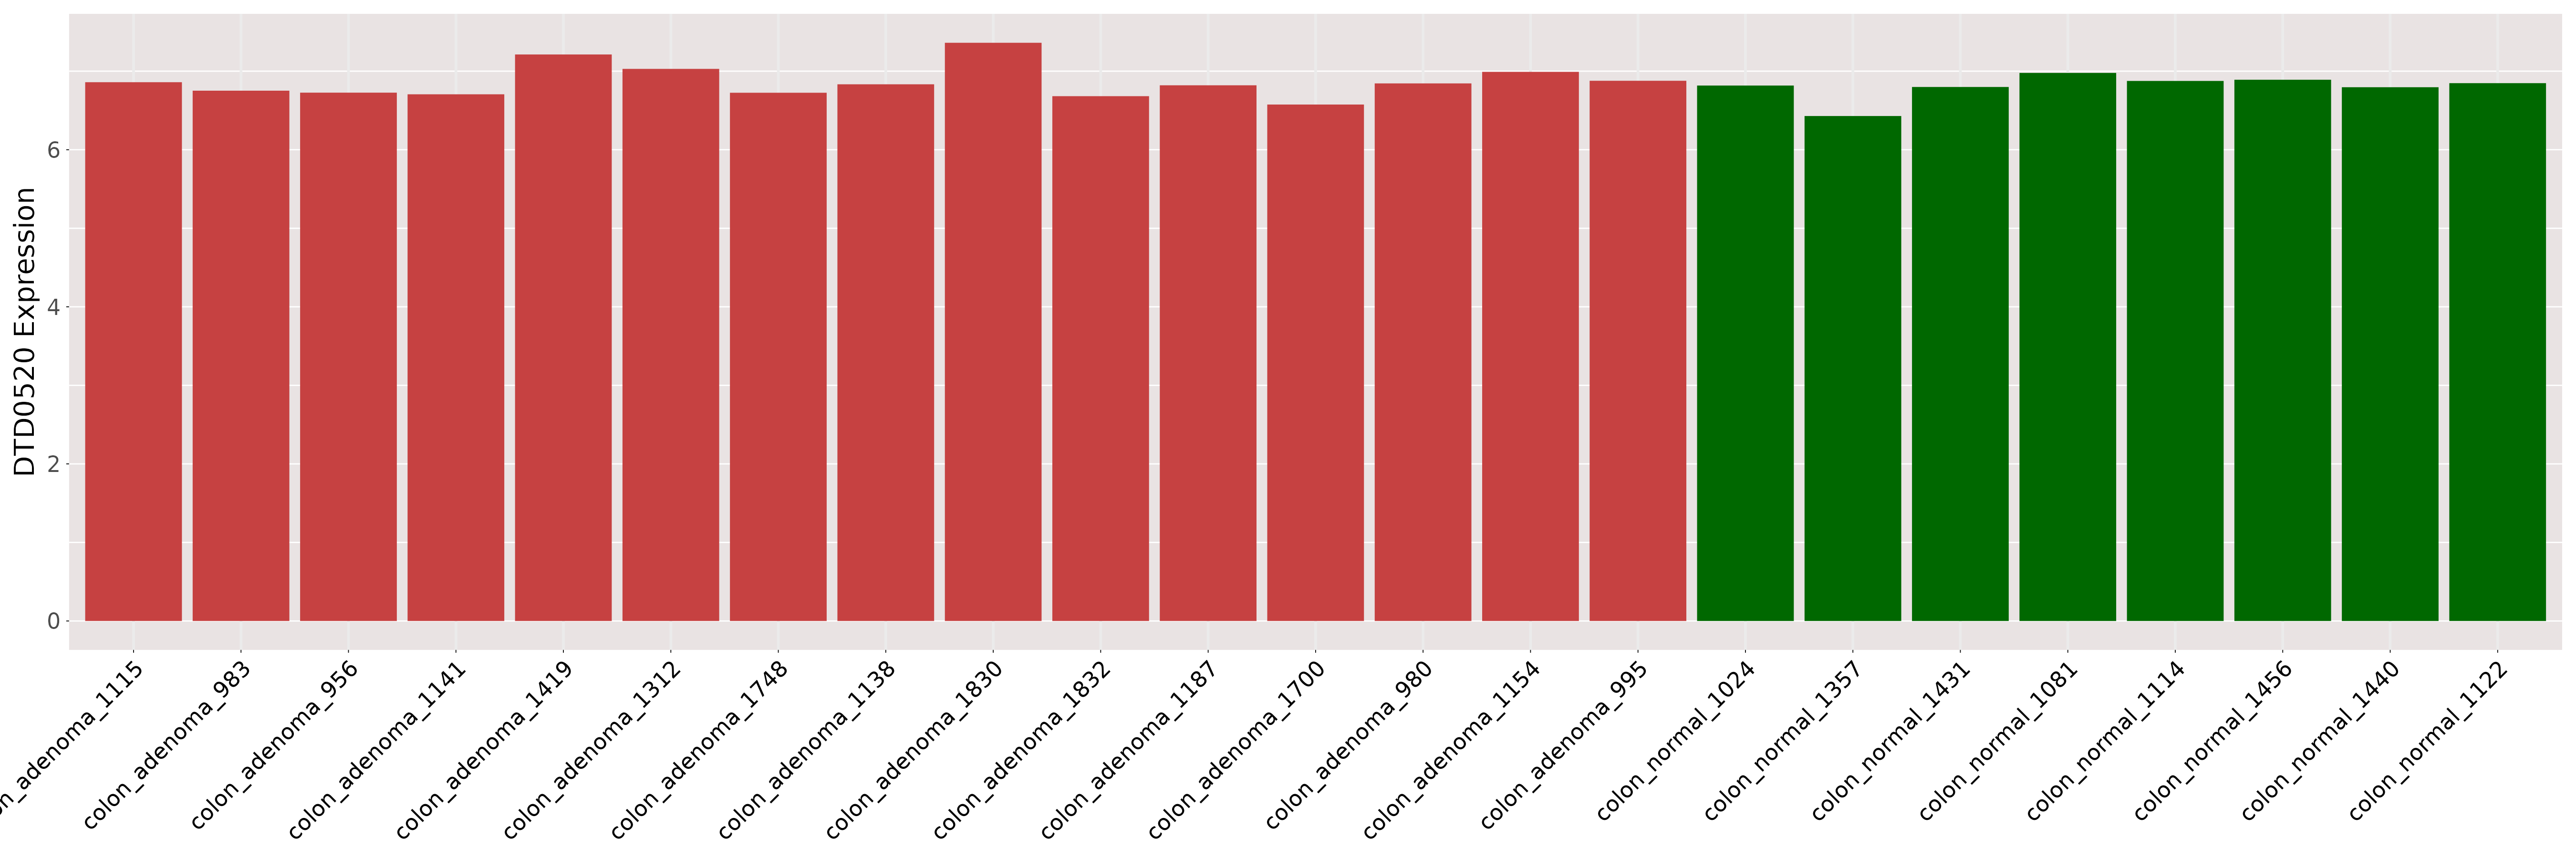
| [+] ICD-11: 2F32.0 Adenoma of colon (benign colon polyp) | Click to Show/Hide the Full List | ||||
| The Studied Tissue | Colon | ||||
| The Specified Disease | Colon adenoma [ICD-11:2F32.0] | ||||
| The Expression Level of Disease Section Compare with the Healthy Individual Tissue | p-value:0.4718087141451766; Fold-change:1.0001188395985106; Z-score:0.3829703409179084 | ||||
| DT expression in the diseased tissue of patients
DT expression in the normal tissue of healthy individuals
|
|||||
|
 Please Click the above Thumbnail to View/Download
the Expression Barchart for All Samples Please Click the above Thumbnail to View/Download
the Expression Barchart for All Samples
|
||||
| [+] ICD-11: 2F92 Benign neoplasm of kidney (renal oncocytoma) | Click to Show/Hide the Full List | ||||
| The Studied Tissue | Kidney | ||||
| The Specified Disease | Kidney oncocytoma [ICD-11:2F92] | ||||
| The Expression Level of Disease Section Compare with the Healthy Individual Tissue | p-value:0.2157138220538693; Fold-change:1.0343377389810529; Z-score:1.0938098310265394 | ||||
| DT expression in the diseased tissue of patients
DT expression in the normal tissue of healthy individuals
|
|||||
|
 Please Click the above Thumbnail to View/Download
the Expression Barchart for All Samples Please Click the above Thumbnail to View/Download
the Expression Barchart for All Samples
|
||||
| ICD-11: 04 Disease of the immune system | |||||
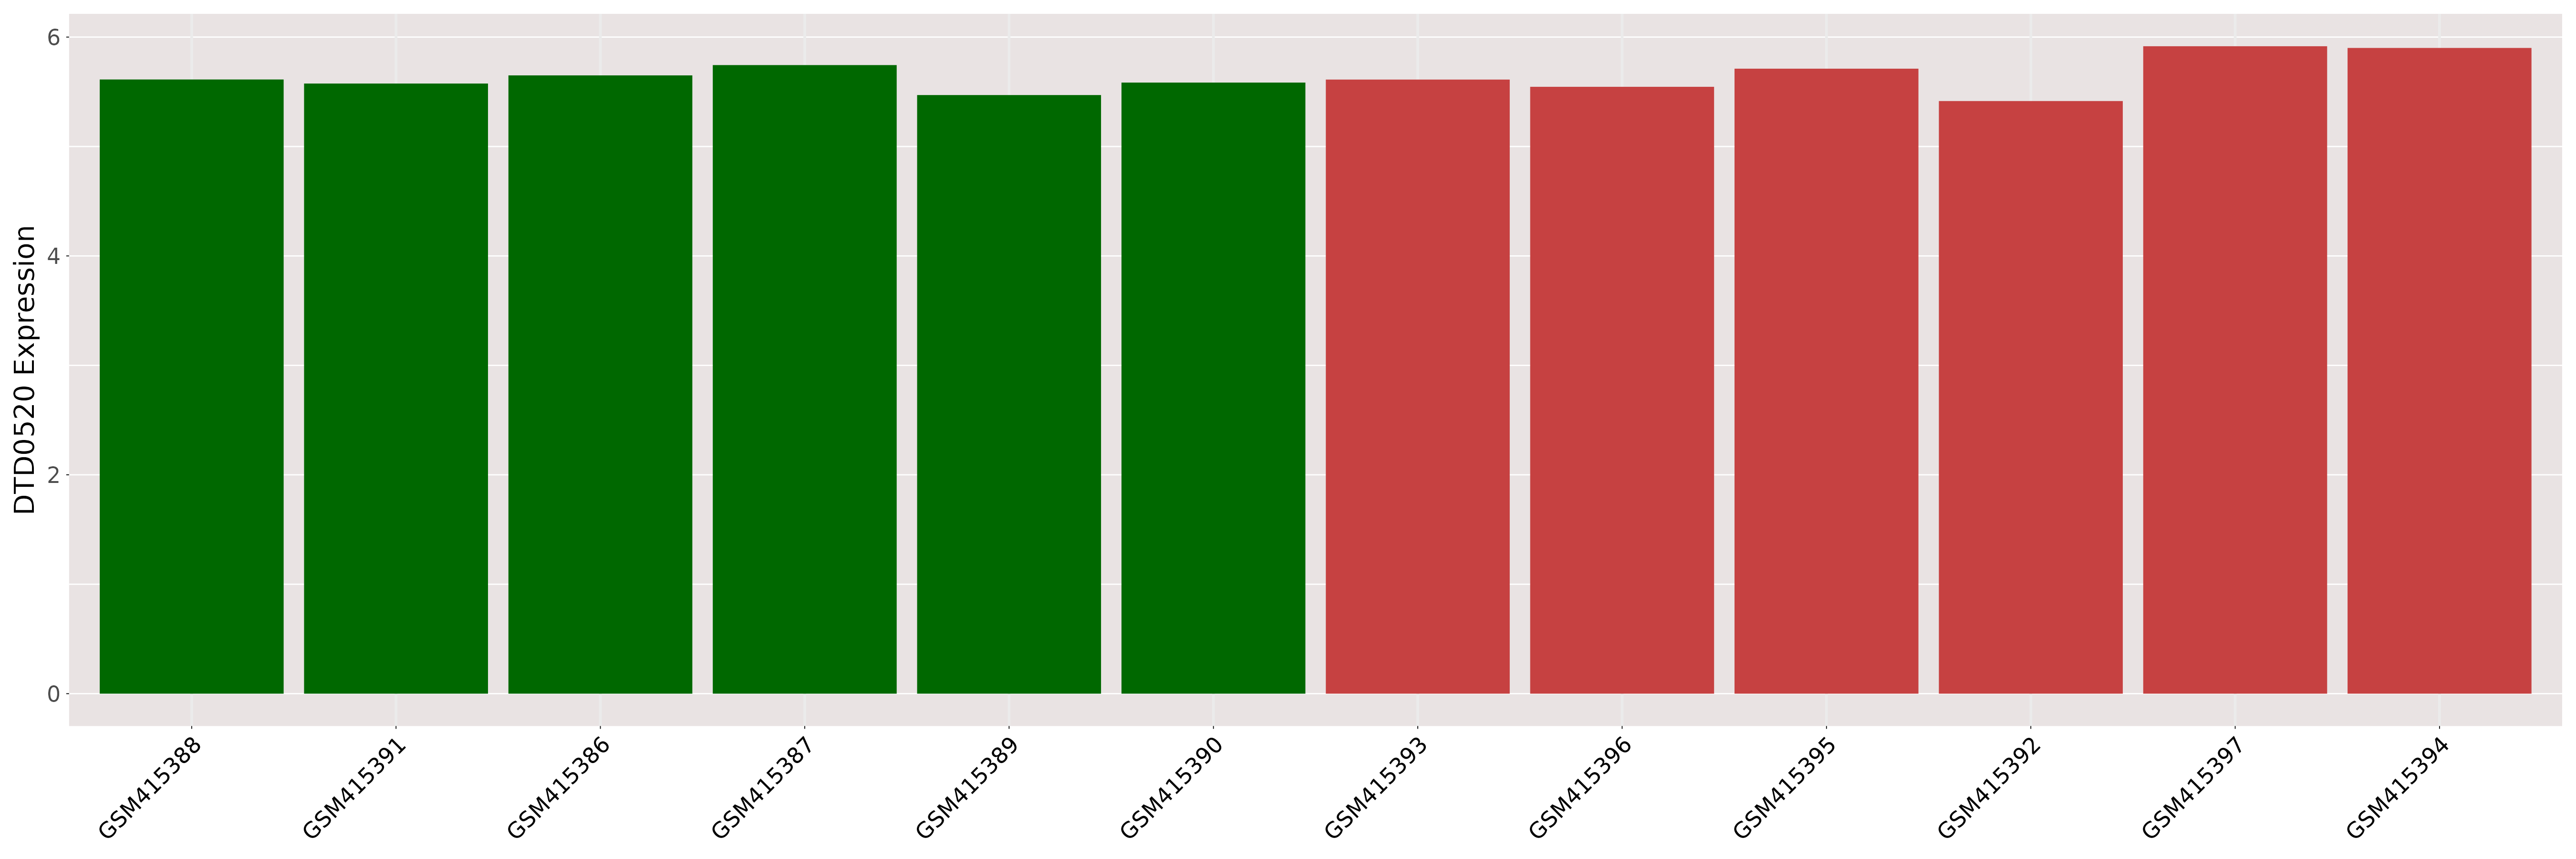
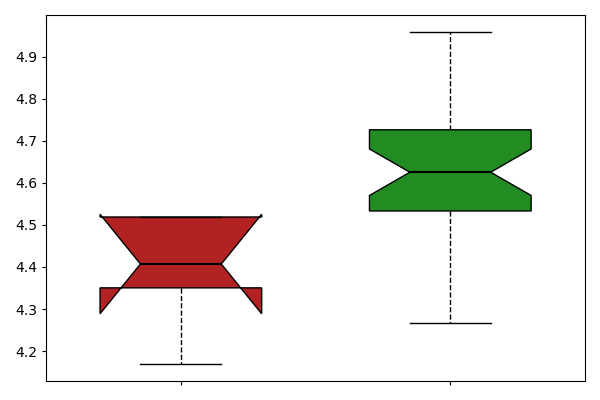
| [+] ICD-11: 4A41.0 Dermatomyositis | Click to Show/Hide the Full List | ||||
| The Studied Tissue | Skeletal muscle | ||||
| The Specified Disease | Dermatomyositis [ICD-11:4A41.00] | ||||
| The Expression Level of Disease Section Compare with the Healthy Individual Tissue | p-value:0.2867961347722856; Fold-change:0.9912735494021402; Z-score:-0.9606548 | ||||
| DT expression in the diseased tissue of patients
DT expression in the normal tissue of healthy individuals
|
|||||
|
 Please Click the above Thumbnail to View/Download
the Expression Barchart for All Samples Please Click the above Thumbnail to View/Download
the Expression Barchart for All Samples
|
||||
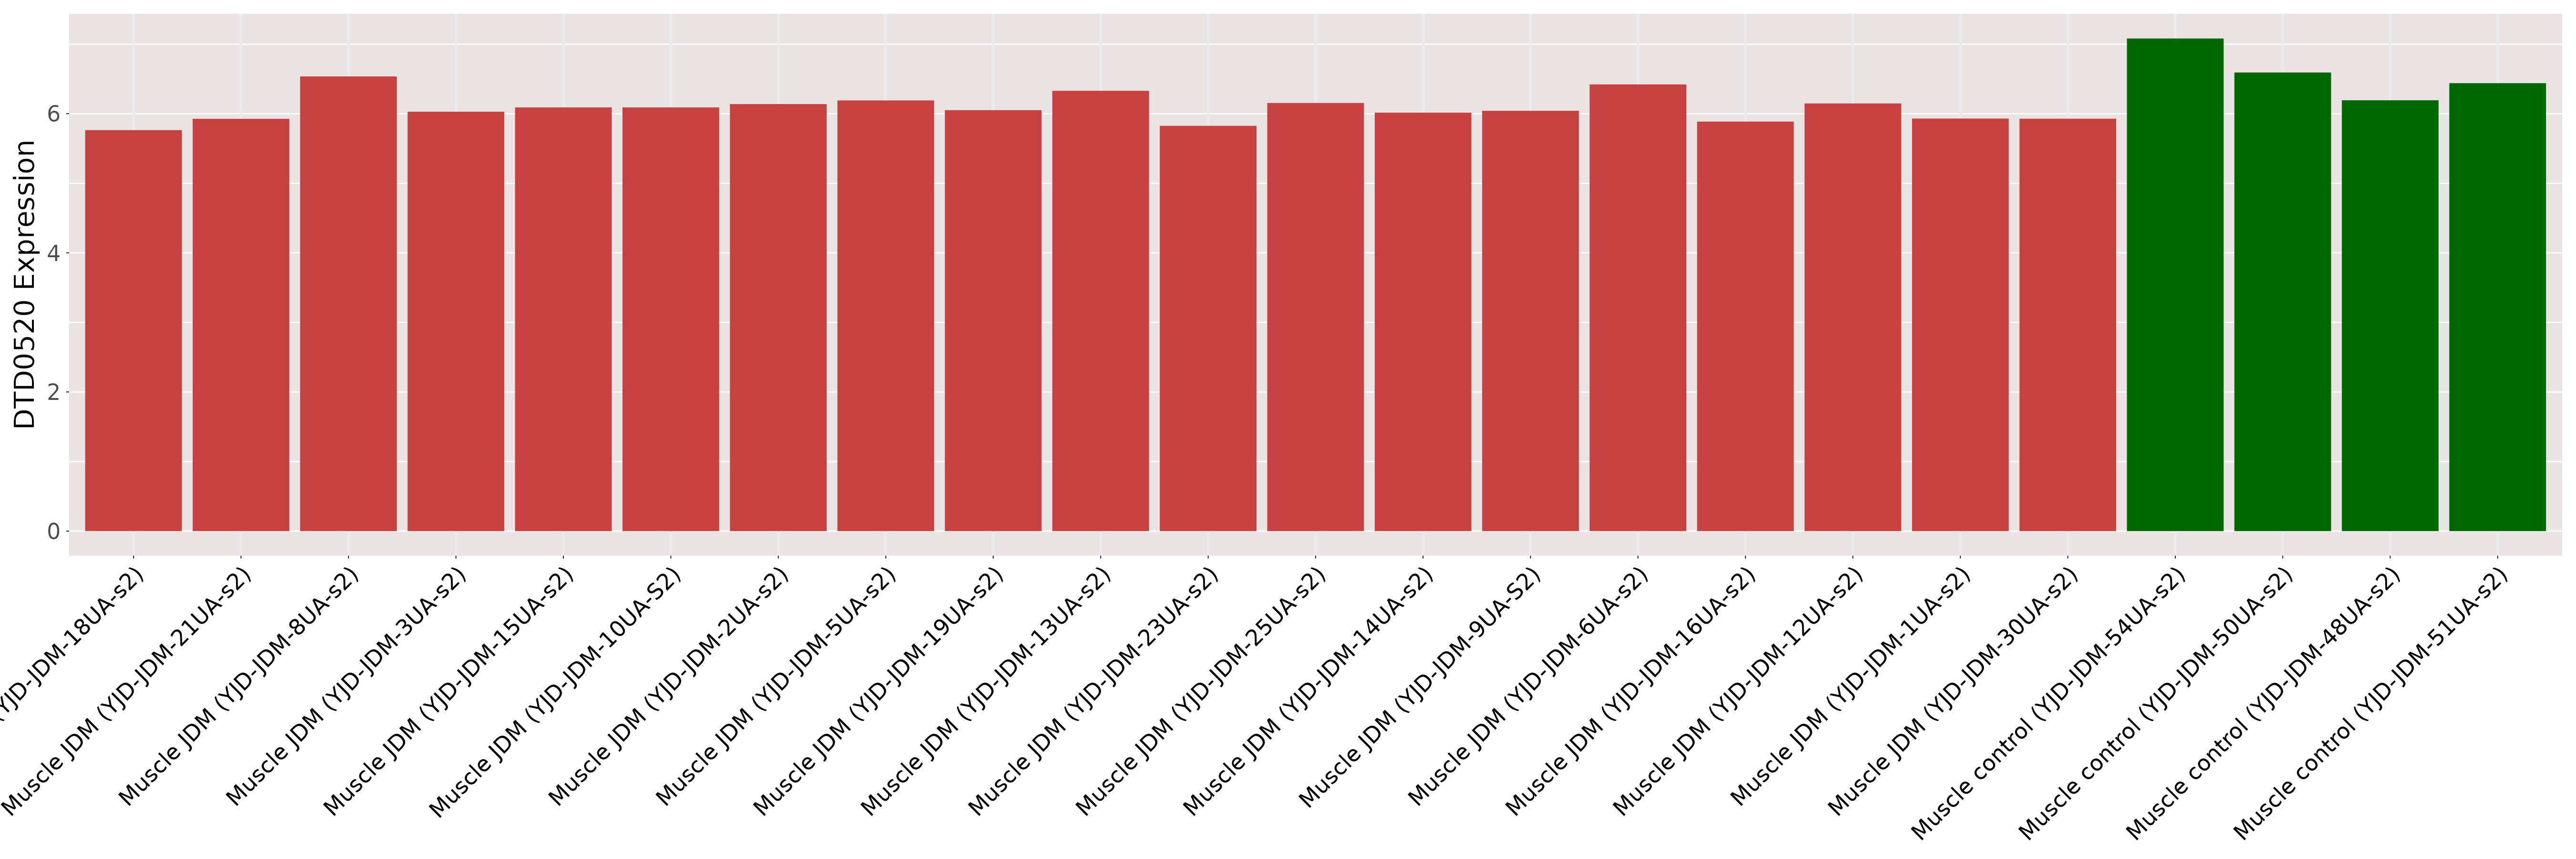
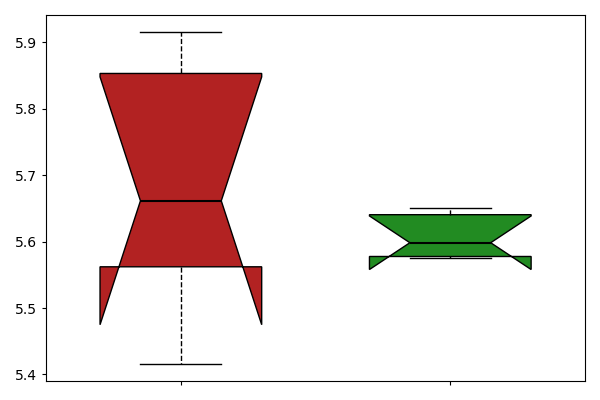
| [+] ICD-11: 4A41.0 Dermatomyositis (juvenile form) | Click to Show/Hide the Full List | ||||
| The Studied Tissue | Skeletal muscle organ | ||||
| The Specified Disease | Juvenile dermatomyositis [ICD-11:4A41.01] | ||||
| The Expression Level of Disease Section Compare with the Healthy Individual Tissue | p-value:0.0007716577096137; Fold-change:0.928694974265546; Z-score:-1.32834969 | ||||
| DT expression in the diseased tissue of patients
DT expression in the normal tissue of healthy individuals
|
|||||
|
 Please Click the above Thumbnail to View/Download
the Expression Barchart for All Samples Please Click the above Thumbnail to View/Download
the Expression Barchart for All Samples
|
||||
| [+] ICD-11: 4B20 Sarcoidosis | Click to Show/Hide the Full List | ||||
| The Studied Tissue | Lung | ||||
| The Specified Disease | Sarcoidosis [ICD-11:4B20] | ||||
| The Expression Level of Disease Section Compare with the Healthy Individual Tissue | p-value:0.4060927363126198; Fold-change:1.0112745395689644; Z-score:0.8560946332861894 | ||||
| DT expression in the diseased tissue of patients
DT expression in the normal tissue of healthy individuals
|
|||||
|
 Please Click the above Thumbnail to View/Download
the Expression Barchart for All Samples Please Click the above Thumbnail to View/Download
the Expression Barchart for All Samples
|
||||
| ICD-11: 05 Endocrine, nutritional or metabolic disease | |||||
| [+] ICD-11: 5A11 Type 2 diabetes mellitus | Click to Show/Hide the Full List | ||||
| The Studied Tissue | Skeletal muscle | ||||
| The Specified Disease | Type 2 diabetes [ICD-11:5A11] | ||||
| The Expression Level of Disease Section Compare with the Healthy Individual Tissue | p-value:0.1318528141472625; Fold-change:0.9528097595351273; Z-score:-0.755632393 | ||||
| DT expression in the diseased tissue of patients
DT expression in the normal tissue of healthy individuals
|
|||||
|
 Please Click the above Thumbnail to View/Download
the Expression Barchart for All Samples Please Click the above Thumbnail to View/Download
the Expression Barchart for All Samples
|
||||
| The Studied Tissue | Islet of langerhans | ||||
| The Specified Disease | Type ii diabetes mellitus [ICD-11:5A11] | ||||
| The Expression Level of Disease Section Compare with the Healthy Individual Tissue | p-value:0.9032151794257478; Fold-change:0.6; Z-score:0.0944911182523068 | ||||
| DT expression in the diseased tissue of patients
DT expression in the normal tissue of healthy individuals
|
|||||
|
 Please Click the above Thumbnail to View/Download
the Expression Barchart for All Samples Please Click the above Thumbnail to View/Download
the Expression Barchart for All Samples
|
||||
| [+] ICD-11: 5A11.2 Type 2 diabetes mellitus with diabetic nephropathy | Click to Show/Hide the Full List | ||||
| The Studied Tissue | Kidney | ||||
| The Specified Disease | Diabetic nephropathy [ICD-11:5A11.1] | ||||
| The Expression Level of Disease Section Compare with the Healthy Individual Tissue | p-value:0.3218191051254315; Fold-change:1.0333271710213705; Z-score:0.9942097889795024 | ||||
| DT expression in the diseased tissue of patients
DT expression in the normal tissue of healthy individuals
|
|||||
|
 Please Click the above Thumbnail to View/Download
the Expression Barchart for All Samples Please Click the above Thumbnail to View/Download
the Expression Barchart for All Samples
|
||||
| [+] ICD-11: 5A14 Diabetes mellitus, type unspecified | Click to Show/Hide the Full List | ||||
| The Studied Tissue | Skeletal muscle | ||||
| The Specified Disease | Diabetes mellitus [ICD-11:5A14] | ||||
| The Expression Level of Disease Section Compare with the Healthy Individual Tissue | p-value:0.1981611967560366; Fold-change:1.1011991432356023; Z-score:0.7707356700505965 | ||||
| DT expression in the diseased tissue of patients
DT expression in the normal tissue of healthy individuals
|
|||||
|
 Please Click the above Thumbnail to View/Download
the Expression Barchart for All Samples Please Click the above Thumbnail to View/Download
the Expression Barchart for All Samples
|
||||
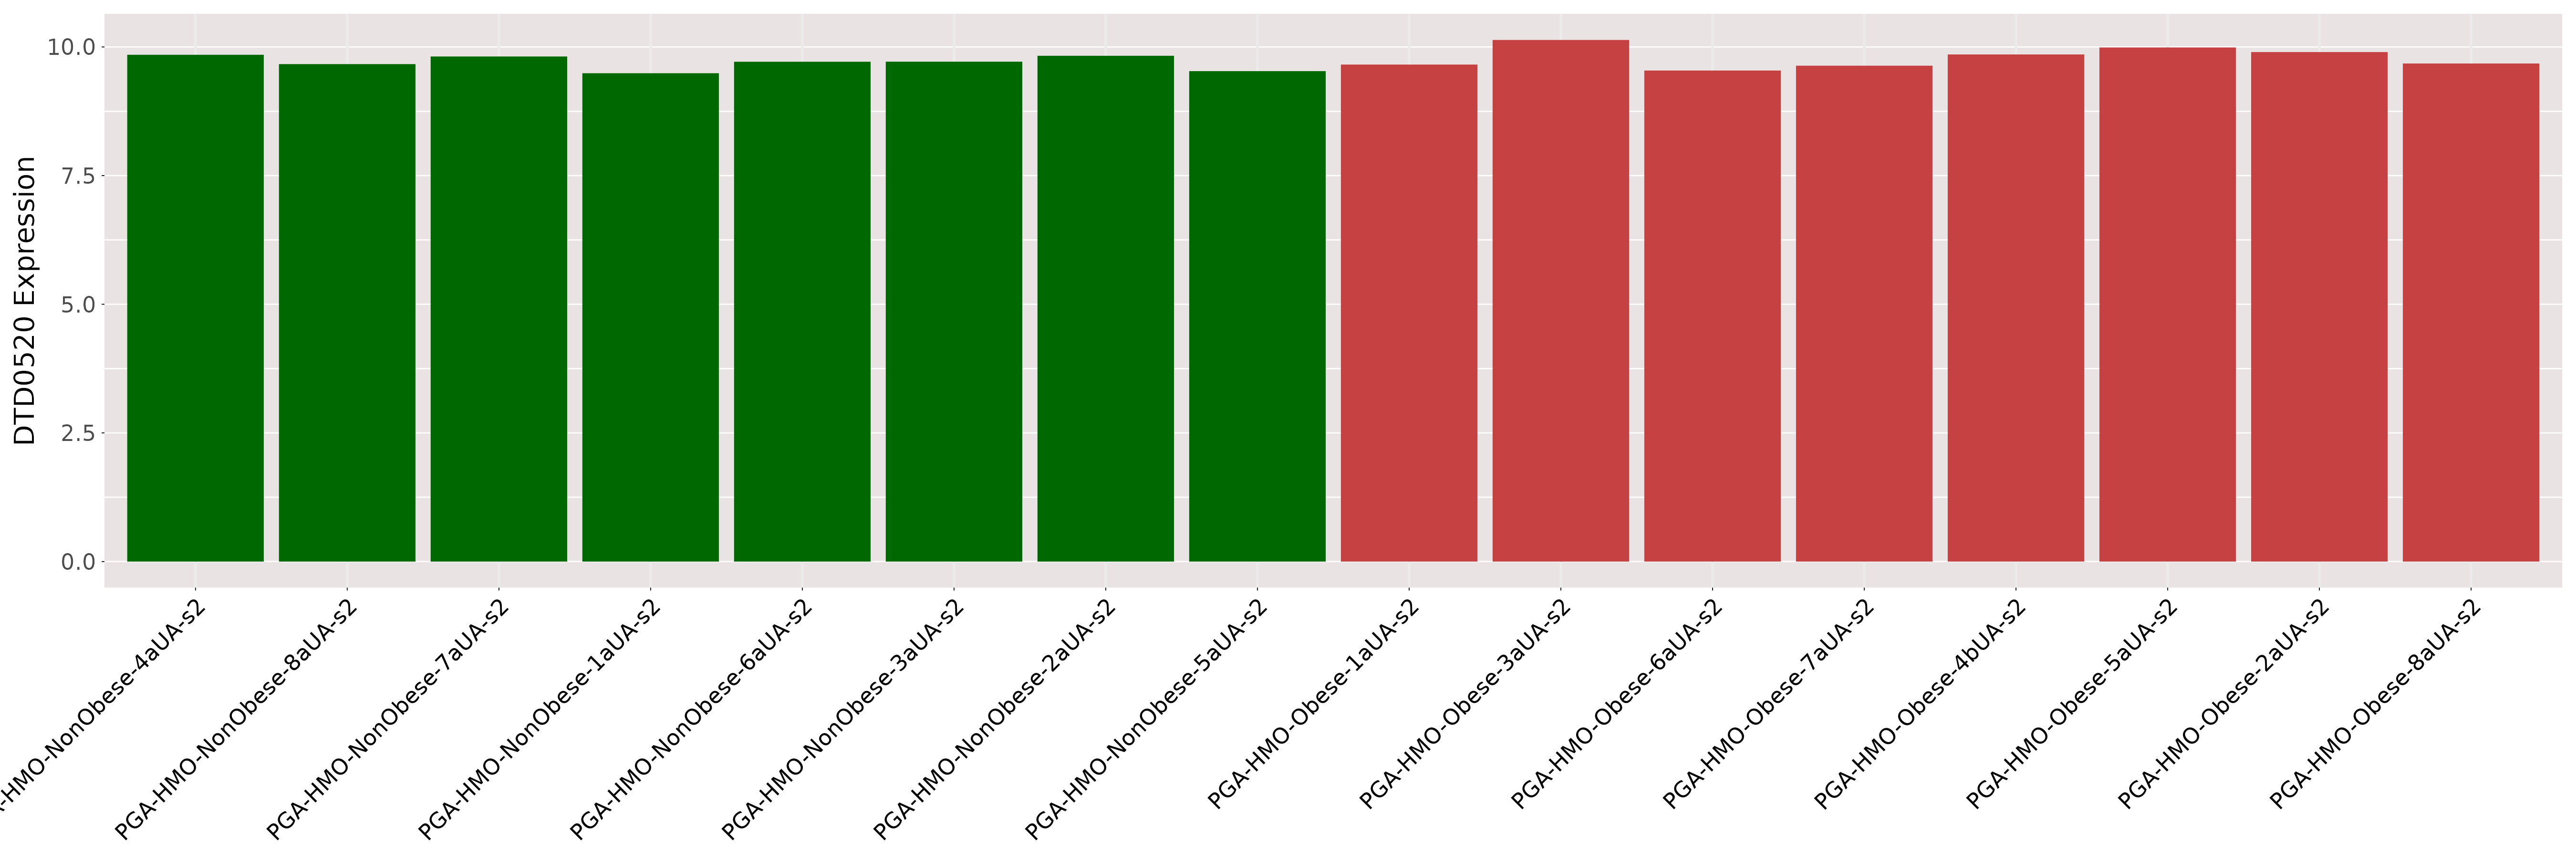
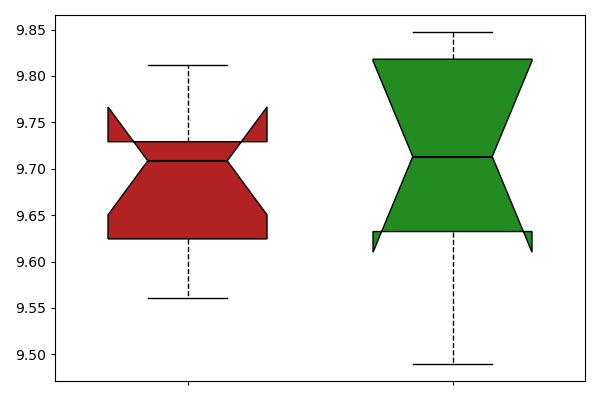
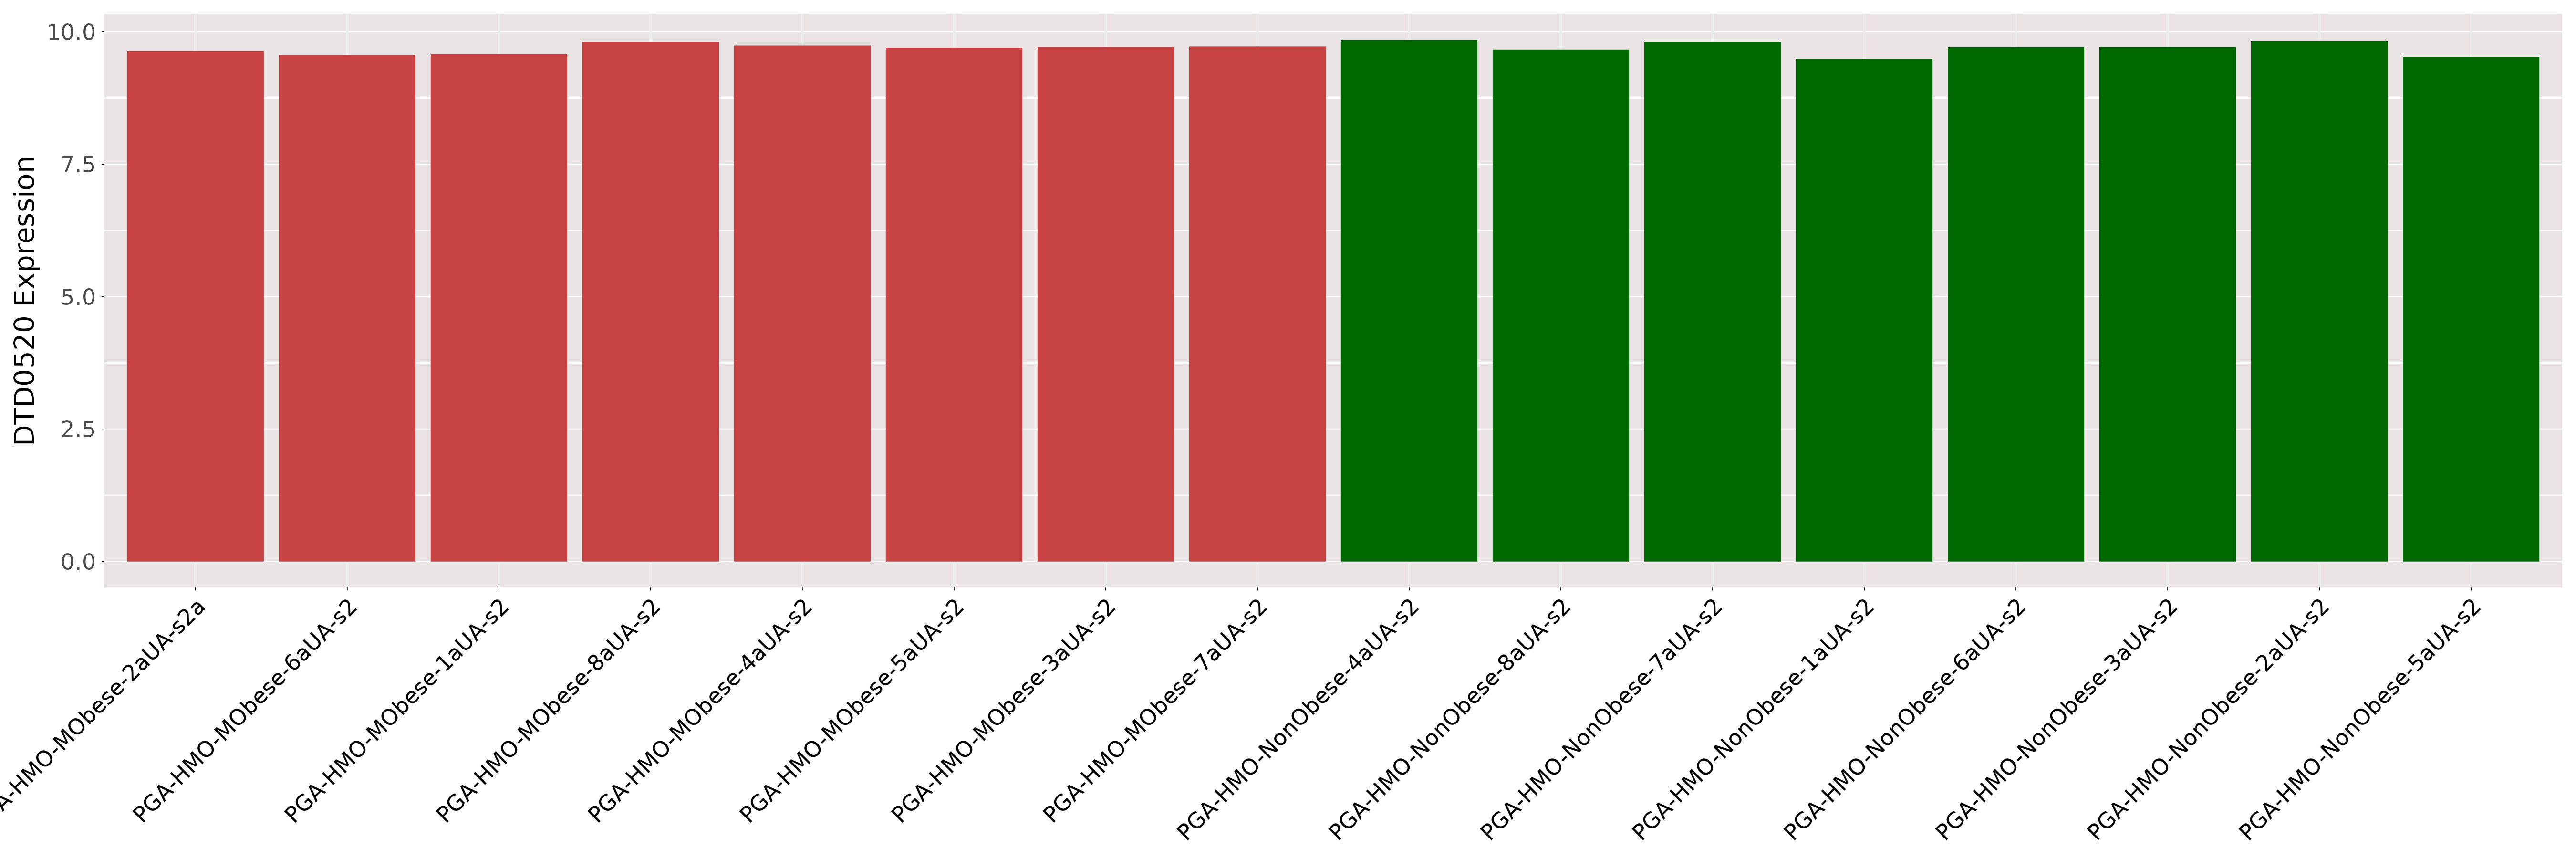
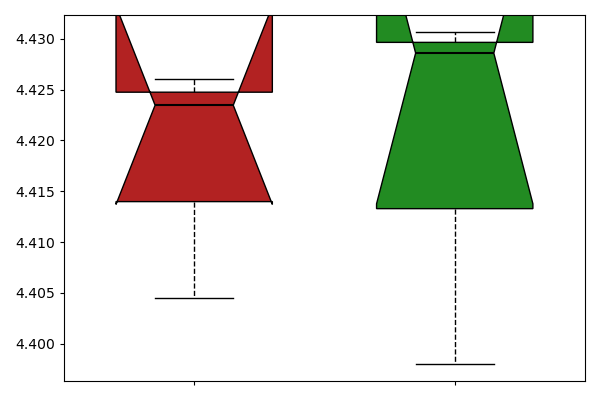
| [+] ICD-11: 5B81 Obesity | Click to Show/Hide the Full List | ||||
| The Studied Tissue | Skeletal muscle | ||||
| The Specified Disease | Obesity [ICD-11:5B81] | ||||
| The Expression Level of Disease Section Compare with the Healthy Individual Tissue | p-value:0.2714987343776899; Fold-change:1.0054569335341796; Z-score:0.7355351434299009 | ||||
| DT expression in the diseased tissue of patients
DT expression in the normal tissue of healthy individuals
|
|||||
|
 Please Click the above Thumbnail to View/Download
the Expression Barchart for All Samples Please Click the above Thumbnail to View/Download
the Expression Barchart for All Samples
|
||||
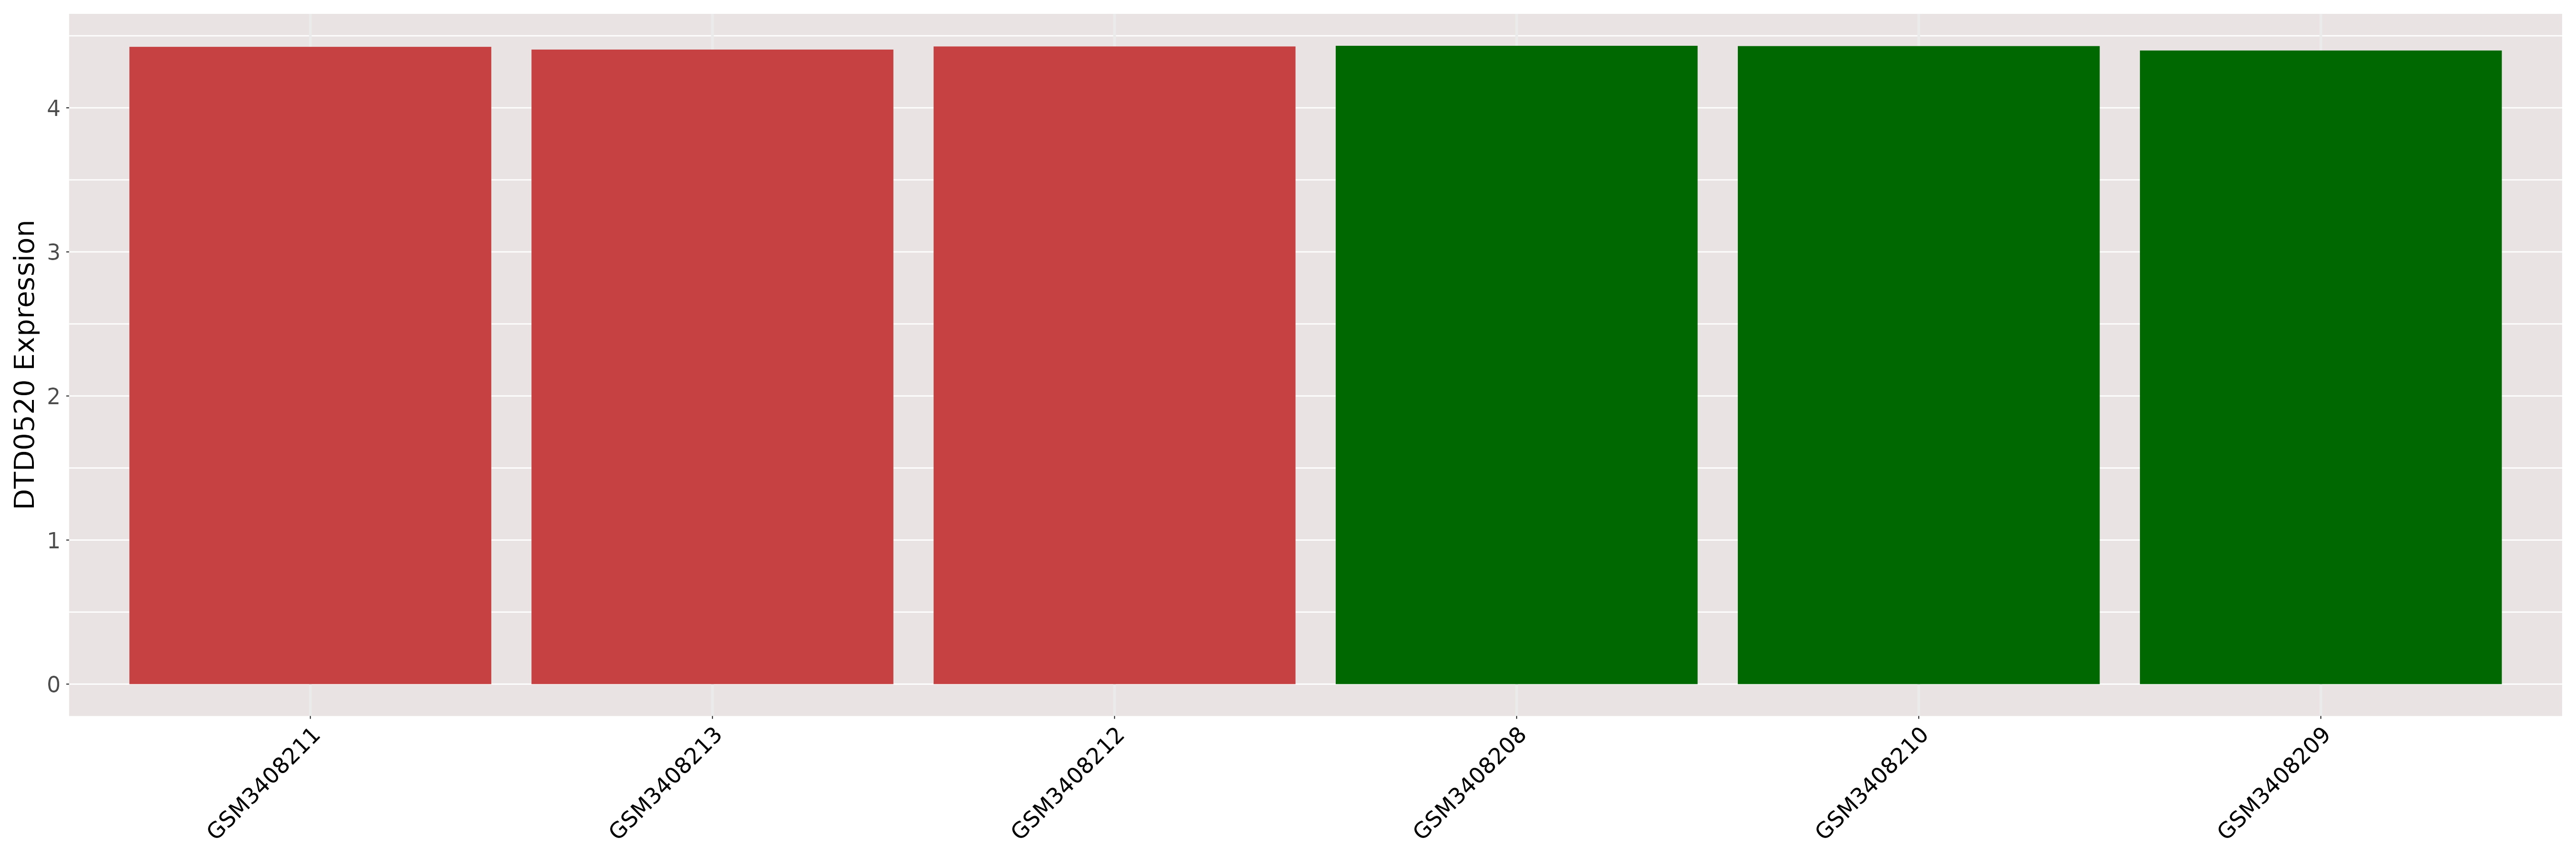
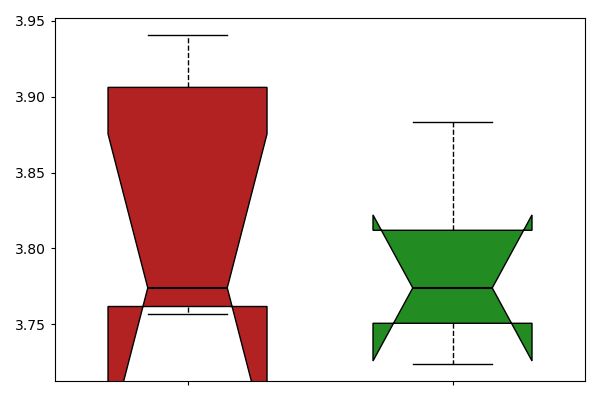
| [+] ICD-11: 5B81 Obesity (morbid obesity) | Click to Show/Hide the Full List | ||||
| The Studied Tissue | Skeletal muscle | ||||
| The Specified Disease | Morbidly obese [ICD-11:5B81] | ||||
| The Expression Level of Disease Section Compare with the Healthy Individual Tissue | p-value:0.7760622911040658; Fold-change:0.9995257489352336; Z-score:-0.121724731 | ||||
| DT expression in the diseased tissue of patients
DT expression in the normal tissue of healthy individuals
|
|||||
|
 Please Click the above Thumbnail to View/Download
the Expression Barchart for All Samples Please Click the above Thumbnail to View/Download
the Expression Barchart for All Samples
|
||||
| [+] ICD-11: 5C50.E0 Classical organic aciduria (Methylmalonic acidemia) | Click to Show/Hide the Full List | ||||
| The Studied Tissue | Kidney | ||||
| The Specified Disease | Methylmalonic acidemia [ICD-11:5C50.E0] | ||||
| The Expression Level of Disease Section Compare with the Healthy Individual Tissue | p-value:0.9346234731864448; Fold-change:0.9988429078992946; Z-score:-0.059908125 | ||||
| DT expression in the diseased tissue of patients
DT expression in the normal tissue of healthy individuals
|
|||||
|
 Please Click the above Thumbnail to View/Download
the Expression Barchart for All Samples Please Click the above Thumbnail to View/Download
the Expression Barchart for All Samples
|
||||
| [+] ICD-11: 5C56.0Y Gaucher disease (non-neuronopathic Type 1) | Click to Show/Hide the Full List | ||||
| The Studied Tissue | Skin | ||||
| The Specified Disease | Gaucher disease type 1 [ICD-11:5C56.0Y] | ||||
| The Expression Level of Disease Section Compare with the Healthy Individual Tissue | p-value:0.4908810485084404; Fold-change:1.0000154943449204; Z-score:0.5736124889065608 | ||||
| DT expression in the diseased tissue of patients
DT expression in the normal tissue of healthy individuals
|
|||||
|
 Please Click the above Thumbnail to View/Download
the Expression Barchart for All Samples Please Click the above Thumbnail to View/Download
the Expression Barchart for All Samples
|
||||
| [+] ICD-11: 5C56.0Y Gaucher disease (subacute neuronopathic Type 3) | Click to Show/Hide the Full List | ||||
| The Studied Tissue | Skin | ||||
| The Specified Disease | Gaucher disease type 3 [ICD-11:5C56.0Y] | ||||
| The Expression Level of Disease Section Compare with the Healthy Individual Tissue | p-value:0.1312041389532235; Fold-change:1.0168190497305742; Z-score:0.9336905373412951 | ||||
| DT expression in the diseased tissue of patients
DT expression in the normal tissue of healthy individuals
|
|||||
|
 Please Click the above Thumbnail to View/Download
the Expression Barchart for All Samples Please Click the above Thumbnail to View/Download
the Expression Barchart for All Samples
|
||||
| [+] ICD-11: 5C57.1 X-linked adrenoleukodystrophy | Click to Show/Hide the Full List | ||||
| The Studied Tissue | Dermis | ||||
| The Specified Disease | X linked cerebral adrenoleukodystrophy [ICD-11:5C57.1] | ||||
| The Expression Level of Disease Section Compare with the Healthy Individual Tissue | p-value:0.0644698516551335; Fold-change:0.9269213318849012; Z-score:-1.915583129 | ||||
| DT expression in the diseased tissue of patients
DT expression in the normal tissue of healthy individuals
|
|||||
|
 Please Click the above Thumbnail to View/Download
the Expression Barchart for All Samples Please Click the above Thumbnail to View/Download
the Expression Barchart for All Samples
|
||||
| ICD-11: 06 Mental, behavioural or neurodevelopmental disorder | |||||
| [+] ICD-11: 6A02 Autism spectrum disorder | Click to Show/Hide the Full List | ||||
| The Studied Tissue | Brain | ||||
| The Specified Disease | Autism [ICD-11:6A02] | ||||
| The Expression Level of Disease Section Compare with the Healthy Individual Tissue | p-value:0.0042733052531261; Fold-change:0.197841726618705; Z-score:-3.804147723 | ||||
| DT expression in the diseased tissue of patients
DT expression in the normal tissue of healthy individuals
|
|||||
|
 Please Click the above Thumbnail to View/Download
the Expression Barchart for All Samples Please Click the above Thumbnail to View/Download
the Expression Barchart for All Samples
|
||||
| [+] ICD-11: 6A20 Schizophrenia | Click to Show/Hide the Full List | ||||
| The Studied Tissue | Brodmann (1909) area 9 | ||||
| The Specified Disease | Schizophrenia [ICD-11:6A20] | ||||
| The Expression Level of Disease Section Compare with the Healthy Individual Tissue | p-value:0.6830794002050329; Fold-change:1.0140105078809107; Z-score:0.2855467281740264 | ||||
| DT expression in the diseased tissue of patients
DT expression in the normal tissue of healthy individuals
|
|||||
_area_9-1.png)
|
_area_9.png) Please Click the above Thumbnail to View/Download
the Expression Barchart for All Samples Please Click the above Thumbnail to View/Download
the Expression Barchart for All Samples
|
||||
| The Studied Tissue | Brodmann (1909) area 11 | ||||
| The Specified Disease | Schizophrenia [ICD-11:6A20] | ||||
| The Expression Level of Disease Section Compare with the Healthy Individual Tissue | p-value:0.5385840389655804; Fold-change:0.9467455621301776; Z-score:-0.216063766 | ||||
| DT expression in the diseased tissue of patients
DT expression in the normal tissue of healthy individuals
|
|||||
_area_11-1.png)
|
_area_11.png) Please Click the above Thumbnail to View/Download
the Expression Barchart for All Samples Please Click the above Thumbnail to View/Download
the Expression Barchart for All Samples
|
||||
| The Studied Tissue | Brodmann (1909) area 24 | ||||
| The Specified Disease | Schizophrenia [ICD-11:6A20] | ||||
| The Expression Level of Disease Section Compare with the Healthy Individual Tissue | p-value:0.0037524517333973; Fold-change:0.4017094017094017; Z-score:-1.644797831 | ||||
| DT expression in the diseased tissue of patients
DT expression in the normal tissue of healthy individuals
|
|||||
_area_24-1.png)
|
_area_24.png) Please Click the above Thumbnail to View/Download
the Expression Barchart for All Samples Please Click the above Thumbnail to View/Download
the Expression Barchart for All Samples
|
||||
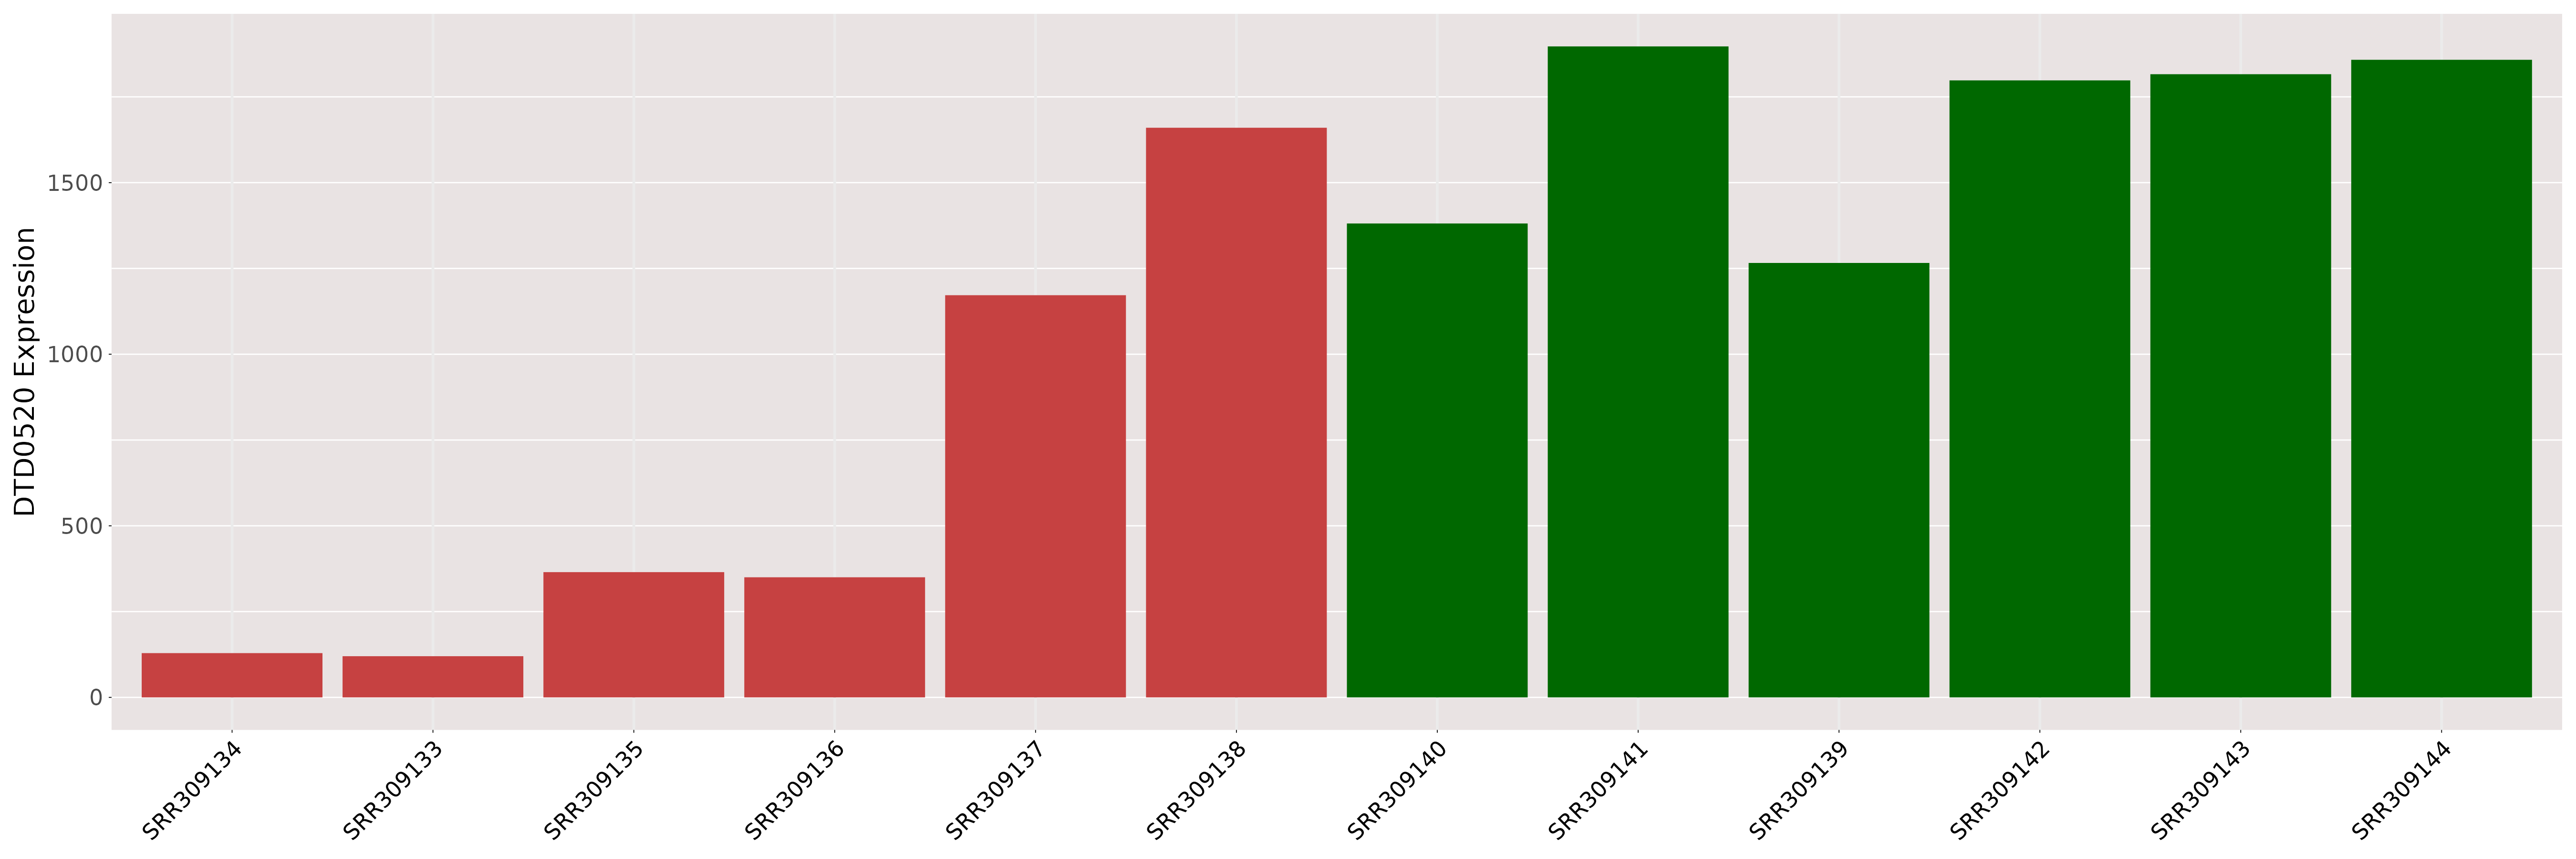
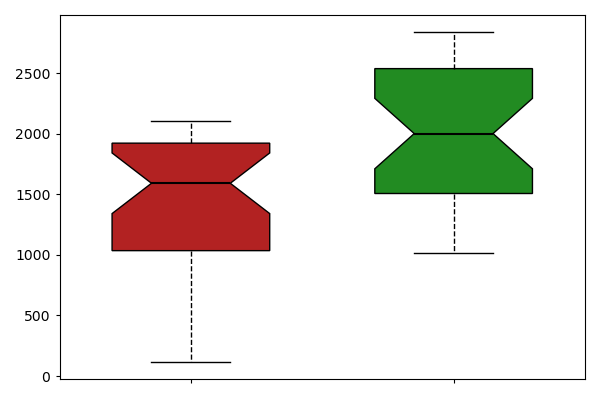
| [+] ICD-11: 6A60 Bipolar type I disorder (Bipolar disorder) | Click to Show/Hide the Full List | ||||
| The Studied Tissue | Brodmann (1909) area 9 | ||||
| The Specified Disease | Bipolar disorder [ICD-11:6A60] | ||||
| The Expression Level of Disease Section Compare with the Healthy Individual Tissue | p-value:0.7216937178618359; Fold-change:1.1453590192644485; Z-score:0.5695443782566944 | ||||
| DT expression in the diseased tissue of patients
DT expression in the normal tissue of healthy individuals
|
|||||
_area_9-1.png)
|
_area_9.png) Please Click the above Thumbnail to View/Download
the Expression Barchart for All Samples Please Click the above Thumbnail to View/Download
the Expression Barchart for All Samples
|
||||
| The Studied Tissue | Brodmann (1909) area 11 | ||||
| The Specified Disease | Bipolar disorder [ICD-11:6A60] | ||||
| The Expression Level of Disease Section Compare with the Healthy Individual Tissue | p-value:0.0472411816607376; Fold-change:0.8994082840236687; Z-score:-0.823345375 | ||||
| DT expression in the diseased tissue of patients
DT expression in the normal tissue of healthy individuals
|
|||||
_area_11-1.png)
|
_area_11.png) Please Click the above Thumbnail to View/Download
the Expression Barchart for All Samples Please Click the above Thumbnail to View/Download
the Expression Barchart for All Samples
|
||||
| The Studied Tissue | Brodmann (1909) area 24 | ||||
| The Specified Disease | Bipolar disorder [ICD-11:6A60] | ||||
| The Expression Level of Disease Section Compare with the Healthy Individual Tissue | p-value:0.1272594941072413; Fold-change:0.7122507122507122; Z-score:-0.916233536 | ||||
| DT expression in the diseased tissue of patients
DT expression in the normal tissue of healthy individuals
|
|||||
_area_24-1.png)
|
_area_24.png) Please Click the above Thumbnail to View/Download
the Expression Barchart for All Samples Please Click the above Thumbnail to View/Download
the Expression Barchart for All Samples
|
||||
| The Studied Tissue | Dorsolateral prefrontal cortex | ||||
| The Specified Disease | Bipolar disorder [ICD-11:6A60] | ||||
| The Expression Level of Disease Section Compare with the Healthy Individual Tissue | p-value:0.2922795635090375; Fold-change:0.7951024487756122; Z-score:-0.241080106 | ||||
| DT expression in the diseased tissue of patients
DT expression in the normal tissue of healthy individuals
|
|||||
|
 Please Click the above Thumbnail to View/Download
the Expression Barchart for All Samples Please Click the above Thumbnail to View/Download
the Expression Barchart for All Samples
|
||||
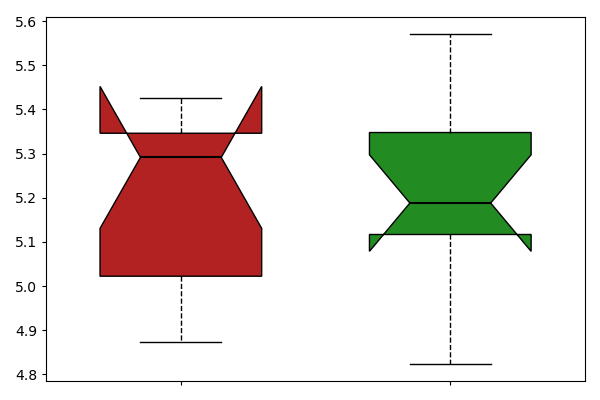
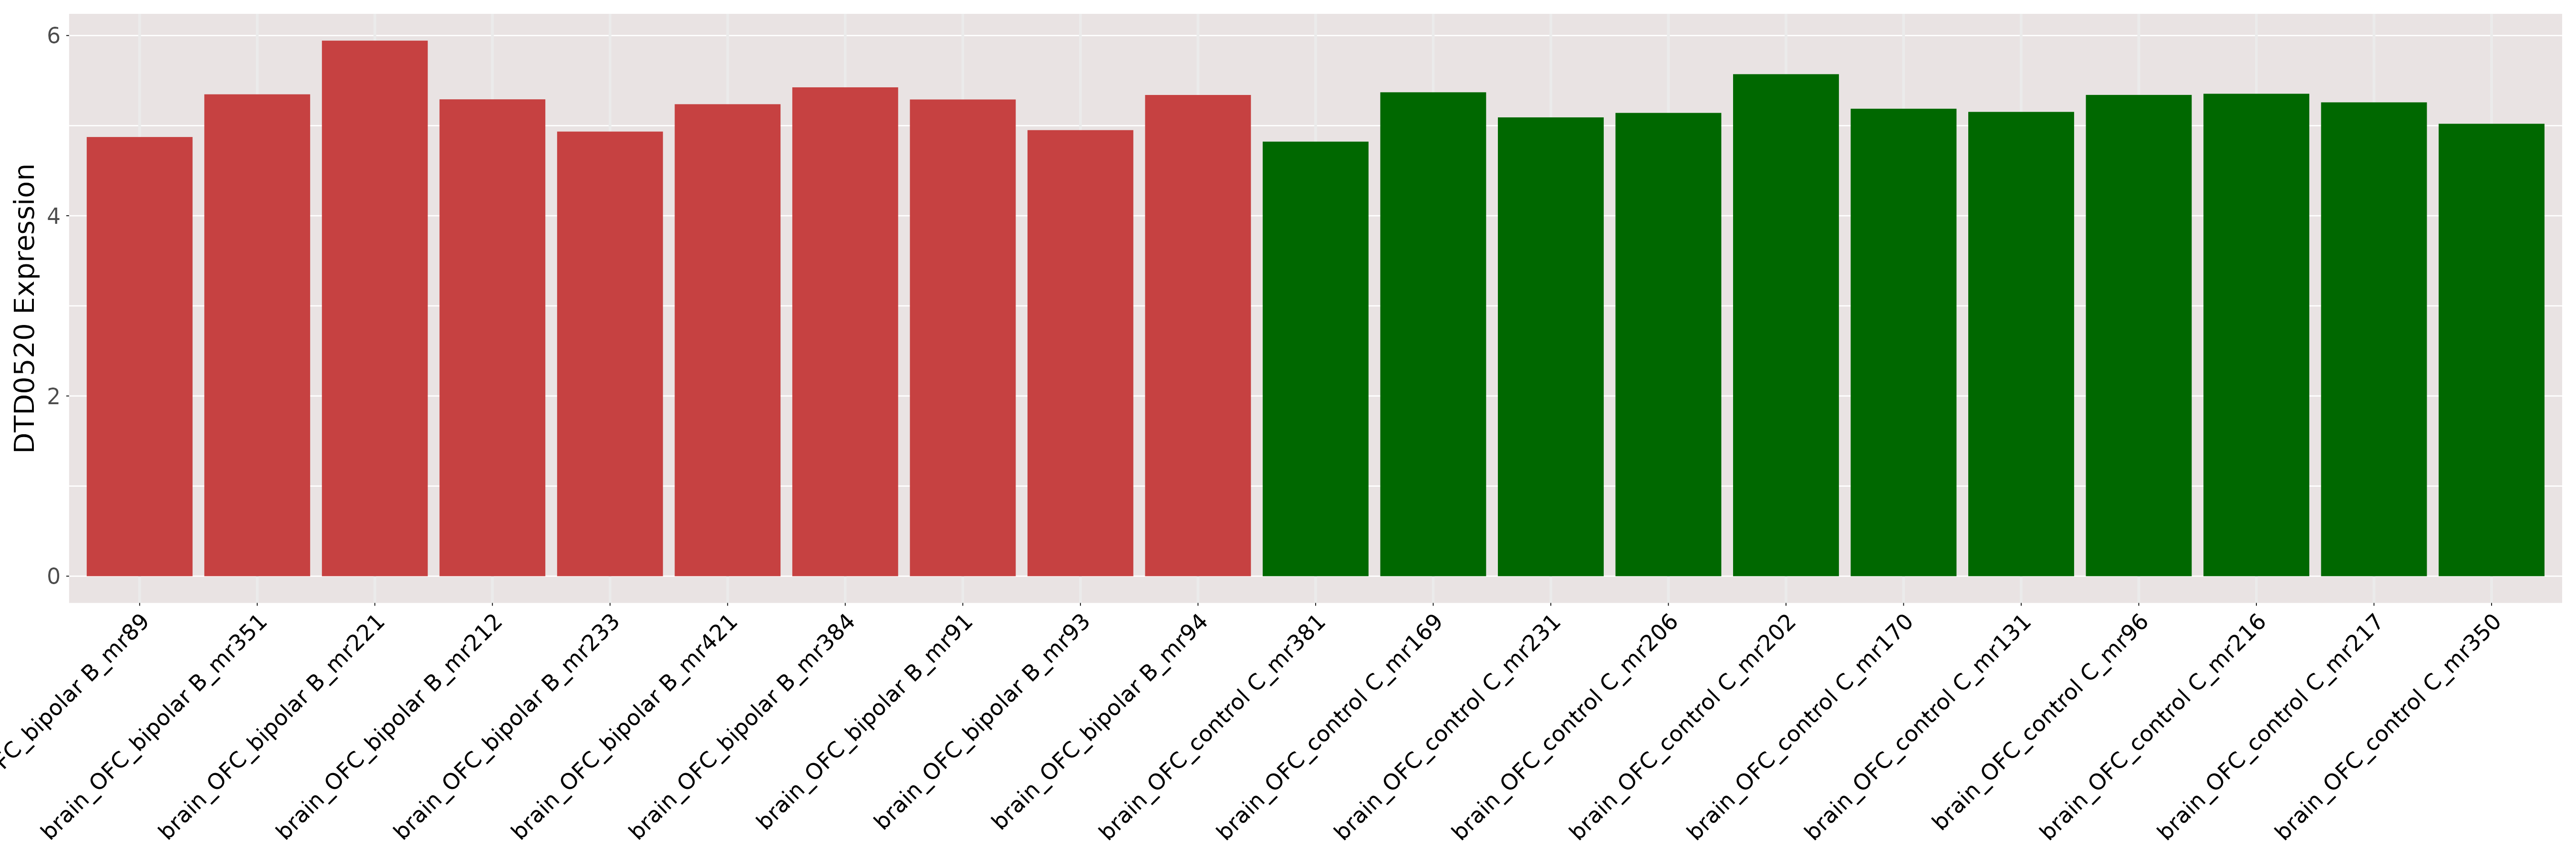
| The Studied Tissue | Orbitofrontal cortex | ||||
| The Specified Disease | Bipolar disorder [ICD-11:6A60] | ||||
| The Expression Level of Disease Section Compare with the Healthy Individual Tissue | p-value:0.6416787543001357; Fold-change:1.0199346841867178; Z-score:0.2652069364480429 | ||||
| DT expression in the diseased tissue of patients
DT expression in the normal tissue of healthy individuals
|
|||||
|
 Please Click the above Thumbnail to View/Download
the Expression Barchart for All Samples Please Click the above Thumbnail to View/Download
the Expression Barchart for All Samples
|
||||
| ICD-11: 08 Disease of the nervous system | |||||
| [+] ICD-11: 8A20 Alzheimer disease | Click to Show/Hide the Full List | ||||
| The Studied Tissue | Frontal cortex | ||||
| The Specified Disease | Alzheimer's disease [ICD-11:8A20] | ||||
| The Expression Level of Disease Section Compare with the Healthy Individual Tissue | p-value:0.4809970085389592; Fold-change:0.9865183462017104; Z-score:-0.215225992 | ||||
| DT expression in the diseased tissue of patients
DT expression in the normal tissue of healthy individuals
|
|||||
|
 Please Click the above Thumbnail to View/Download
the Expression Barchart for All Samples Please Click the above Thumbnail to View/Download
the Expression Barchart for All Samples
|
||||
| The Studied Tissue | Hippocampus | ||||
| The Specified Disease | Alzheimer's disease [ICD-11:8A20] | ||||
| The Expression Level of Disease Section Compare with the Healthy Individual Tissue | p-value:0.1021792797385778; Fold-change:0.963374112202456; Z-score:-0.721188303 | ||||
| DT expression in the diseased tissue of patients
DT expression in the normal tissue of healthy individuals
|
|||||
|
 Please Click the above Thumbnail to View/Download
the Expression Barchart for All Samples Please Click the above Thumbnail to View/Download
the Expression Barchart for All Samples
|
||||
| The Studied Tissue | Middle temporal gyrus | ||||
| The Specified Disease | Alzheimer's disease [ICD-11:8A20] | ||||
| The Expression Level of Disease Section Compare with the Healthy Individual Tissue | p-value:0.0145333729649209; Fold-change:0.922035643810948; Z-score:-1.563075407 | ||||
| DT expression in the diseased tissue of patients
DT expression in the normal tissue of healthy individuals
|
|||||
|
 Please Click the above Thumbnail to View/Download
the Expression Barchart for All Samples Please Click the above Thumbnail to View/Download
the Expression Barchart for All Samples
|
||||
| The Studied Tissue | Postcentral gyrus | ||||
| The Specified Disease | Alzheimer's disease [ICD-11:8A20] | ||||
| The Expression Level of Disease Section Compare with the Healthy Individual Tissue | p-value:0.134080233984343; Fold-change:0.9794224775673118; Z-score:-0.478210682 | ||||
| DT expression in the diseased tissue of patients
DT expression in the normal tissue of healthy individuals
|
|||||
|
 Please Click the above Thumbnail to View/Download
the Expression Barchart for All Samples Please Click the above Thumbnail to View/Download
the Expression Barchart for All Samples
|
||||
| The Studied Tissue | Posterior cingulate cortex | ||||
| The Specified Disease | Alzheimer's disease [ICD-11:8A20] | ||||
| The Expression Level of Disease Section Compare with the Healthy Individual Tissue | p-value:0.1875218337993467; Fold-change:0.9343133734621618; Z-score:-0.661165546 | ||||
| DT expression in the diseased tissue of patients
DT expression in the normal tissue of healthy individuals
|
|||||
|
 Please Click the above Thumbnail to View/Download
the Expression Barchart for All Samples Please Click the above Thumbnail to View/Download
the Expression Barchart for All Samples
|
||||
| The Studied Tissue | Primary visual cortex | ||||
| The Specified Disease | Alzheimer's disease [ICD-11:8A20] | ||||
| The Expression Level of Disease Section Compare with the Healthy Individual Tissue | p-value:0.1951587616014756; Fold-change:0.9995124027164414; Z-score:-0.936876133 | ||||
| DT expression in the diseased tissue of patients
DT expression in the normal tissue of healthy individuals
|
|||||
|
 Please Click the above Thumbnail to View/Download
the Expression Barchart for All Samples Please Click the above Thumbnail to View/Download
the Expression Barchart for All Samples
|
||||
| The Studied Tissue | Superior frontal gyrus | ||||
| The Specified Disease | Alzheimer's disease [ICD-11:8A20] | ||||
| The Expression Level of Disease Section Compare with the Healthy Individual Tissue | p-value:0.0390437002529664; Fold-change:0.9748289818559238; Z-score:-0.5954563 | ||||
| DT expression in the diseased tissue of patients
DT expression in the normal tissue of healthy individuals
|
|||||
|
 Please Click the above Thumbnail to View/Download
the Expression Barchart for All Samples Please Click the above Thumbnail to View/Download
the Expression Barchart for All Samples
|
||||
| The Studied Tissue | Temporal cortex | ||||
| The Specified Disease | Alzheimer's disease [ICD-11:8A20] | ||||
| The Expression Level of Disease Section Compare with the Healthy Individual Tissue | p-value:0.0078642668603514; Fold-change:0.982706013845894; Z-score:-1.008498139 | ||||
| DT expression in the diseased tissue of patients
DT expression in the normal tissue of healthy individuals
|
|||||
|
 Please Click the above Thumbnail to View/Download
the Expression Barchart for All Samples Please Click the above Thumbnail to View/Download
the Expression Barchart for All Samples
|
||||
| [+] ICD-11: 8B44.0 Hereditary spastic paraplegia | Click to Show/Hide the Full List | ||||
| The Studied Tissue | Skeletal muscle | ||||
| The Specified Disease | Hereditary spastic paraplegia [ICD-11:8B44.0] | ||||
| The Expression Level of Disease Section Compare with the Healthy Individual Tissue | p-value:0.1911715082709346; Fold-change:1.0246920734101177; Z-score:0.7276606770437163 | ||||
| DT expression in the diseased tissue of patients
DT expression in the normal tissue of healthy individuals
|
|||||
|
 Please Click the above Thumbnail to View/Download
the Expression Barchart for All Samples Please Click the above Thumbnail to View/Download
the Expression Barchart for All Samples
|
||||
| [+] ICD-11: 8B60.0 Amyotrophic lateral sclerosis | Click to Show/Hide the Full List | ||||
| The Studied Tissue | Skeletal muscle | ||||
| The Specified Disease | Amyotrophic lateral sclerosis [ICD-11:8B60.0] | ||||
| The Expression Level of Disease Section Compare with the Healthy Individual Tissue | p-value:0.1348681477704388; Fold-change:0.9809931467437332; Z-score:-0.568404371 | ||||
| DT expression in the diseased tissue of patients
DT expression in the normal tissue of healthy individuals
|
|||||
|
 Please Click the above Thumbnail to View/Download
the Expression Barchart for All Samples Please Click the above Thumbnail to View/Download
the Expression Barchart for All Samples
|
||||
| [+] ICD-11: 8C70.1 Duchenne muscular dystrophy | Click to Show/Hide the Full List | ||||
| The Studied Tissue | Skeletal muscle | ||||
| The Specified Disease | Duchenne muscular dystrophy [ICD-11:8C70.1] | ||||
| The Expression Level of Disease Section Compare with the Healthy Individual Tissue | p-value:0.3066572615047698; Fold-change:0.9756819732956756; Z-score:-0.423313256 | ||||
| DT expression in the diseased tissue of patients
DT expression in the normal tissue of healthy individuals
|
|||||
|
 Please Click the above Thumbnail to View/Download
the Expression Barchart for All Samples Please Click the above Thumbnail to View/Download
the Expression Barchart for All Samples
|
||||
| [+] ICD-11: 8C70.1 Duchenne/Becker muscular dystrophy | Click to Show/Hide the Full List | ||||
| The Studied Tissue | Skeletal muscle | ||||
| The Specified Disease | Becker muscular dystrophy [ICD-11:8C70.0] | ||||
| The Expression Level of Disease Section Compare with the Healthy Individual Tissue | p-value:0.3087077877273552; Fold-change:1.0161974290785971; Z-score:0.5970272691577457 | ||||
| DT expression in the diseased tissue of patients
DT expression in the normal tissue of healthy individuals
|
|||||
|
 Please Click the above Thumbnail to View/Download
the Expression Barchart for All Samples Please Click the above Thumbnail to View/Download
the Expression Barchart for All Samples
|
||||
| [+] ICD-11: 8C70.2 Emery-Dreifuss muscular dystrophy | Click to Show/Hide the Full List | ||||
| The Studied Tissue | Skeletal muscle | ||||
| The Specified Disease | Autosomal dominant emery dreifuss muscular dystrophy [ICD-11:8C70.2] | ||||
| The Expression Level of Disease Section Compare with the Healthy Individual Tissue | p-value:0.2408089220761229; Fold-change:0.987225466706426; Z-score:-0.673282392 | ||||
| DT expression in the diseased tissue of patients
DT expression in the normal tissue of healthy individuals
|
|||||
|
 Please Click the above Thumbnail to View/Download
the Expression Barchart for All Samples Please Click the above Thumbnail to View/Download
the Expression Barchart for All Samples
|
||||
| The Studied Tissue | Skeletal muscle | ||||
| The Specified Disease | X linked recessive emery dreifuss muscular dystrophy [ICD-11:8C70.2] | ||||
| The Expression Level of Disease Section Compare with the Healthy Individual Tissue | p-value:0.4426610895383415; Fold-change:0.990586256629002; Z-score:-0.404687447 | ||||
| DT expression in the diseased tissue of patients
DT expression in the normal tissue of healthy individuals
|
|||||
|
 Please Click the above Thumbnail to View/Download
the Expression Barchart for All Samples Please Click the above Thumbnail to View/Download
the Expression Barchart for All Samples
|
||||
| [+] ICD-11: 8C70.3 Facioscapulohumeral muscular dystrophy | Click to Show/Hide the Full List | ||||
| The Studied Tissue | Muscle | ||||
| The Specified Disease | Facioscapulohumeral dystrophy [ICD-11:8C70.3] | ||||
| The Expression Level of Disease Section Compare with the Healthy Individual Tissue | p-value:0.4251001953834731; Fold-change:1; Z-score:6.708768085880579 | ||||
| DT expression in the diseased tissue of patients
DT expression in the normal tissue of healthy individuals
|
|||||
|
 Please Click the above Thumbnail to View/Download
the Expression Barchart for All Samples Please Click the above Thumbnail to View/Download
the Expression Barchart for All Samples
|
||||
| The Studied Tissue | Myoblast | ||||
| The Specified Disease | Facioscapulohumeral dystrophy [ICD-11:8C70.3] | ||||
| The Expression Level of Disease Section Compare with the Healthy Individual Tissue | p-value:0.8440769126849244; Fold-change:0.3947368421052631; Z-score:0.2651650429449553 | ||||
| DT expression in the diseased tissue of patients
DT expression in the normal tissue of healthy individuals
|
|||||
|
 Please Click the above Thumbnail to View/Download
the Expression Barchart for All Samples Please Click the above Thumbnail to View/Download
the Expression Barchart for All Samples
|
||||
| The Studied Tissue | Myotube | ||||
| The Specified Disease | Facioscapulohumeral dystrophy [ICD-11:8C70.3] | ||||
| The Expression Level of Disease Section Compare with the Healthy Individual Tissue | p-value:0.3248702548266611; Fold-change:3.25; Z-score:4.206451021267201 | ||||
| DT expression in the diseased tissue of patients
DT expression in the normal tissue of healthy individuals
|
|||||
|
 Please Click the above Thumbnail to View/Download
the Expression Barchart for All Samples Please Click the above Thumbnail to View/Download
the Expression Barchart for All Samples
|
||||
| The Studied Tissue | Skeletal muscle | ||||
| The Specified Disease | Fascioscapulohumeral muscular dystrophy [ICD-11:8C70.3] | ||||
| The Expression Level of Disease Section Compare with the Healthy Individual Tissue | p-value:0.0006517071791642; Fold-change:0.9621088398965846; Z-score:-1.225666573 | ||||
| DT expression in the diseased tissue of patients
DT expression in the normal tissue of healthy individuals
|
|||||
| [+] ICD-11: 8C70.4 Limb-girdle muscular dystrophy | Click to Show/Hide the Full List | ||||
| The Studied Tissue | Skeletal muscle | ||||
| The Specified Disease | Limb girdle muscular dystrophy 2a [ICD-11:8C70.4] | ||||
| The Expression Level of Disease Section Compare with the Healthy Individual Tissue | p-value:0.912971857764528; Fold-change:1.0112606311243435; Z-score:0.0449039363728015 | ||||
| DT expression in the diseased tissue of patients
DT expression in the normal tissue of healthy individuals
|
|||||
|
 Please Click the above Thumbnail to View/Download
the Expression Barchart for All Samples Please Click the above Thumbnail to View/Download
the Expression Barchart for All Samples
|
||||
| The Studied Tissue | Skeletal muscle | ||||
| The Specified Disease | Limb girdle muscular dystrophy 2b [ICD-11:8C70.4] | ||||
| The Expression Level of Disease Section Compare with the Healthy Individual Tissue | p-value:0.15940570943631; Fold-change:1.017248429080242; Z-score:0.619860121302671 | ||||
| DT expression in the diseased tissue of patients
DT expression in the normal tissue of healthy individuals
|
|||||
|
 Please Click the above Thumbnail to View/Download
the Expression Barchart for All Samples Please Click the above Thumbnail to View/Download
the Expression Barchart for All Samples
|
||||
| The Studied Tissue | Skeletal muscle | ||||
| The Specified Disease | Limb girdle muscular dystrophy 2i [ICD-11:8C70.4] | ||||
| The Expression Level of Disease Section Compare with the Healthy Individual Tissue | p-value:0.0899308336263468; Fold-change:1.0250857541285388; Z-score:0.7533564051086424 | ||||
| DT expression in the diseased tissue of patients
DT expression in the normal tissue of healthy individuals
|
|||||
|
 Please Click the above Thumbnail to View/Download
the Expression Barchart for All Samples Please Click the above Thumbnail to View/Download
the Expression Barchart for All Samples
|
||||
| [+] ICD-11: 8C71.0 Myotonic dystrophy | Click to Show/Hide the Full List | ||||
| The Studied Tissue | Heart left ventricle | ||||
| The Specified Disease | Myotonic dystrophy [ICD-11:8C71.0] | ||||
| The Expression Level of Disease Section Compare with the Healthy Individual Tissue | p-value:0.5705471122591003; Fold-change:2.2; Z-score:-0.361634688 | ||||
| DT expression in the diseased tissue of patients
DT expression in the normal tissue of healthy individuals
|
|||||
|
 Please Click the above Thumbnail to View/Download
the Expression Barchart for All Samples Please Click the above Thumbnail to View/Download
the Expression Barchart for All Samples
|
||||
| [+] ICD-11: 8C81 Critical illness myopathy (acute quadriplegic myopathy) | Click to Show/Hide the Full List | ||||
| The Studied Tissue | Skeletal muscle | ||||
| The Specified Disease | Acute quadriplegic myopathy [ICD-11:8C81] | ||||
| The Expression Level of Disease Section Compare with the Healthy Individual Tissue | p-value:0.0030387014850976; Fold-change:0.9473795839636738; Z-score:-1.646047076 | ||||
| DT expression in the diseased tissue of patients
DT expression in the normal tissue of healthy individuals
|
|||||
|
 Please Click the above Thumbnail to View/Download
the Expression Barchart for All Samples Please Click the above Thumbnail to View/Download
the Expression Barchart for All Samples
|
||||
| ICD-11: 11 Disease of the circulatory system | |||||
| [+] ICD-11: BA8Z Diseases of coronary artery, unspecified (coronary artery disease) | Click to Show/Hide the Full List | ||||
| The Studied Tissue | Epicardial fat | ||||
| The Specified Disease | Coronary artery disease [ICD-11:BA8Z] | ||||
| The Expression Level of Disease Section Compare with the Healthy Individual Tissue | p-value:0.0482695034545562; Fold-change:0.974735050960792; Z-score:-0.867405674 | ||||
| DT expression in the diseased tissue of patients
DT expression in the normal tissue of healthy individuals
|
|||||
|
 Please Click the above Thumbnail to View/Download
the Expression Barchart for All Samples Please Click the above Thumbnail to View/Download
the Expression Barchart for All Samples
|
||||
| The Studied Tissue | Subcutaneous adipose tissue | ||||
| The Specified Disease | Coronary artery disease [ICD-11:BA8Z] | ||||
| The Expression Level of Disease Section Compare with the Healthy Individual Tissue | p-value:0.2554366427216699; Fold-change:0.9986735031105348; Z-score:-0.614015596 | ||||
| DT expression in the diseased tissue of patients
DT expression in the normal tissue of healthy individuals
|
|||||
|
 Please Click the above Thumbnail to View/Download
the Expression Barchart for All Samples Please Click the above Thumbnail to View/Download
the Expression Barchart for All Samples
|
||||
| [+] ICD-11: BD10 Congestive heart failure | Click to Show/Hide the Full List | ||||
| The Studied Tissue | Skeletal muscle tissue | ||||
| The Specified Disease | Heart failure [ICD-11:BD10] | ||||
| The Expression Level of Disease Section Compare with the Healthy Individual Tissue | p-value:0.9649472833740356; Fold-change:0.5; Z-score:-0.029717715 | ||||
| DT expression in the diseased tissue of patients
DT expression in the normal tissue of healthy individuals
|
|||||
|
 Please Click the above Thumbnail to View/Download
the Expression Barchart for All Samples Please Click the above Thumbnail to View/Download
the Expression Barchart for All Samples
|
||||
| [+] ICD-11: BD10 Congestive heart failure (post-ischemic) | Click to Show/Hide the Full List | ||||
| The Studied Tissue | Left ventricle | ||||
| The Specified Disease | Post ischemic heart failure [ICD-11:BD10] | ||||
| The Expression Level of Disease Section Compare with the Healthy Individual Tissue | p-value:0.6357071976702474; Fold-change:0.9983017591750012; Z-score:-0.311154869 | ||||
| DT expression in the diseased tissue of patients
DT expression in the normal tissue of healthy individuals
|
|||||
|
 Please Click the above Thumbnail to View/Download
the Expression Barchart for All Samples Please Click the above Thumbnail to View/Download
the Expression Barchart for All Samples
|
||||
| ICD-11: 13 Disease of the digestive system | |||||
| [+] ICD-11: DB91 Acute or subacute hepatic failure | Click to Show/Hide the Full List | ||||
| The Studied Tissue | Liver | ||||
| The Specified Disease | Acute liver failure [ICD-11:DB91.Z] | ||||
| The Expression Level of Disease Section Compare with the Healthy Individual Tissue | p-value:0.2599035896082318; Fold-change:0.9897631316251444; Z-score:-0.323949917 | ||||
| DT expression in the diseased tissue of patients
DT expression in the normal tissue of healthy individuals
|
|||||
|
 Please Click the above Thumbnail to View/Download
the Expression Barchart for All Samples Please Click the above Thumbnail to View/Download
the Expression Barchart for All Samples
|
||||
| [+] ICD-11: DB92.1 Non-alcoholic steatohepatitis | Click to Show/Hide the Full List | ||||
| The Studied Tissue | Liver | ||||
| The Specified Disease | Non alcoholic steatohepatitis [ICD-11:DB92.1] | ||||
| The Expression Level of Disease Section Compare with the Healthy Individual Tissue | p-value:0.9424292488707718; Fold-change:0.997652748681784; Z-score:-0.031670725 | ||||
| DT expression in the diseased tissue of patients
DT expression in the normal tissue of healthy individuals
|
|||||
|
 Please Click the above Thumbnail to View/Download
the Expression Barchart for All Samples Please Click the above Thumbnail to View/Download
the Expression Barchart for All Samples
|
||||
| [+] ICD-11: DD70 Crohn disease | Click to Show/Hide the Full List | ||||
| The Studied Tissue | Ileum | ||||
| The Specified Disease | Crohn's disease [ICD-11:DD70.Z] | ||||
| The Expression Level of Disease Section Compare with the Healthy Individual Tissue | p-value:0.0002154215267658; Fold-change:1.6842105263157894; Z-score:1.20080429962233 | ||||
| DT expression in the diseased tissue of patients
DT expression in the normal tissue of healthy individuals
|
|||||
|
 Please Click the above Thumbnail to View/Download
the Expression Barchart for All Samples Please Click the above Thumbnail to View/Download
the Expression Barchart for All Samples
|
||||
| The Studied Tissue | Colonic mucosa | ||||
| The Specified Disease | Crohn's disease [ICD-11:DD70.Z] | ||||
| The Expression Level of Disease Section Compare with the Healthy Individual Tissue | p-value:0.0733736075061537; Fold-change:1.018749945959096; Z-score:1.0790606469838946 | ||||
| DT expression in the diseased tissue of patients
DT expression in the normal tissue of healthy individuals
|
|||||
|
 Please Click the above Thumbnail to View/Download
the Expression Barchart for All Samples Please Click the above Thumbnail to View/Download
the Expression Barchart for All Samples
|
||||
| The Studied Tissue | Ileal mucosa | ||||
| The Specified Disease | Crohn's disease [ICD-11:DD70.Z] | ||||
| The Expression Level of Disease Section Compare with the Healthy Individual Tissue | p-value:0.3892977795413794; Fold-change:1.0071320389652043; Z-score:0.2141670798689237 | ||||
| DT expression in the diseased tissue of patients
DT expression in the normal tissue of healthy individuals
|
|||||
|
 Please Click the above Thumbnail to View/Download
the Expression Barchart for All Samples Please Click the above Thumbnail to View/Download
the Expression Barchart for All Samples
|
||||
| [+] ICD-11: DD71 Ulcerative colitis | Click to Show/Hide the Full List | ||||
| The Studied Tissue | Caecum | ||||
| The Specified Disease | Active ulcerative colitis [ICD-11:DD71.Z] | ||||
| The Expression Level of Disease Section Compare with the Healthy Individual Tissue | p-value:0.927738512057352; Fold-change:0.997805237060225; Z-score:-0.135339308 | ||||
| DT expression in the diseased tissue of patients
DT expression in the normal tissue of healthy individuals
|
|||||
|
 Please Click the above Thumbnail to View/Download
the Expression Barchart for All Samples Please Click the above Thumbnail to View/Download
the Expression Barchart for All Samples
|
||||
| The Studied Tissue | Left colon | ||||
| The Specified Disease | Active ulcerative colitis [ICD-11:DD71.Z] | ||||
| The Expression Level of Disease Section Compare with the Healthy Individual Tissue | p-value:0.9803039941342164; Fold-change:0.9856330852653684; Z-score:-0.018156086 | ||||
| DT expression in the diseased tissue of patients
DT expression in the normal tissue of healthy individuals
|
|||||
|
 Please Click the above Thumbnail to View/Download
the Expression Barchart for All Samples Please Click the above Thumbnail to View/Download
the Expression Barchart for All Samples
|
||||
| The Studied Tissue | Rectum | ||||
| The Specified Disease | Active ulcerative colitis [ICD-11:DD71.Z] | ||||
| The Expression Level of Disease Section Compare with the Healthy Individual Tissue | p-value:0.209039589807624; Fold-change:1.0875945841397625; Z-score:1.6578332843630967 | ||||
| DT expression in the diseased tissue of patients
DT expression in the normal tissue of healthy individuals
|
|||||
|
 Please Click the above Thumbnail to View/Download
the Expression Barchart for All Samples Please Click the above Thumbnail to View/Download
the Expression Barchart for All Samples
|
||||
| The Studied Tissue | Transverse colon | ||||
| The Specified Disease | Active ulcerative colitis [ICD-11:DD71.Z] | ||||
| The Expression Level of Disease Section Compare with the Healthy Individual Tissue | p-value:0.9893697275594382; Fold-change:1.013120161342406; Z-score:0.0143069889777944 | ||||
| DT expression in the diseased tissue of patients
DT expression in the normal tissue of healthy individuals
|
|||||
|
|
|
||||
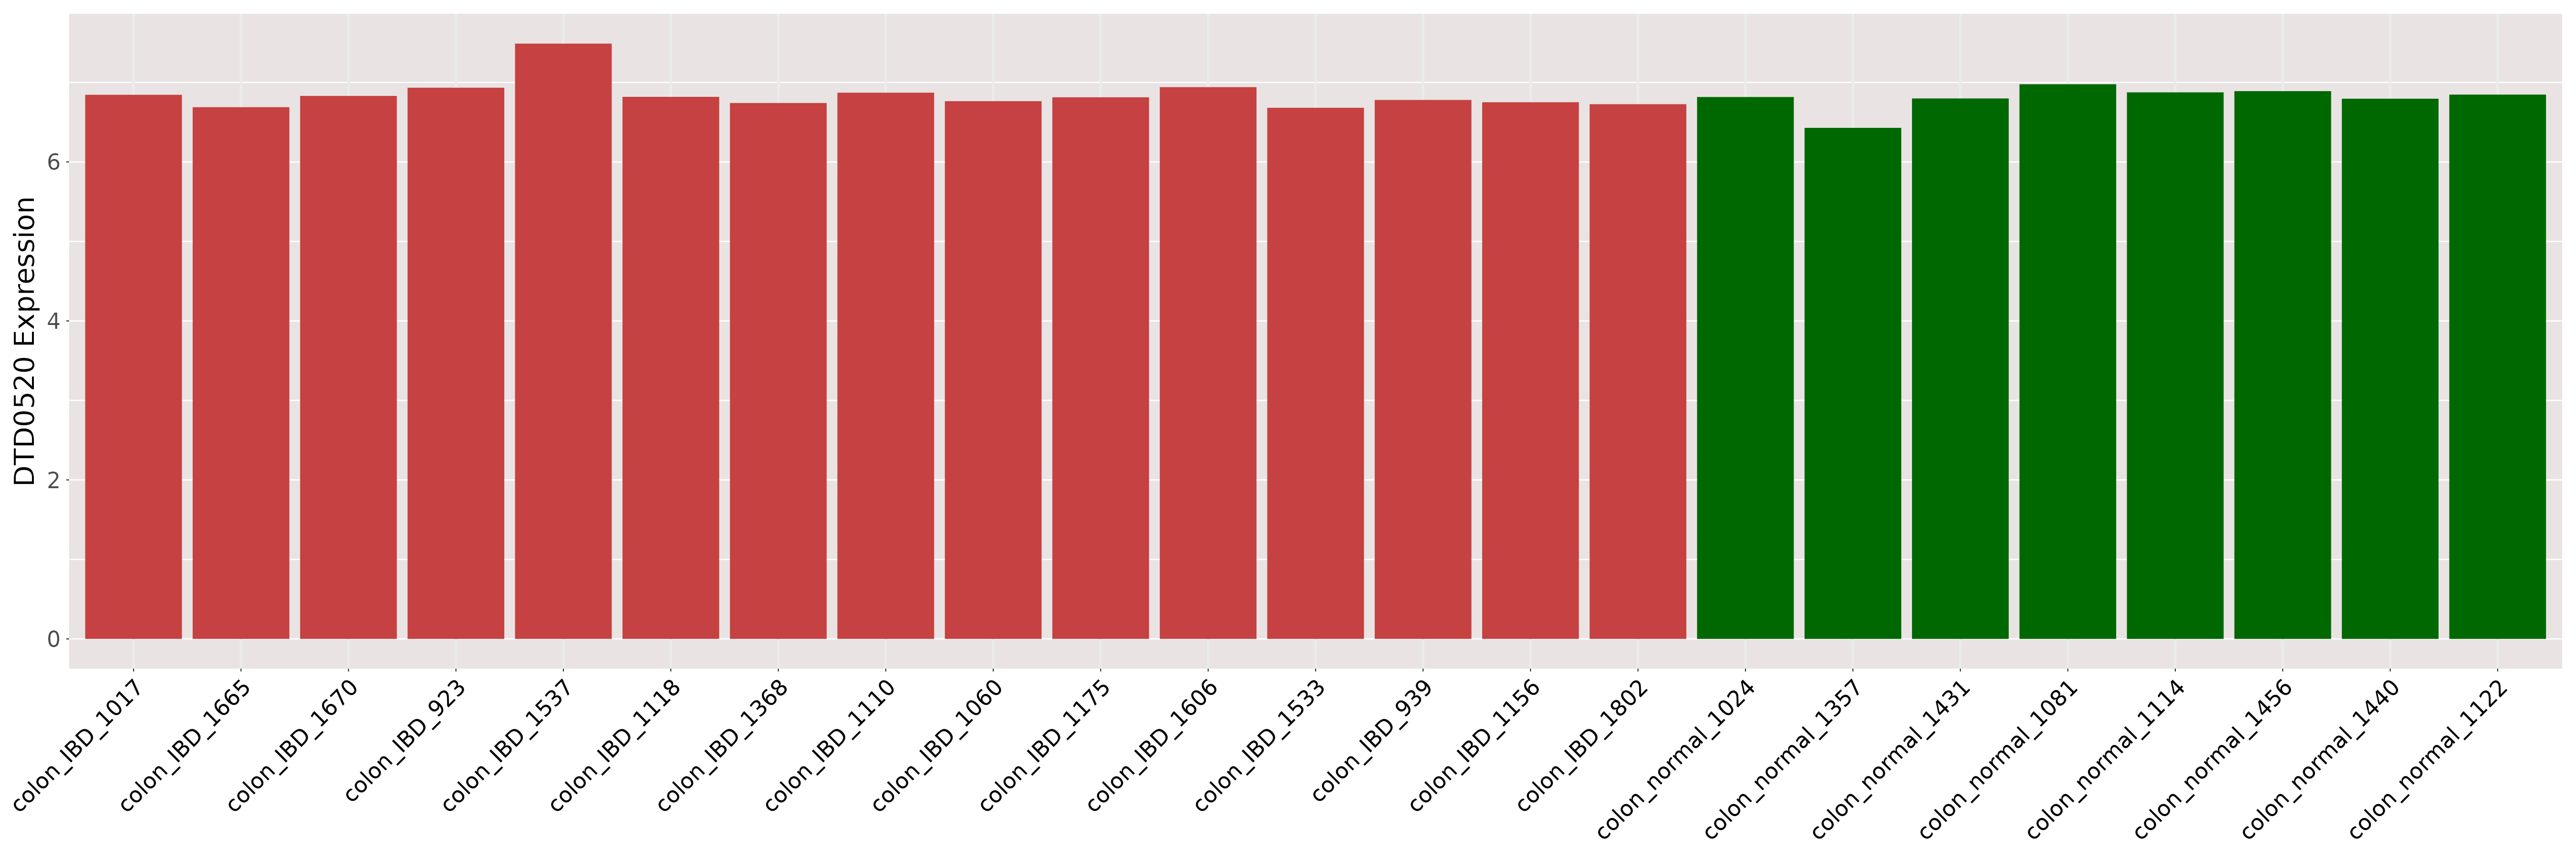
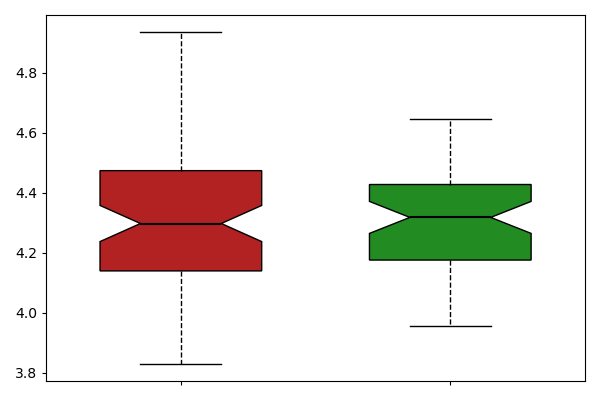
| [+] ICD-11: DD7Z Inflammatory bowel disease, unspecified | Click to Show/Hide the Full List | ||||
| The Studied Tissue | Colon | ||||
| The Specified Disease | Inflammatory bowel disease [ICD-11:DD7Z] | ||||
| The Expression Level of Disease Section Compare with the Healthy Individual Tissue | p-value:0.6158550576898172; Fold-change:0.9972627695397924; Z-score:0.2525664400267573 | ||||
| DT expression in the diseased tissue of patients
DT expression in the normal tissue of healthy individuals
|
|||||
|
 Please Click the above Thumbnail to View/Download
the Expression Barchart for All Samples Please Click the above Thumbnail to View/Download
the Expression Barchart for All Samples
|
||||
| The Studied Tissue | Sigmoid colon | ||||
| The Specified Disease | Inflammatory bowel disease [ICD-11:DD7Z] | ||||
| The Expression Level of Disease Section Compare with the Healthy Individual Tissue | p-value:0.6756783495339351; Fold-change:0.995289312218822; Z-score:0.0712550982735711 | ||||
| DT expression in the diseased tissue of patients
DT expression in the normal tissue of healthy individuals
|
|||||
|
 Please Click the above Thumbnail to View/Download
the Expression Barchart for All Samples Please Click the above Thumbnail to View/Download
the Expression Barchart for All Samples
|
||||
| ICD-11: 14 Disease of the skin | |||||
| [+] ICD-11: EA80 Atopic dermatitis | Click to Show/Hide the Full List | ||||
| The Studied Tissue | Skin | ||||
| The Specified Disease | Atopic eczema [ICD-11:EA80] | ||||
| The Expression Level of Disease Section Compare with the Healthy Individual Tissue | p-value:0.702974551305147; Fold-change:1.0128006502988605; Z-score:0.1318507628399052 | ||||
| DT expression in the diseased tissue of patients
DT expression in the normal tissue of healthy individuals
|
|||||
|
 Please Click the above Thumbnail to View/Download
the Expression Barchart for All Samples Please Click the above Thumbnail to View/Download
the Expression Barchart for All Samples
|
||||
| [+] ICD-11: EA91 Lichen planus (oral mucosal involvement) | Click to Show/Hide the Full List | ||||
| The Studied Tissue | Mouth mucosa | ||||
| The Specified Disease | Oral lichen planus [ICD-11:EA91.42] | ||||
| The Expression Level of Disease Section Compare with the Healthy Individual Tissue | p-value:0.1017999038762808; Fold-change:0.9747983868823348; Z-score:-0.808861475 | ||||
| DT expression in the diseased tissue of patients
DT expression in the normal tissue of healthy individuals
|
|||||
|
 Please Click the above Thumbnail to View/Download
the Expression Barchart for All Samples Please Click the above Thumbnail to View/Download
the Expression Barchart for All Samples
|
||||
| [+] ICD-11: ED90.0 Rosacea | Click to Show/Hide the Full List | ||||
| The Studied Tissue | Skin | ||||
| The Specified Disease | Rosacea [ICD-11:ED90.0] | ||||
| The Expression Level of Disease Section Compare with the Healthy Individual Tissue | p-value:0.6848050404642179; Fold-change:0.9985372066095736; Z-score:-0.100237032 | ||||
| DT expression in the diseased tissue of patients
DT expression in the normal tissue of healthy individuals
|
|||||
|
 Please Click the above Thumbnail to View/Download
the Expression Barchart for All Samples Please Click the above Thumbnail to View/Download
the Expression Barchart for All Samples
|
||||
| [+] ICD-11: EK90.0 Actinic keratosis | Click to Show/Hide the Full List | ||||
| The Studied Tissue | Skin | ||||
| The Specified Disease | Actinic keratosis [ICD-11:EK90.0] | ||||
| The Expression Level of Disease Section Compare with the Healthy Individual Tissue | p-value:0.6394651098663395; Fold-change:0.6666666666666666; Z-score:-0.24144523 | ||||
| DT expression in the diseased tissue of patients
DT expression in the normal tissue of healthy individuals
|
|||||
|
 Please Click the above Thumbnail to View/Download
the Expression Barchart for All Samples Please Click the above Thumbnail to View/Download
the Expression Barchart for All Samples
|
||||
| ICD-11: 15 Disease of the musculoskeletal system/connective tissue | |||||
| [+] ICD-11: FA0Z Osteoarthritis, unspecified site | Click to Show/Hide the Full List | ||||
| The Studied Tissue | Bone | ||||
| The Specified Disease | Osteoarthritis [ICD-11:FA0Z] | ||||
| The Expression Level of Disease Section Compare with the Healthy Individual Tissue | p-value:0.0045322324067147; Fold-change:1.1950977540069327; Z-score:1.0512571263330173 | ||||
| DT expression in the diseased tissue of patients
DT expression in the normal tissue of healthy individuals
|
|||||
|
 Please Click the above Thumbnail to View/Download
the Expression Barchart for All Samples Please Click the above Thumbnail to View/Download
the Expression Barchart for All Samples
|
||||
| ICD-11: 16 Disease of the genitourinary system | |||||
| [+] ICD-11: GB61 Chronic kidney disease | Click to Show/Hide the Full List | ||||
| The Studied Tissue | Kidney | ||||
| The Specified Disease | Chronic kidney disease [ICD-11:GB61.Z] | ||||
| The Expression Level of Disease Section Compare with the Healthy Individual Tissue | p-value:0.5573695448274623; Fold-change:1.0076252995996722; Z-score:-0.214393585 | ||||
| DT expression in the diseased tissue of patients
DT expression in the normal tissue of healthy individuals
|
|||||
|
 Please Click the above Thumbnail to View/Download
the Expression Barchart for All Samples Please Click the above Thumbnail to View/Download
the Expression Barchart for All Samples
|
||||
| ICD-11: 20 Developmental anomaly | |||||
| [+] ICD-11: LA88.2 Tetralogy of Fallot | Click to Show/Hide the Full List | ||||
| The Studied Tissue | Heart ventricle | ||||
| The Specified Disease | Tetralogy of fallot [ICD-11:LA88.2] | ||||
| The Expression Level of Disease Section Compare with the Healthy Individual Tissue | p-value:6.699600687956114e-05; Fold-change:0.05; Z-score:-0.970733216 | ||||
| DT expression in the diseased tissue of patients
DT expression in the normal tissue of healthy individuals
|
|||||
|
 Please Click the above Thumbnail to View/Download
the Expression Barchart for All Samples Please Click the above Thumbnail to View/Download
the Expression Barchart for All Samples
|
||||
| [+] ICD-11: LB20.21 Biliary atresia | Click to Show/Hide the Full List | ||||
| The Studied Tissue | Liver | ||||
| The Specified Disease | Biliary atresia [ICD-11:LB20.21] | ||||
| The Expression Level of Disease Section Compare with the Healthy Individual Tissue | p-value:0.0007269270004311; Fold-change:0.9799674715775548; Z-score:-1.024465687 | ||||
| DT expression in the diseased tissue of patients
DT expression in the normal tissue of healthy individuals
|
|||||
|
 Please Click the above Thumbnail to View/Download
the Expression Barchart for All Samples Please Click the above Thumbnail to View/Download
the Expression Barchart for All Samples
|
||||
| [+] ICD-11: LB70.00 Unicoronal craniosynostosis | Click to Show/Hide the Full List | ||||
| The Studied Tissue | Skull | ||||
| The Specified Disease | Coronal craniosynostosis [ICD-11:LB70.00] | ||||
| The Expression Level of Disease Section Compare with the Healthy Individual Tissue | p-value:0.1602908555953783; Fold-change:inf; Z-score:inf | ||||
| DT expression in the diseased tissue of patients
DT expression in the normal tissue of healthy individuals
|
|||||
|
 Please Click the above Thumbnail to View/Download
the Expression Barchart for All Samples Please Click the above Thumbnail to View/Download
the Expression Barchart for All Samples
|
||||
| [+] ICD-11: LB70.02 Lambdoid craniosynostosis | Click to Show/Hide the Full List | ||||
| The Studied Tissue | Skull | ||||
| The Specified Disease | Lambdoid craniosynostosis [ICD-11:LB70.3] | ||||
| The Expression Level of Disease Section Compare with the Healthy Individual Tissue | p-value:0.0932163206094375; Fold-change:inf; Z-score:inf | ||||
| DT expression in the diseased tissue of patients
DT expression in the normal tissue of healthy individuals
|
|||||
|
 Please Click the above Thumbnail to View/Download
the Expression Barchart for All Samples Please Click the above Thumbnail to View/Download
the Expression Barchart for All Samples
|
||||
| [+] ICD-11: LB70.03 Metopic craniosynostosis | Click to Show/Hide the Full List | ||||
| The Studied Tissue | Skull | ||||
| The Specified Disease | Metopic craniosynostosis [ICD-11:LB70.2] | ||||
| The Expression Level of Disease Section Compare with the Healthy Individual Tissue | p-value:0.0821096785926185; Fold-change:inf; Z-score:inf | ||||
| DT expression in the diseased tissue of patients
DT expression in the normal tissue of healthy individuals
|
|||||
|
 Please Click the above Thumbnail to View/Download
the Expression Barchart for All Samples Please Click the above Thumbnail to View/Download
the Expression Barchart for All Samples
|
||||
| [+] ICD-11: LC02 Sebaceous naevus (nevus sebaceus of Jadassohn) | Click to Show/Hide the Full List | ||||
| The Studied Tissue | Skin | ||||
| The Specified Disease | Sebaceous of jadassohn nevus [ICD-11:LD2D.Y] | ||||
| The Expression Level of Disease Section Compare with the Healthy Individual Tissue | p-value:0.5638062359367568; Fold-change:0.6666666666666666; Z-score:-0.277100063 | ||||
| DT expression in the diseased tissue of patients
DT expression in the normal tissue of healthy individuals
|
|||||

|
 Please Click the above Thumbnail to View/Download
the Expression Barchart for All Samples Please Click the above Thumbnail to View/Download
the Expression Barchart for All Samples
|
||||
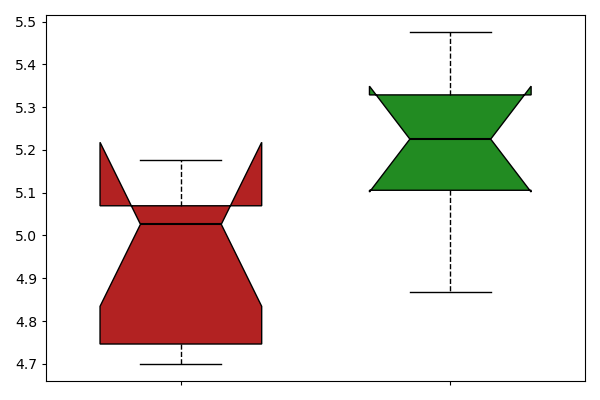
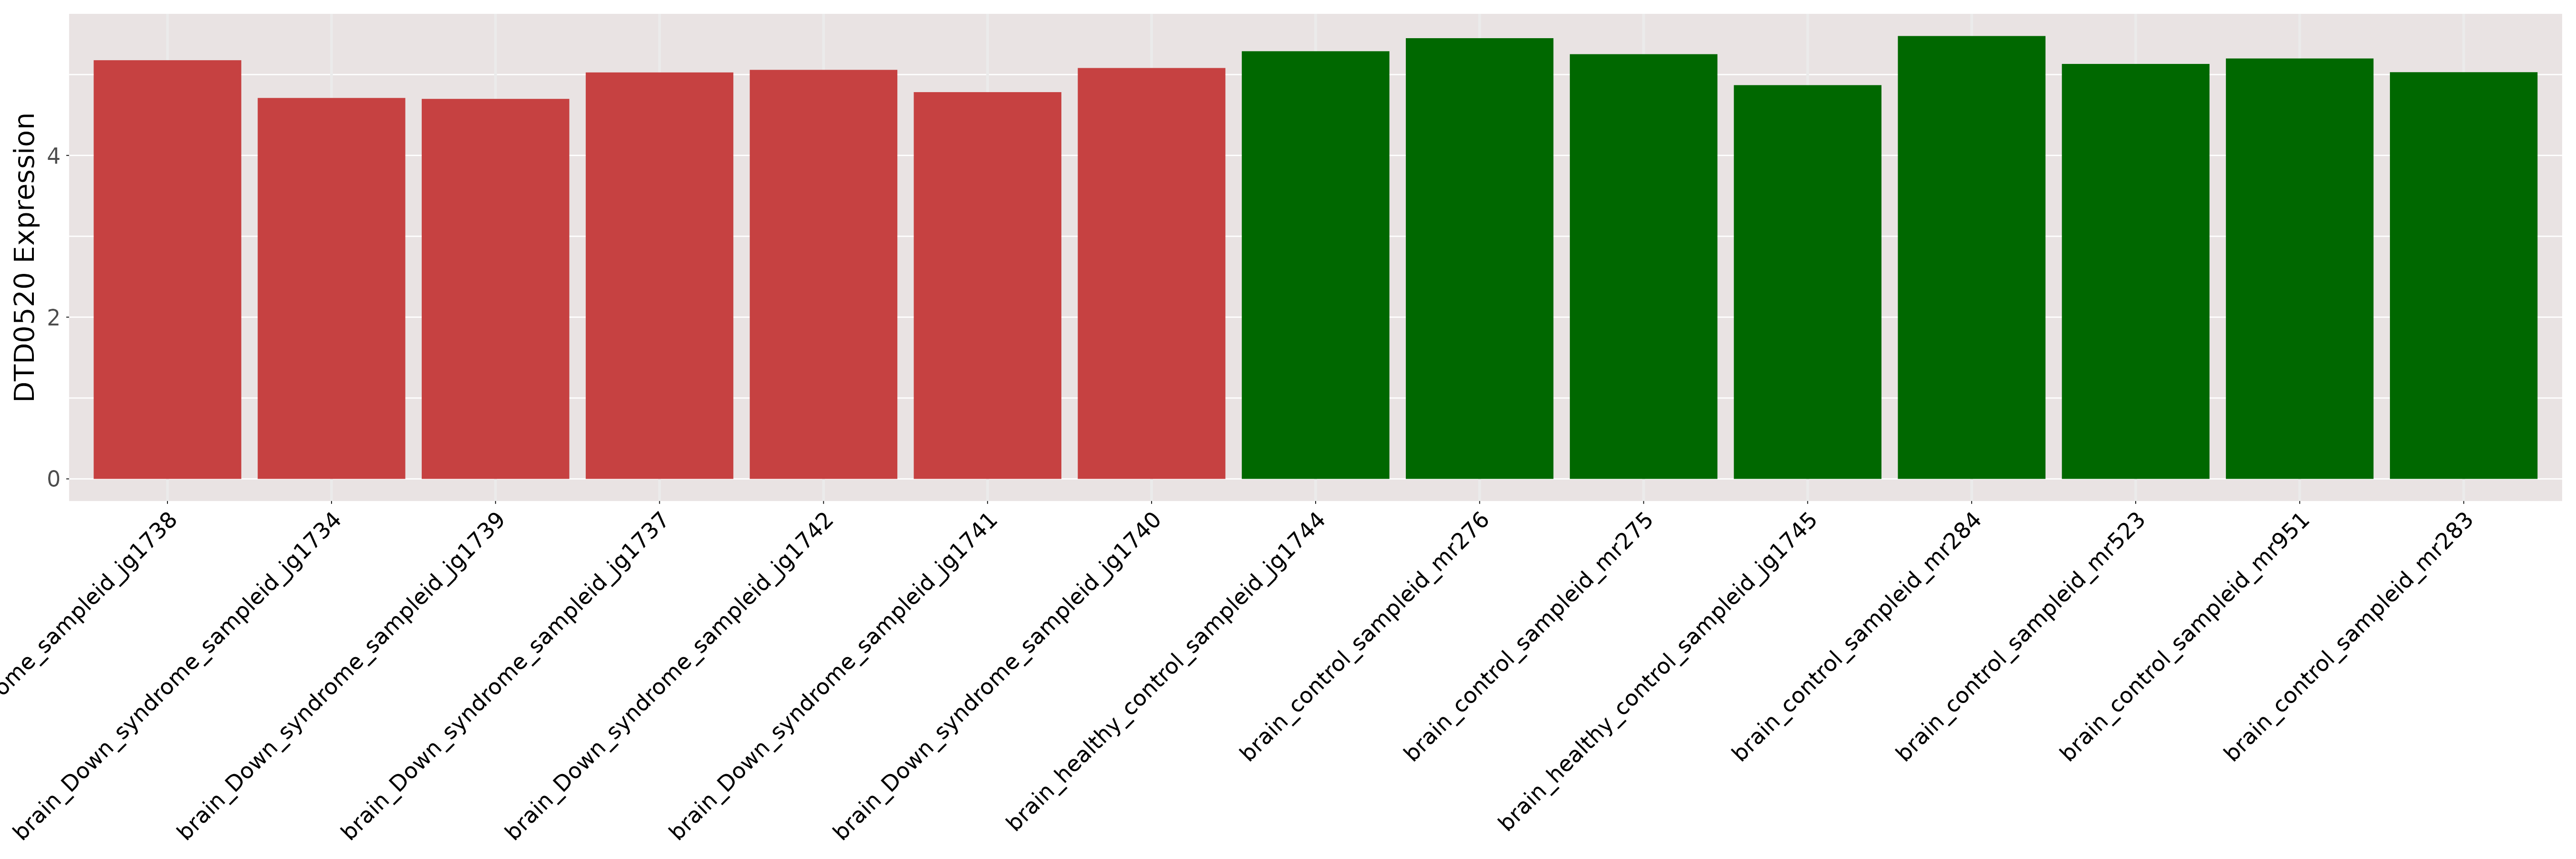
| [+] ICD-11: LD40.0 Complete trisomy 21 (Down syndrome) | Click to Show/Hide the Full List | ||||
| The Studied Tissue | Brain | ||||
| The Specified Disease | Down syndrome [ICD-11:LD40.0] | ||||
| The Expression Level of Disease Section Compare with the Healthy Individual Tissue | p-value:0.0189948549728352; Fold-change:0.9618900802066824; Z-score:-1.36338462 | ||||
| DT expression in the diseased tissue of patients
DT expression in the normal tissue of healthy individuals
|
|||||
|
 Please Click the above Thumbnail to View/Download
the Expression Barchart for All Samples Please Click the above Thumbnail to View/Download
the Expression Barchart for All Samples
|
||||
| ICD-11: 25 Codes for special purposes | |||||
| [+] ICD-11: RA01 COVID-19 | Click to Show/Hide the Full List | ||||
| The Studied Tissue | Lung | ||||
| The Specified Disease | Covid [ICD-11:RA01.0] | ||||
| The Expression Level of Disease Section Compare with the Healthy Individual Tissue | p-value:0.9715995440690298; Fold-change:3.5; Z-score:-0.013209019 | ||||
| DT expression in the diseased tissue of patients
DT expression in the normal tissue of healthy individuals
|
|||||
|
 Please Click the above Thumbnail to View/Download
the Expression Barchart for All Samples Please Click the above Thumbnail to View/Download
the Expression Barchart for All Samples
|
||||
| The Studied Tissue | Colon | ||||
| The Specified Disease | Covid [ICD-11:RA01.0] | ||||
| The Expression Level of Disease Section Compare with the Healthy Individual Tissue | p-value:0.7345395108038146; Fold-change:0.8888888888888888; Z-score:0.1836161654509106 | ||||
| DT expression in the diseased tissue of patients
DT expression in the normal tissue of healthy individuals
|
|||||
|
 Please Click the above Thumbnail to View/Download
the Expression Barchart for All Samples Please Click the above Thumbnail to View/Download
the Expression Barchart for All Samples
|
||||
| ICD-11: 28 Extension Codes | |||||
| [+] ICD-11: XH12D2 Pilocytic astrocytoma | Click to Show/Hide the Full List | ||||
| The Studied Tissue | Brain | ||||
| The Specified Disease | Astrocytoma, pilocytic [ICD-11:XH12D2] | ||||
| The Expression Level of Disease Section Compare with the Healthy Individual Tissue | p-value:9.166626089037045e-08; Fold-change:0.8018470035587322; Z-score:-3.052383224 | ||||
| DT expression in the diseased tissue of patients
DT expression in the normal tissue of healthy individuals
|
|||||
|
 Please Click the above Thumbnail to View/Download
the Expression Barchart for All Samples Please Click the above Thumbnail to View/Download
the Expression Barchart for All Samples
|
||||
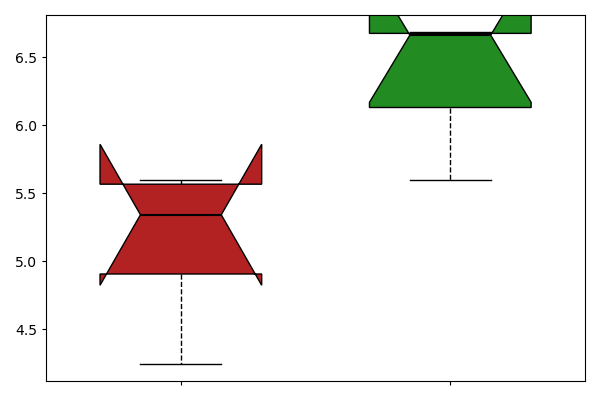
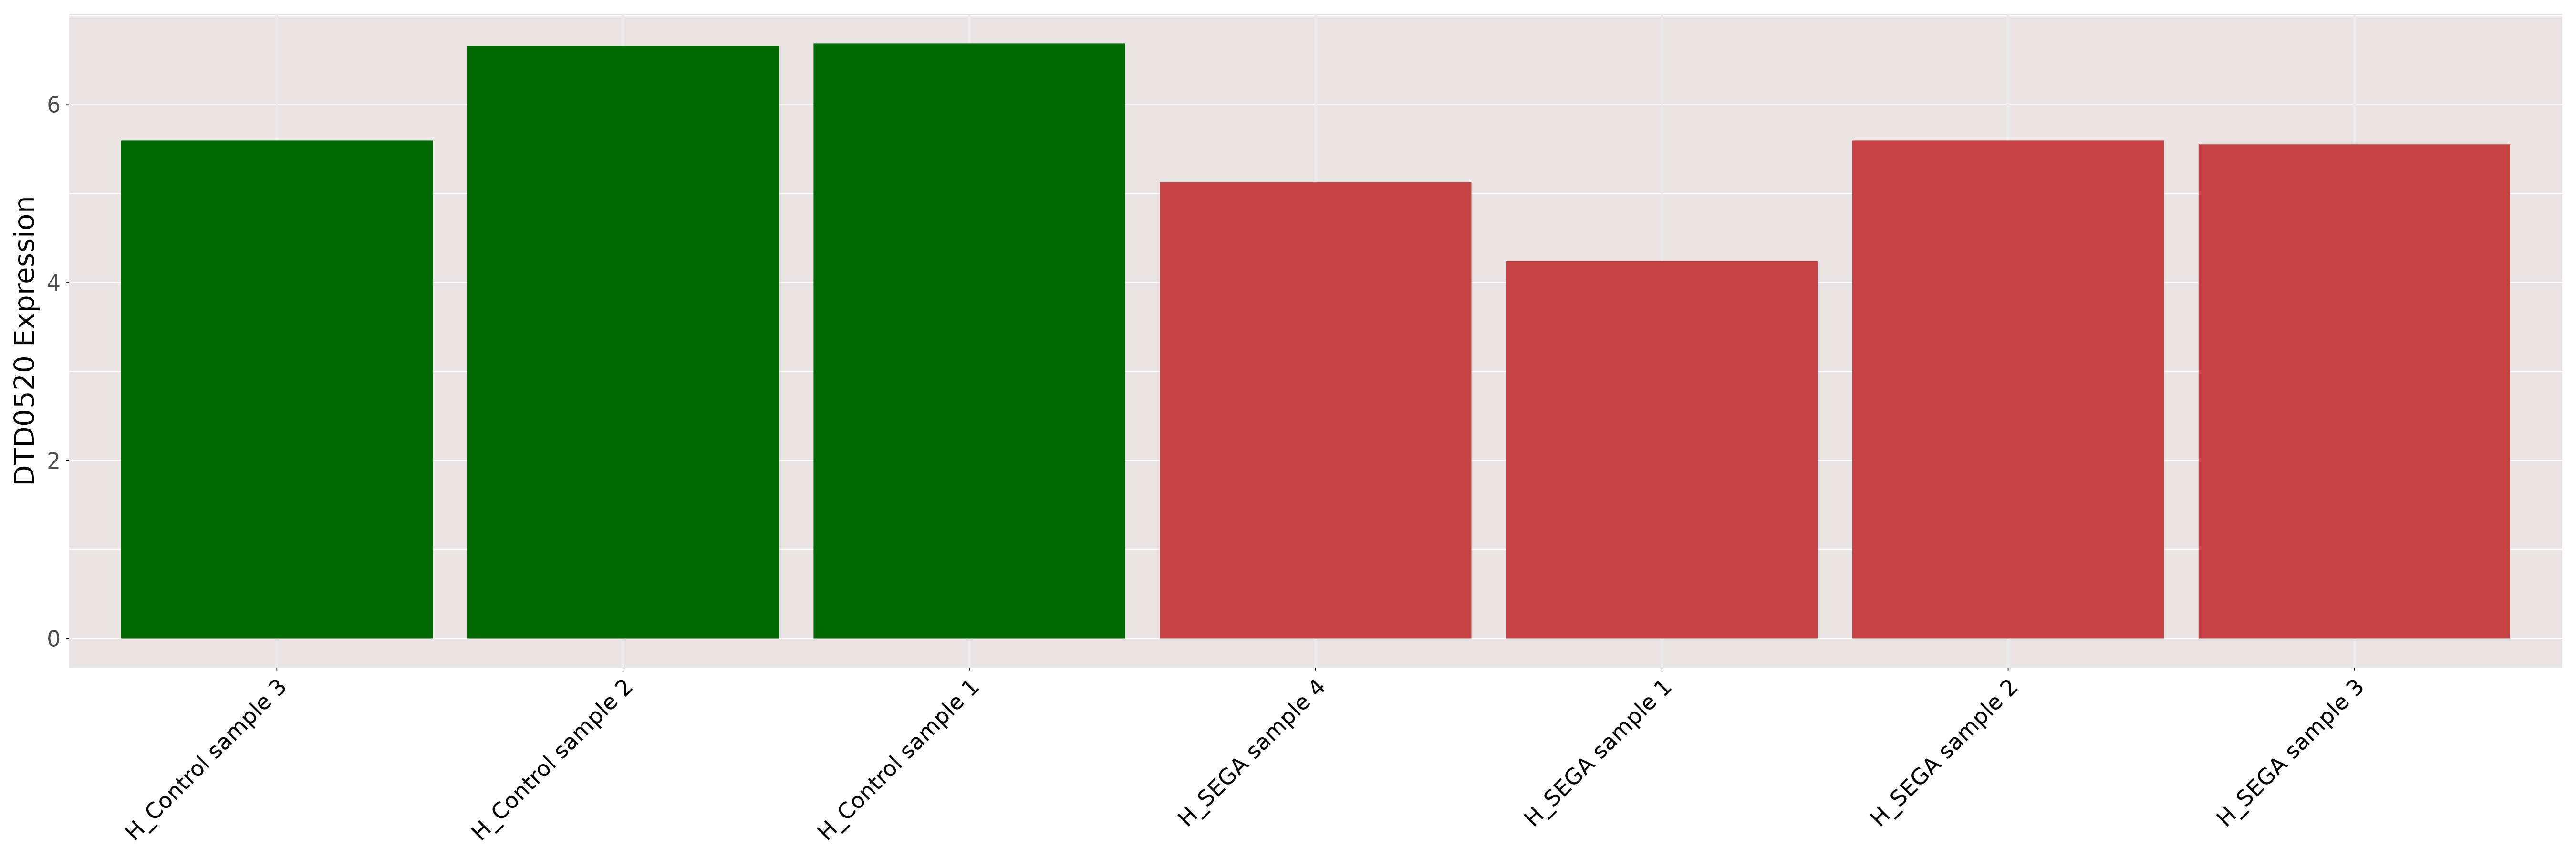
| [+] ICD-11: XH1L48 Subependymal giant cell astrocytoma | Click to Show/Hide the Full List | ||||
| The Studied Tissue | Brain | ||||
| The Specified Disease | Subependymal giant cell astrocytoma [ICD-11:XH1L48] | ||||
| The Expression Level of Disease Section Compare with the Healthy Individual Tissue | p-value:0.056004353990812; Fold-change:0.8018128429575134; Z-score:-1.905302345 | ||||
| DT expression in the diseased tissue of patients
DT expression in the normal tissue of healthy individuals
|
|||||
|
 Please Click the above Thumbnail to View/Download
the Expression Barchart for All Samples Please Click the above Thumbnail to View/Download
the Expression Barchart for All Samples
|
||||
| [+] ICD-11: XH77N6 Clear cell sarcoma, NOS (soft tissue) | Click to Show/Hide the Full List | ||||
| The Studied Tissue | Kidney | ||||
| The Specified Disease | Clear cell sarcoma [ICD-11:XH77N6] | ||||
| The Expression Level of Disease Section Compare with the Healthy Individual Tissue | p-value:0.6799532866892413; Fold-change:0.9744673792968338; Z-score:-0.342698495 | ||||
| DT expression in the diseased tissue of patients
DT expression in the normal tissue of healthy individuals
|
|||||
|
|
|
||||
| [+] ICD-11: XH7ZQ4 Atypical teratoid/rhabdoid tumour | Click to Show/Hide the Full List | ||||
| The Studied Tissue | Brain | ||||
| The Specified Disease | Atypical teratoid rhabdoid tumor [ICD-11:XH7ZQ4] | ||||
| The Expression Level of Disease Section Compare with the Healthy Individual Tissue | p-value:0.0020931790592978; Fold-change:0.7614137516329238; Z-score:-6.176573096 | ||||
| DT expression in the diseased tissue of patients
DT expression in the normal tissue of healthy individuals
|
|||||
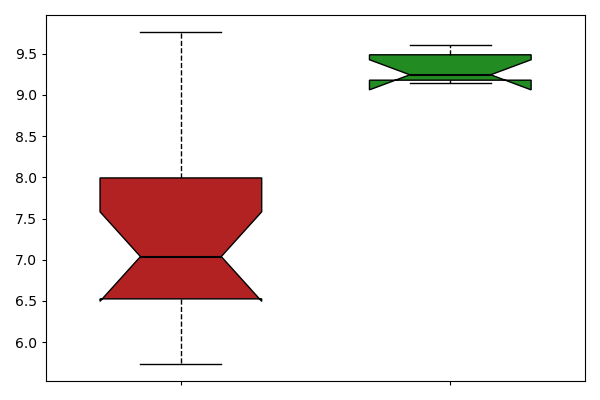
|
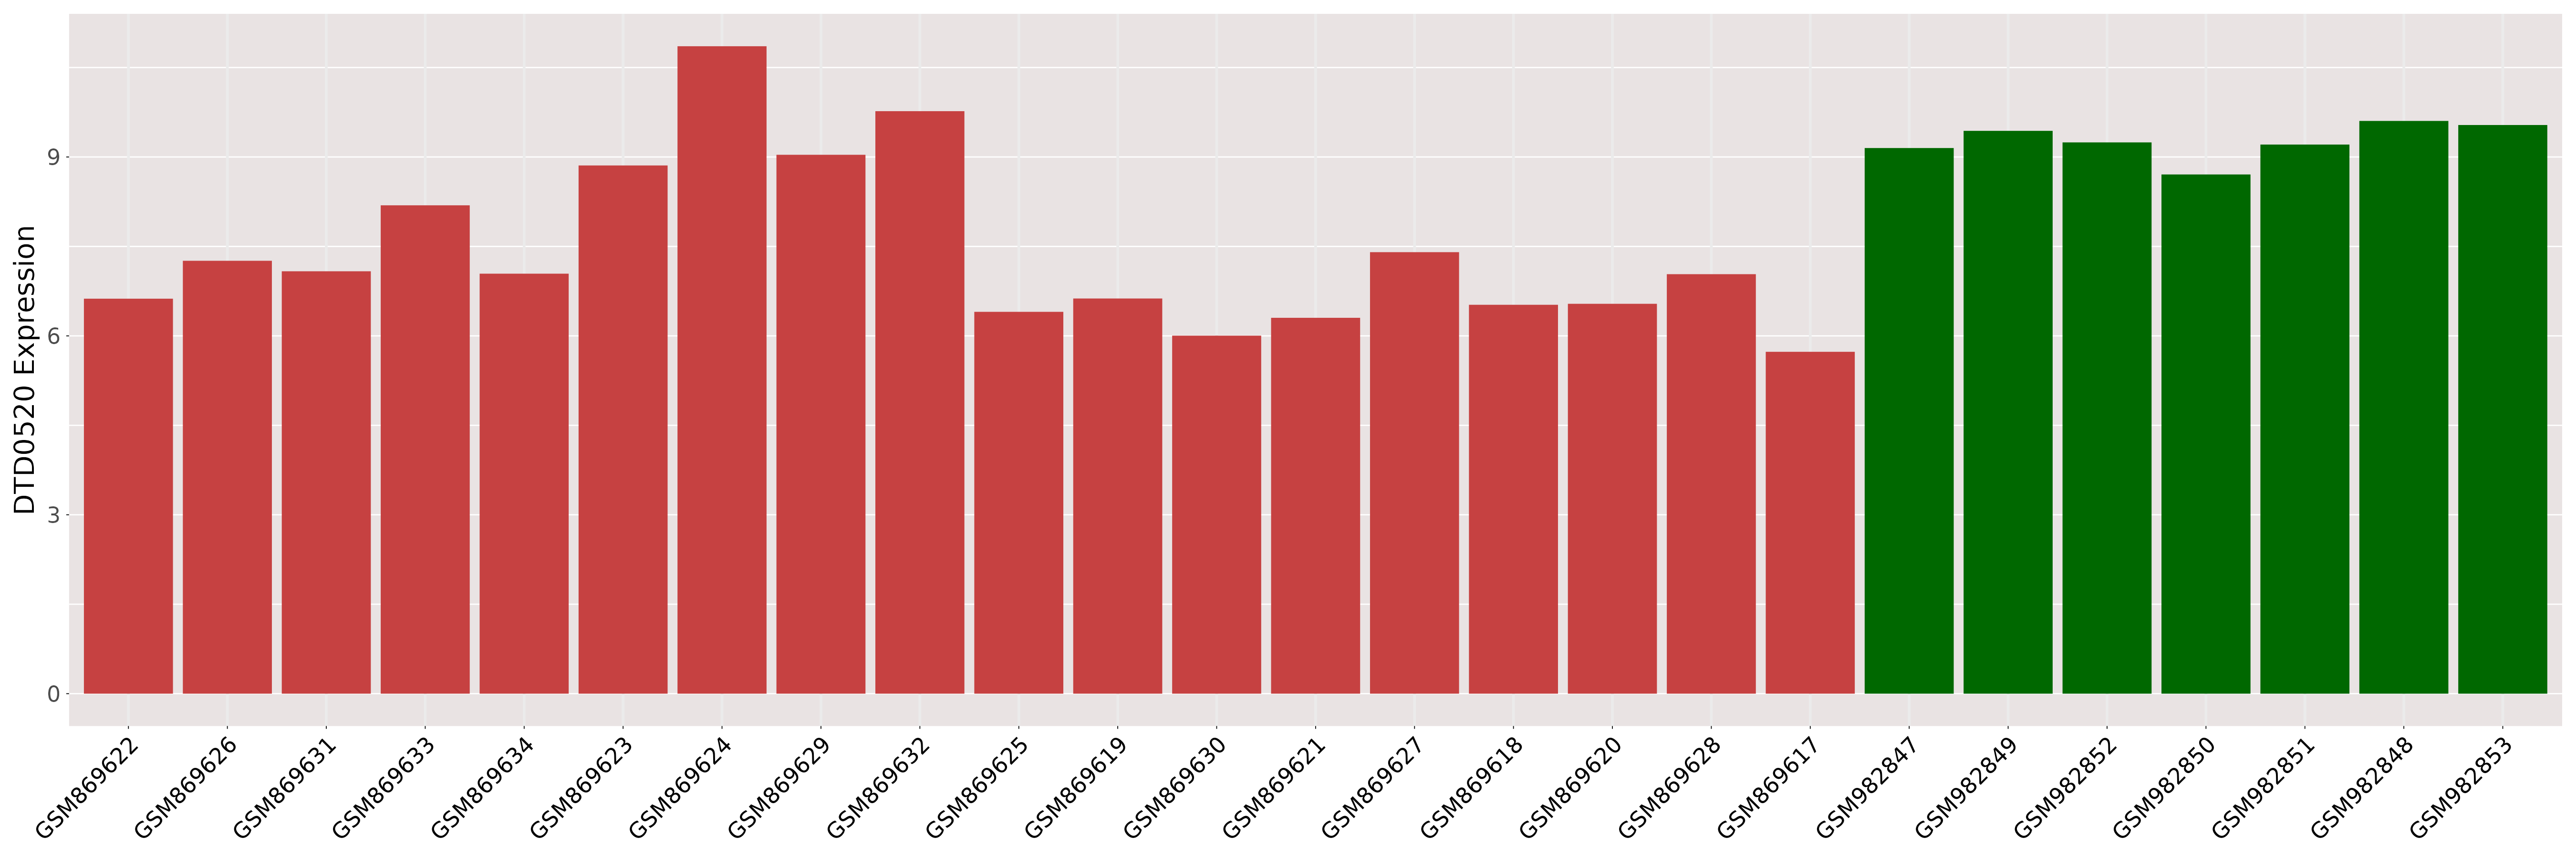 Please Click the above Thumbnail to View/Download
the Expression Barchart for All Samples Please Click the above Thumbnail to View/Download
the Expression Barchart for All Samples
|
||||
If you find any error in data or bug in web service, please kindly report it to Dr. Li and Dr. Fu.