
Detail Information of Disease-specific Protein Abundances
| General Information of Drug Transporter (DT) | |||||
|---|---|---|---|---|---|
| DT ID | DTD0495 Transporter Info | ||||
| Gene Name | SLC9B1 | ||||
| Protien Name | Sodium/hydrogen exchanger 9B1 | ||||
| Gene ID | |||||
| UniProt ID | |||||
| Disease-specific Protein Abundances of DT (DPAD) | |||||
|---|---|---|---|---|---|
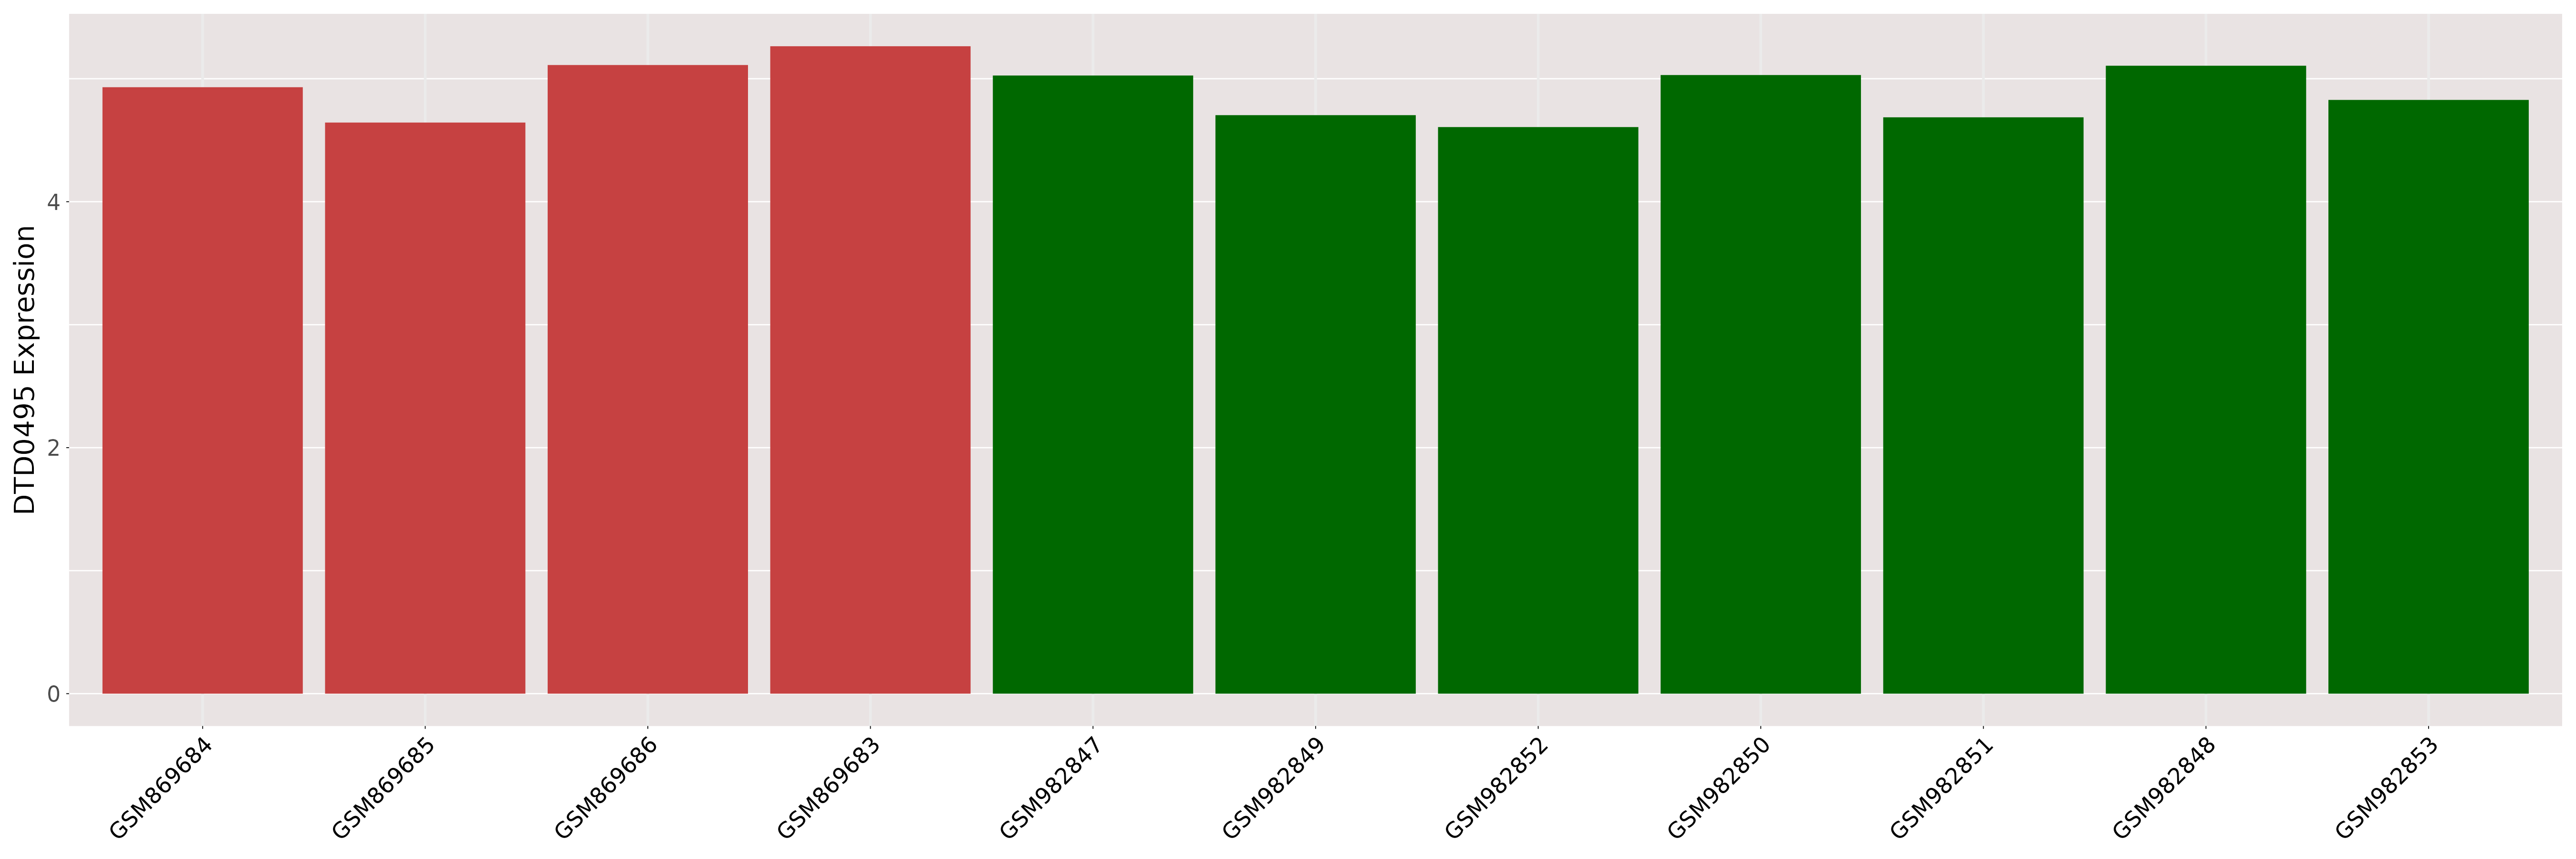
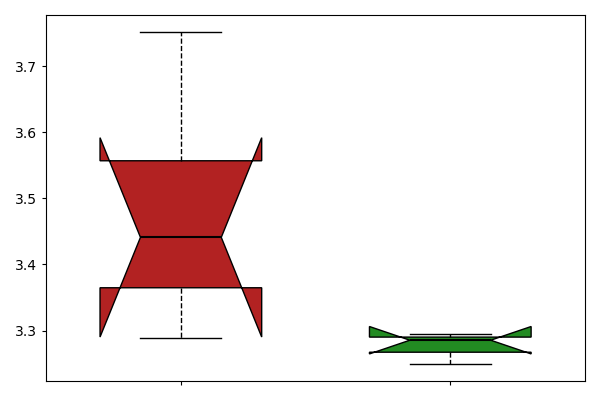
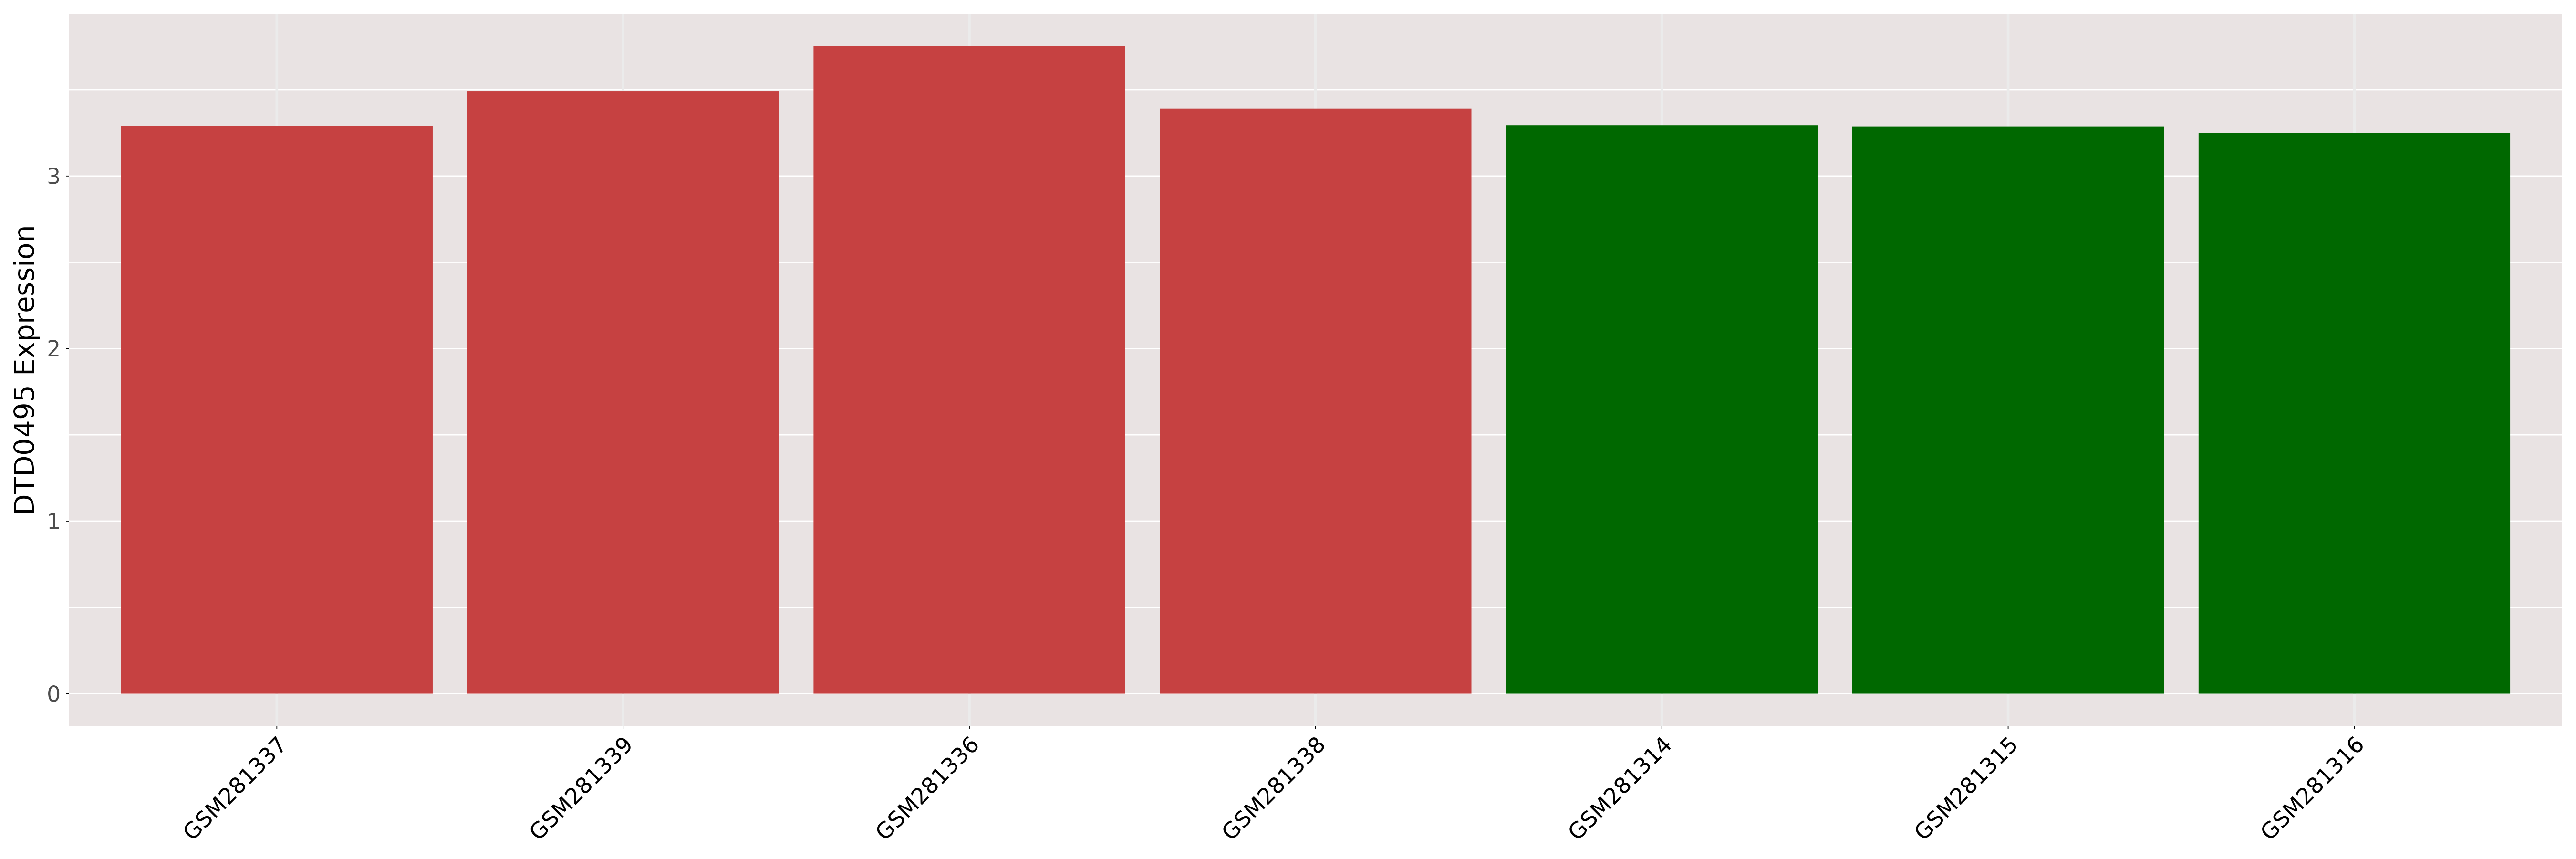
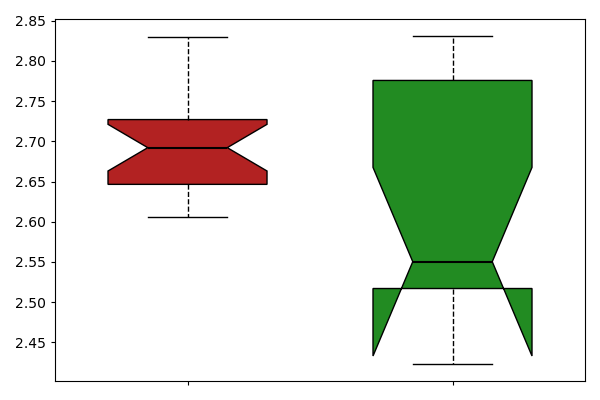
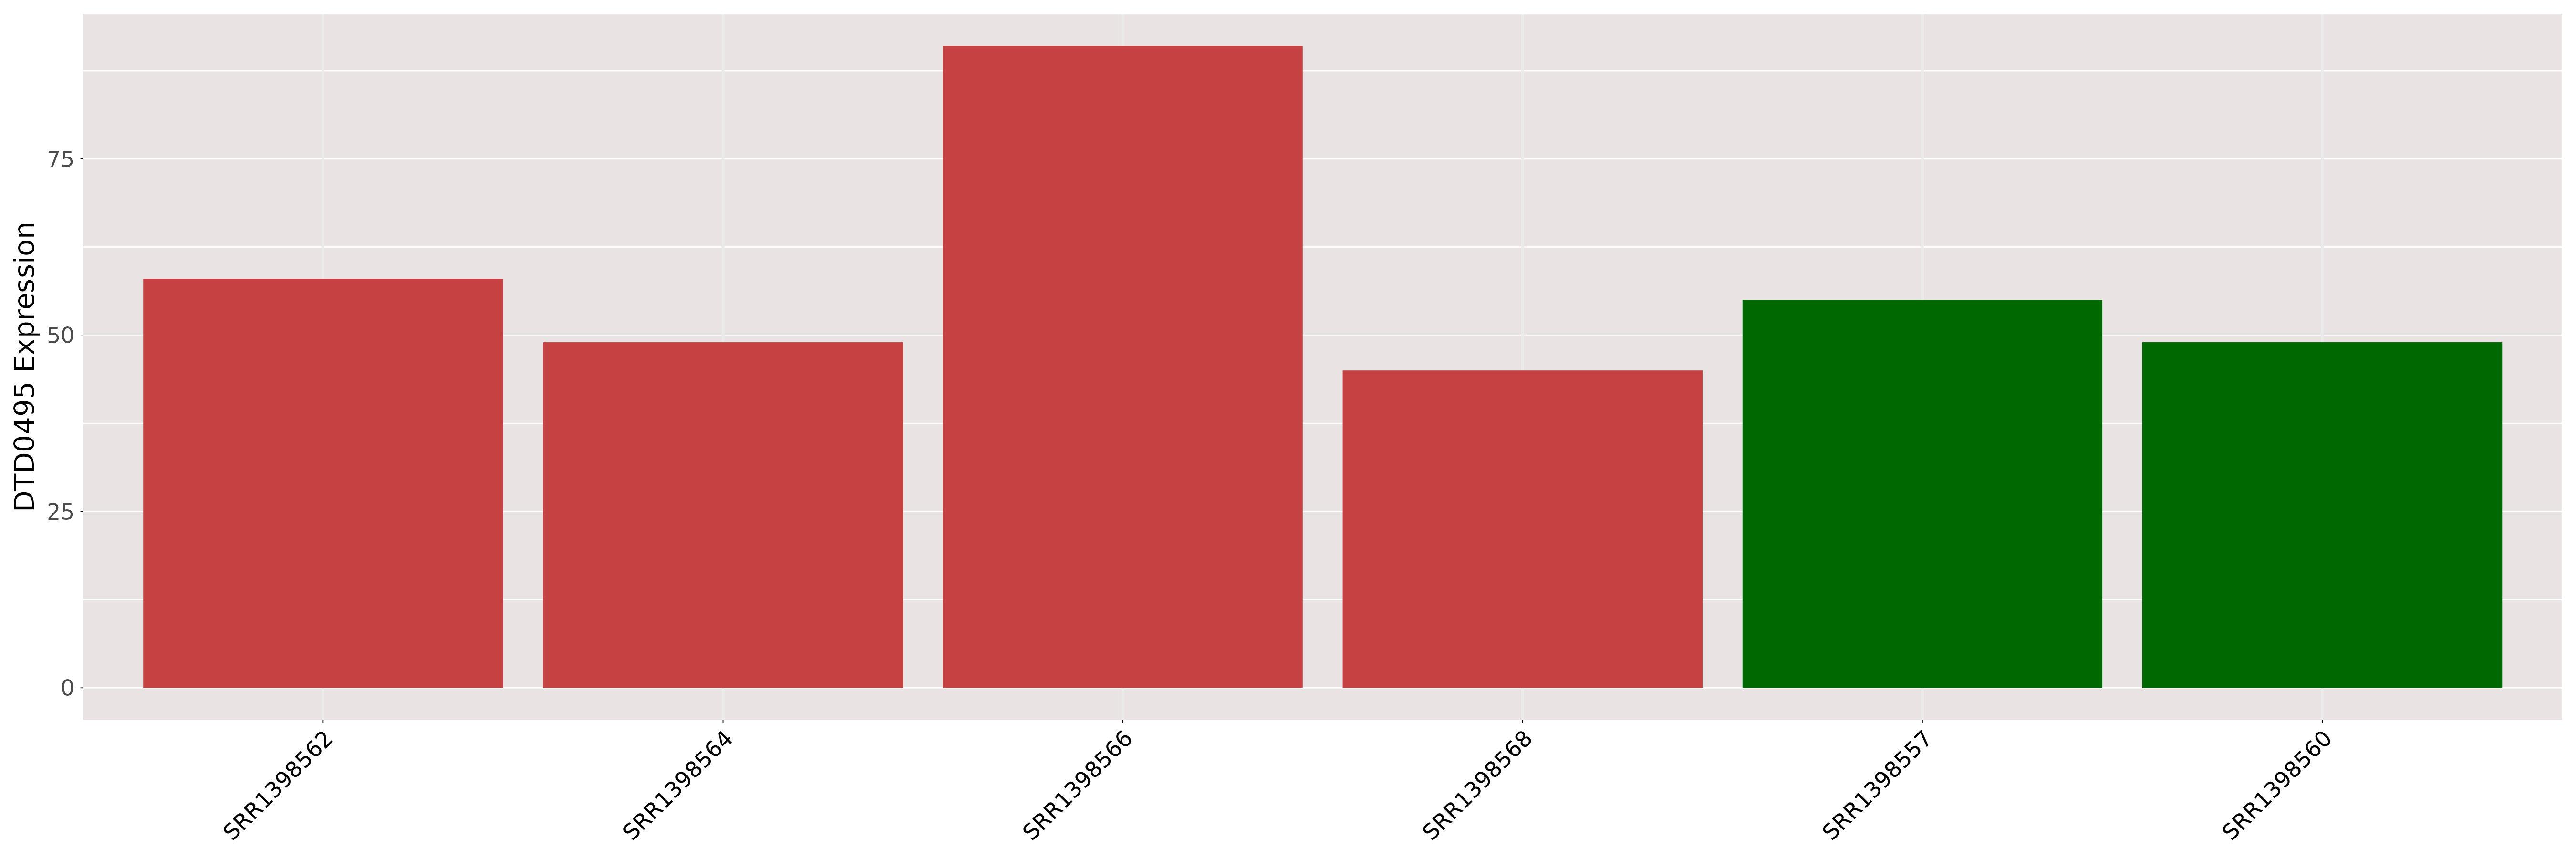
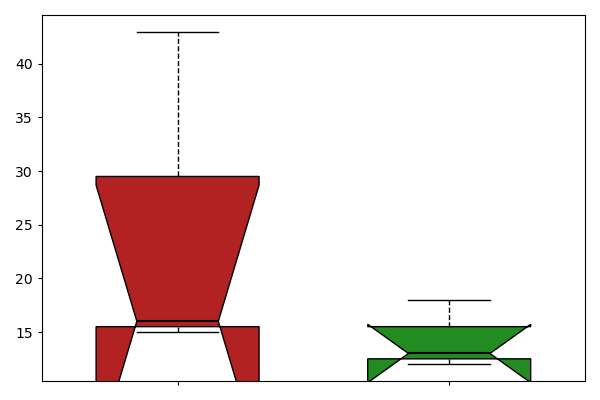
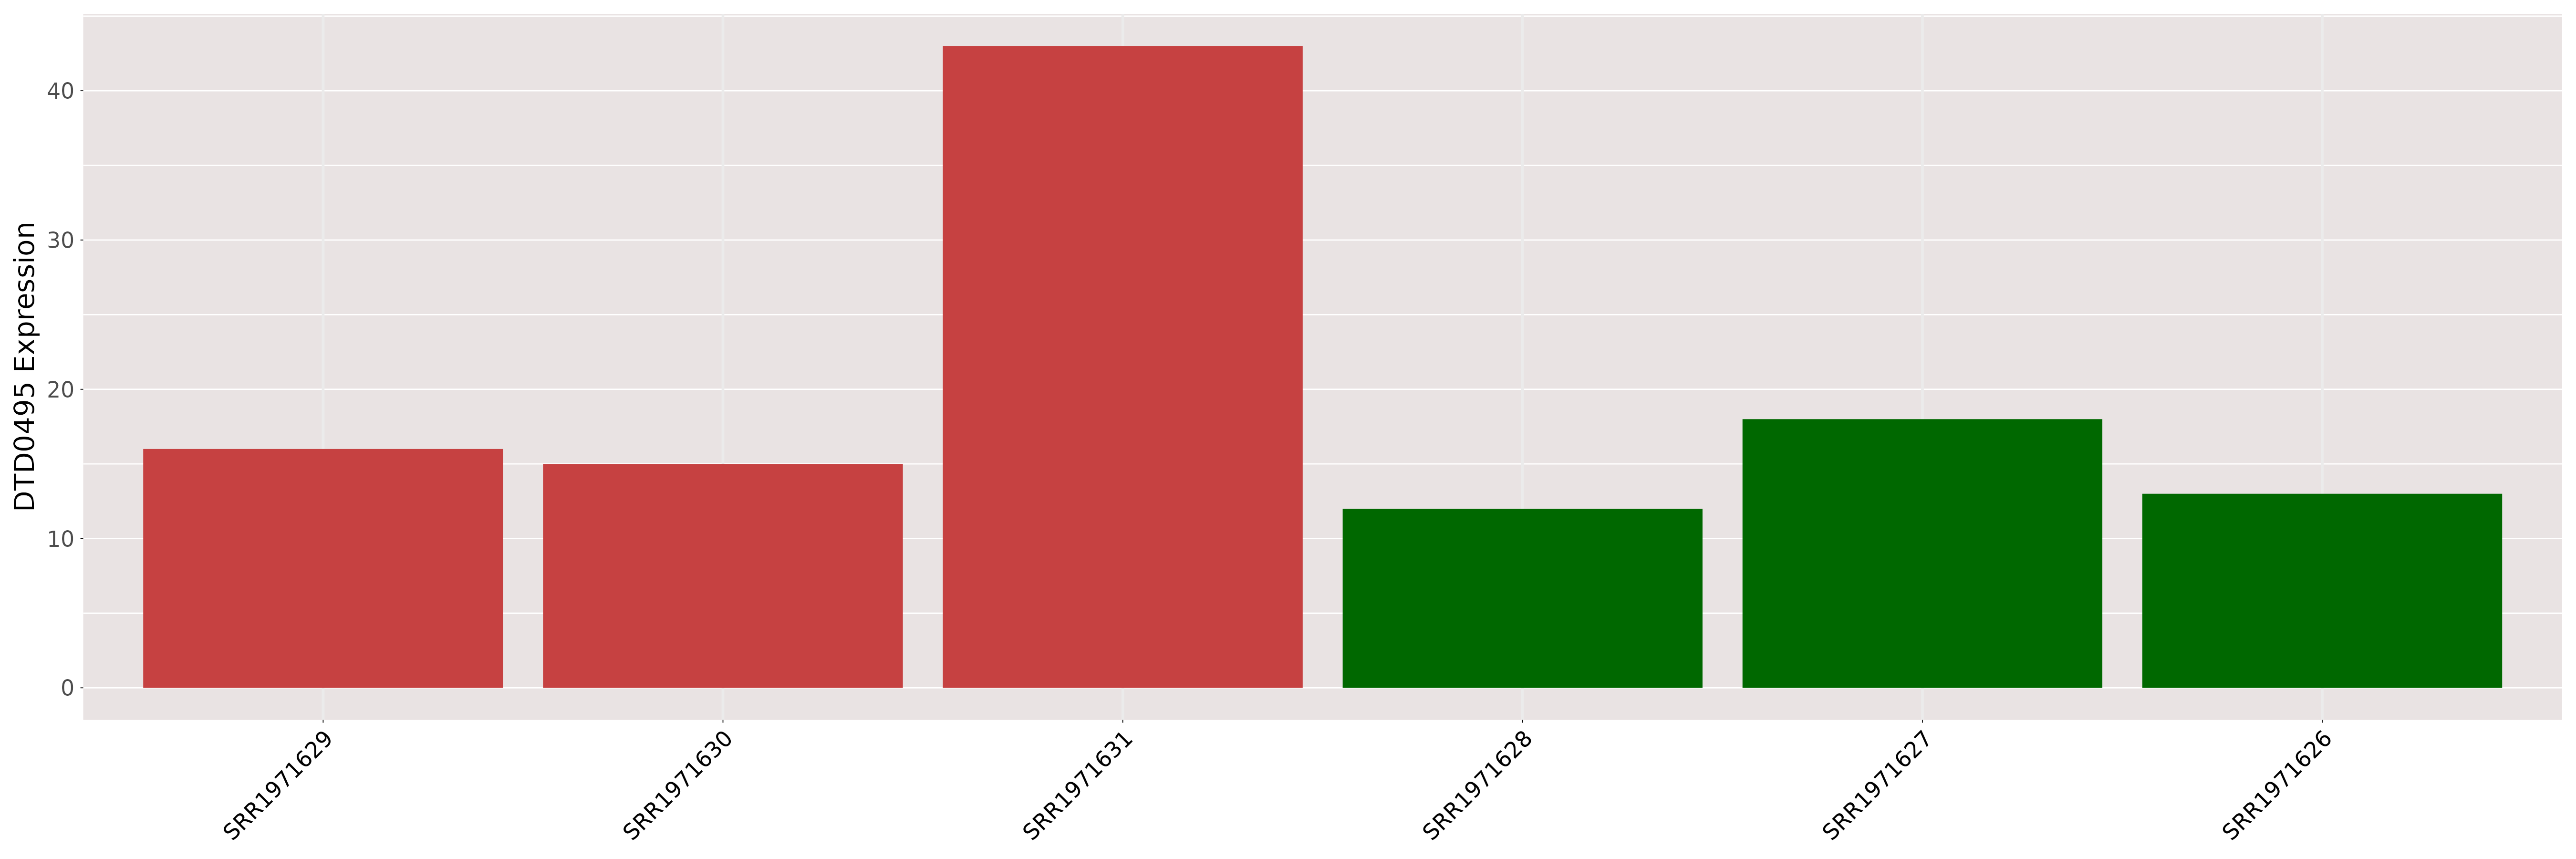
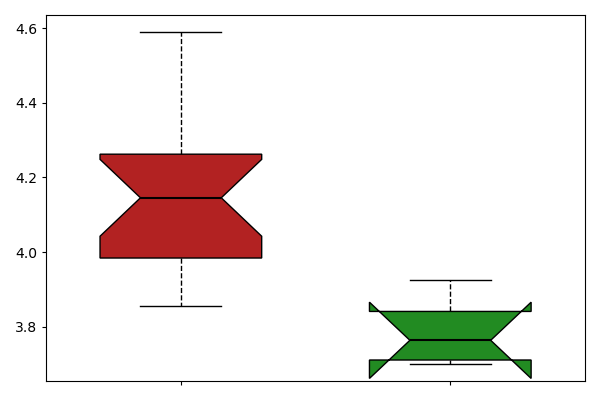
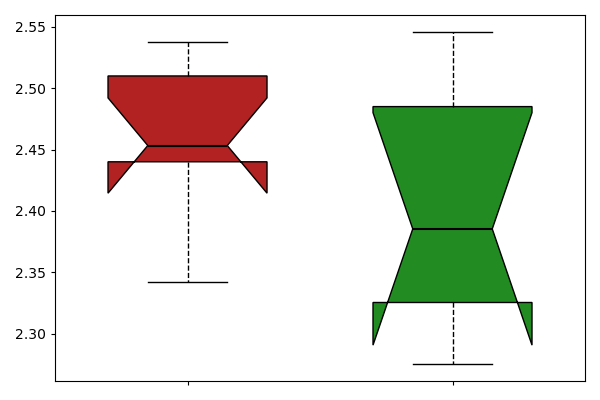
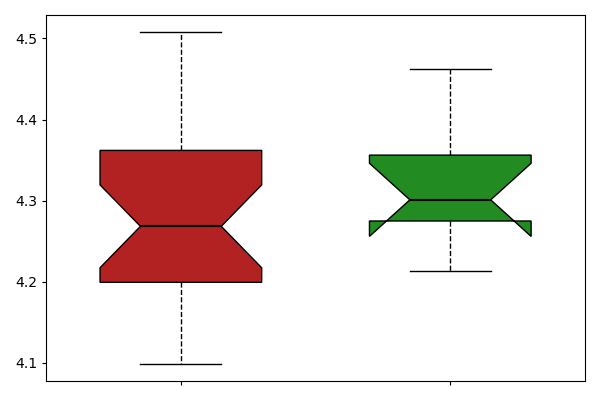
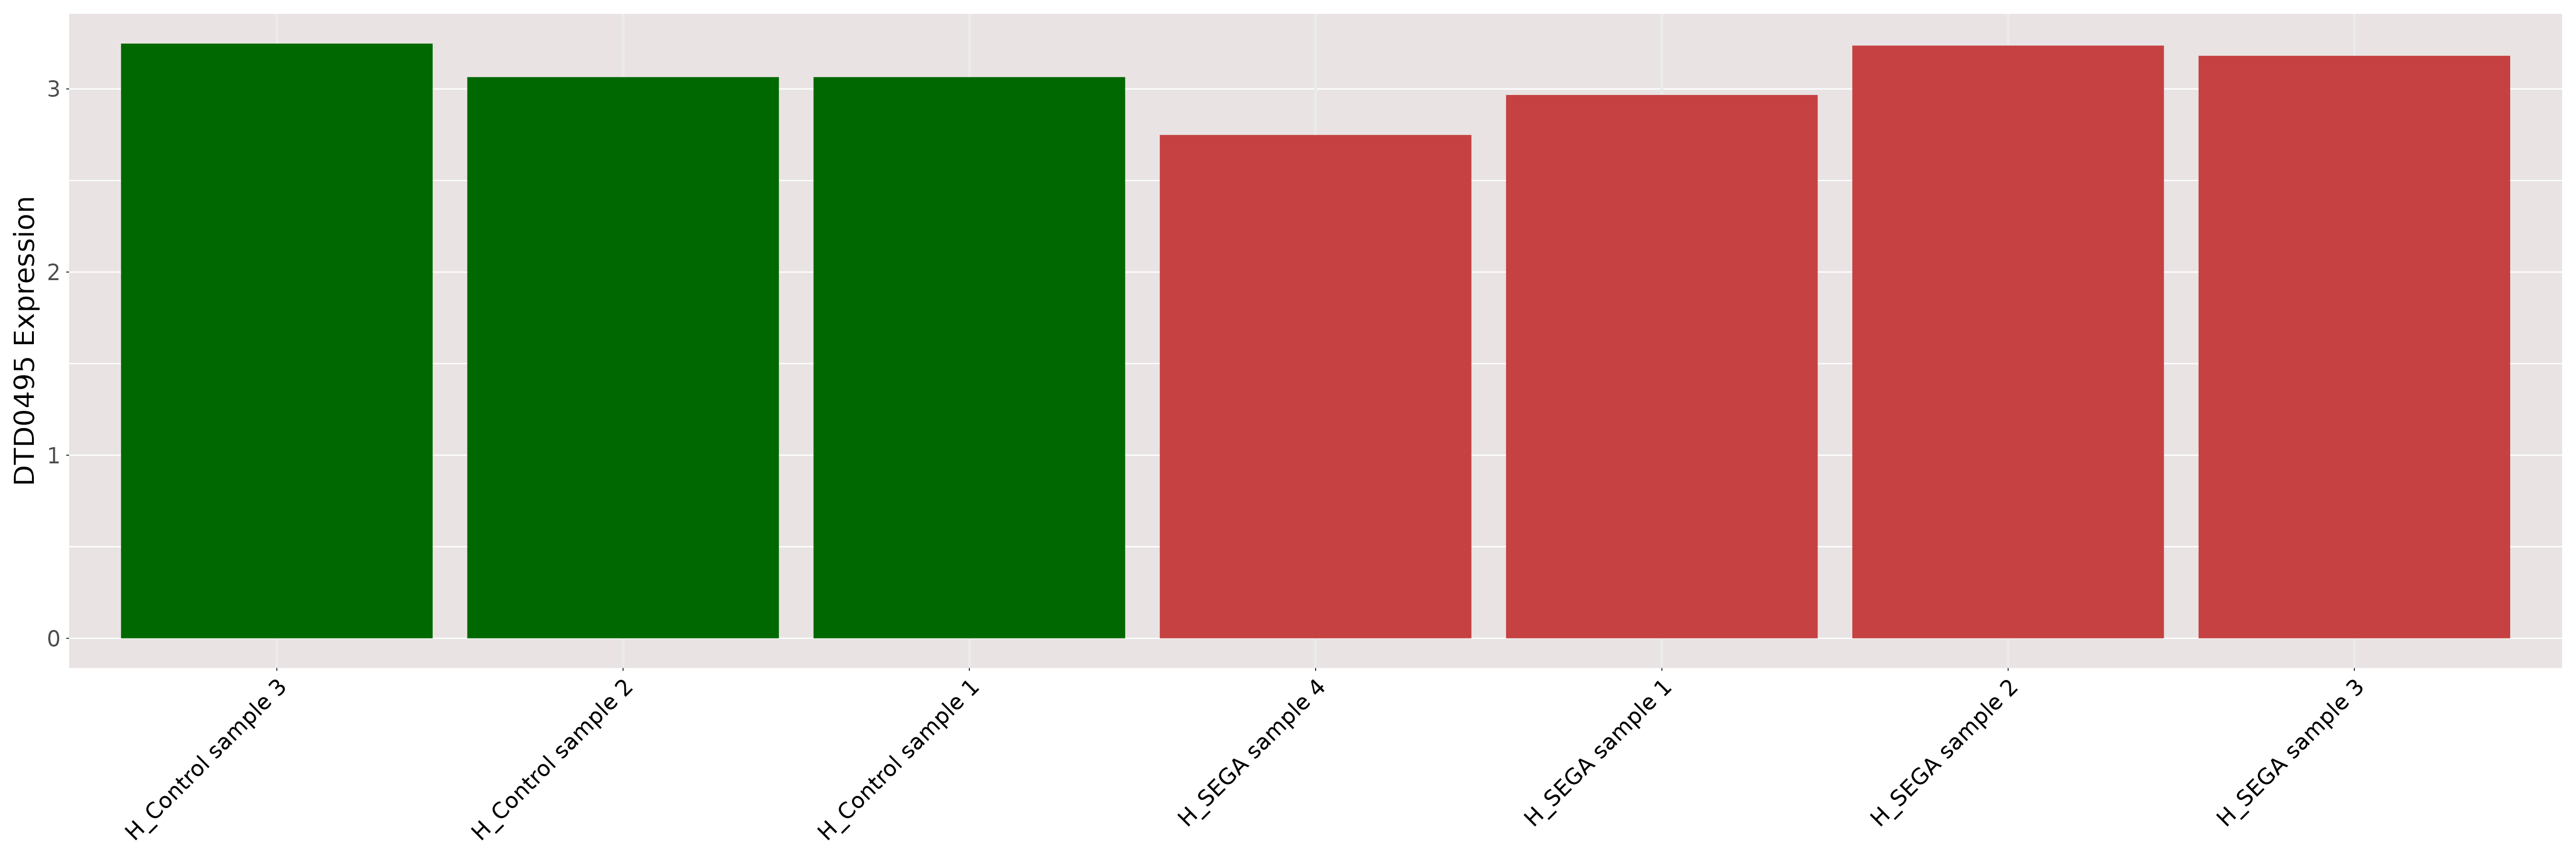
| ICD-11: 01 Certain infectious or parasitic disease | |||||
| [+] ICD-11: 1E50.1 Acute hepatitis B (viral hepatitis B) | Click to Show/Hide the Full List | ||||
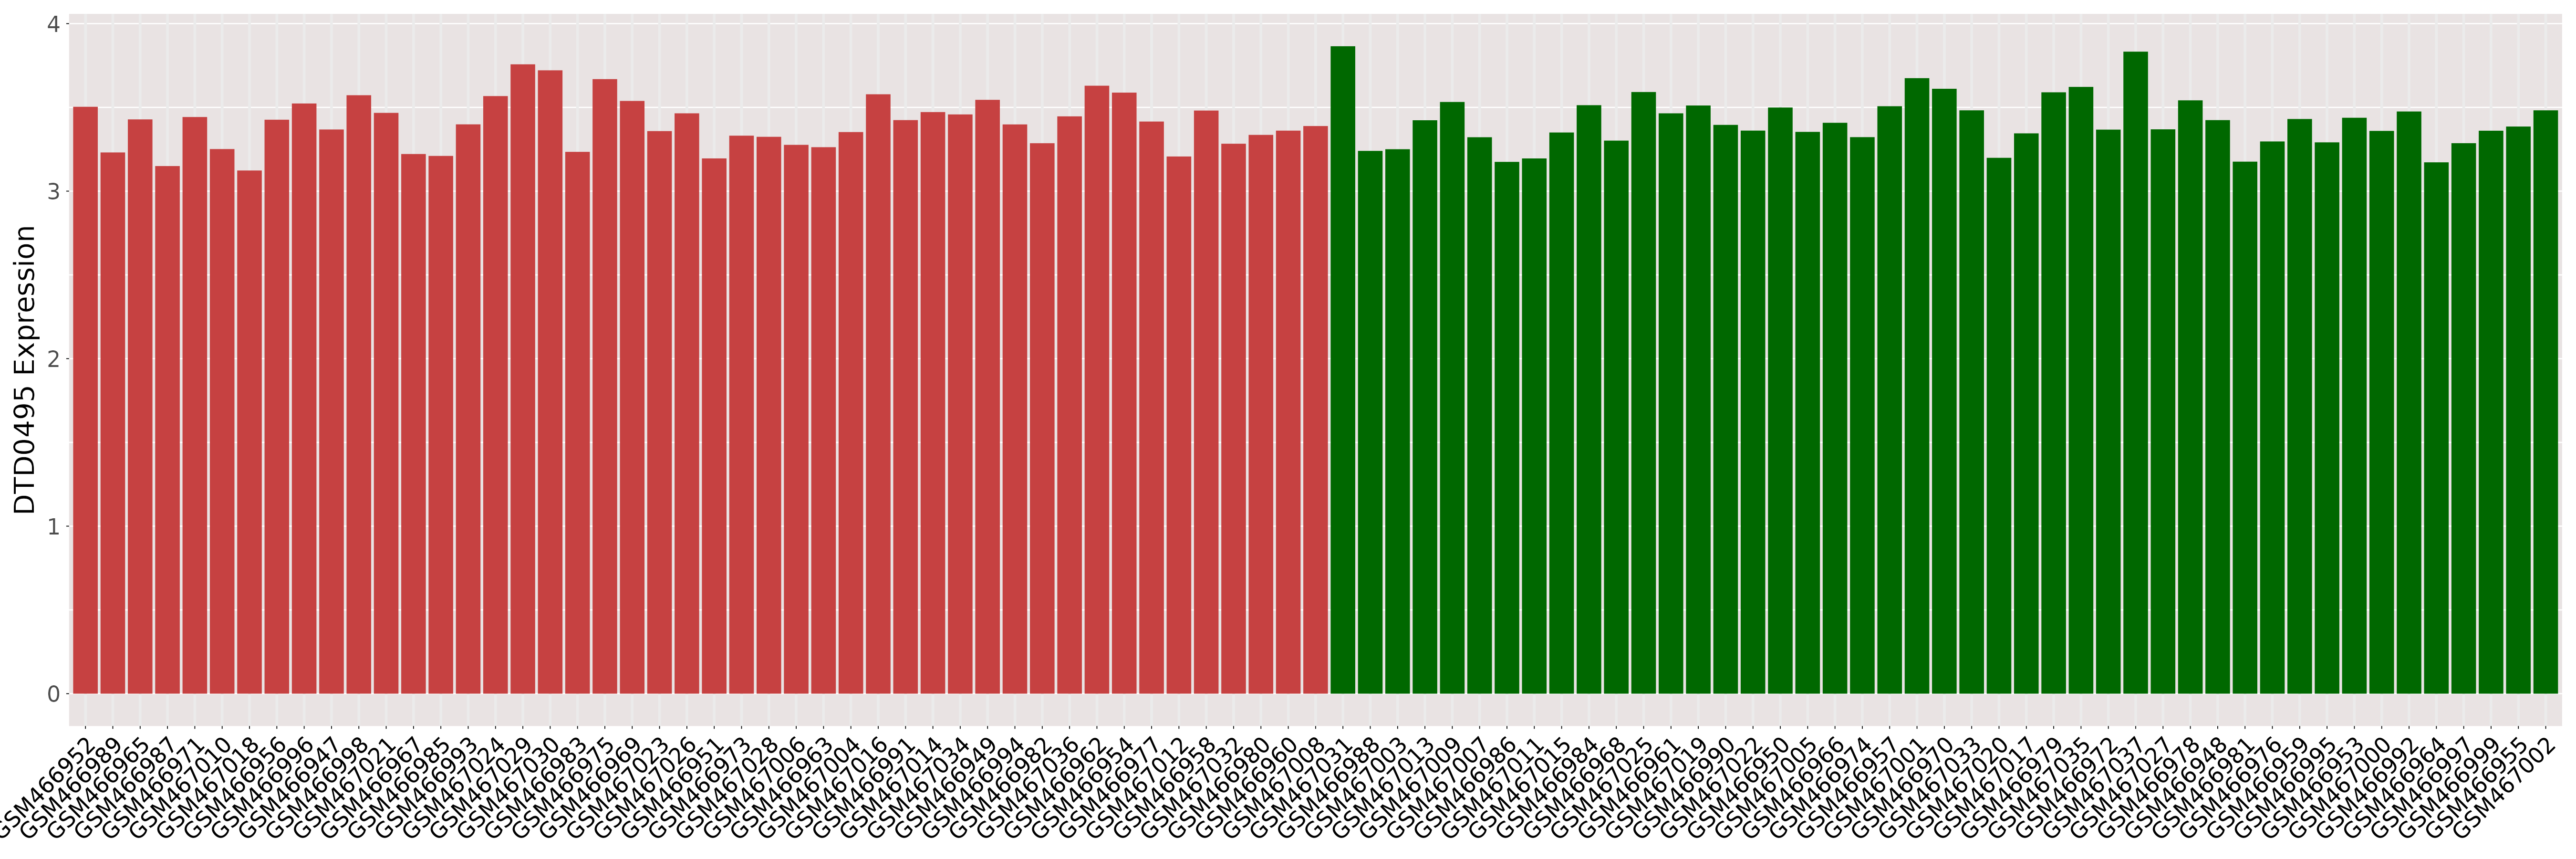
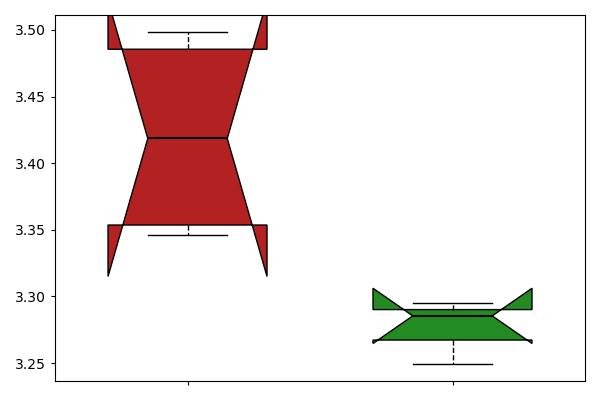
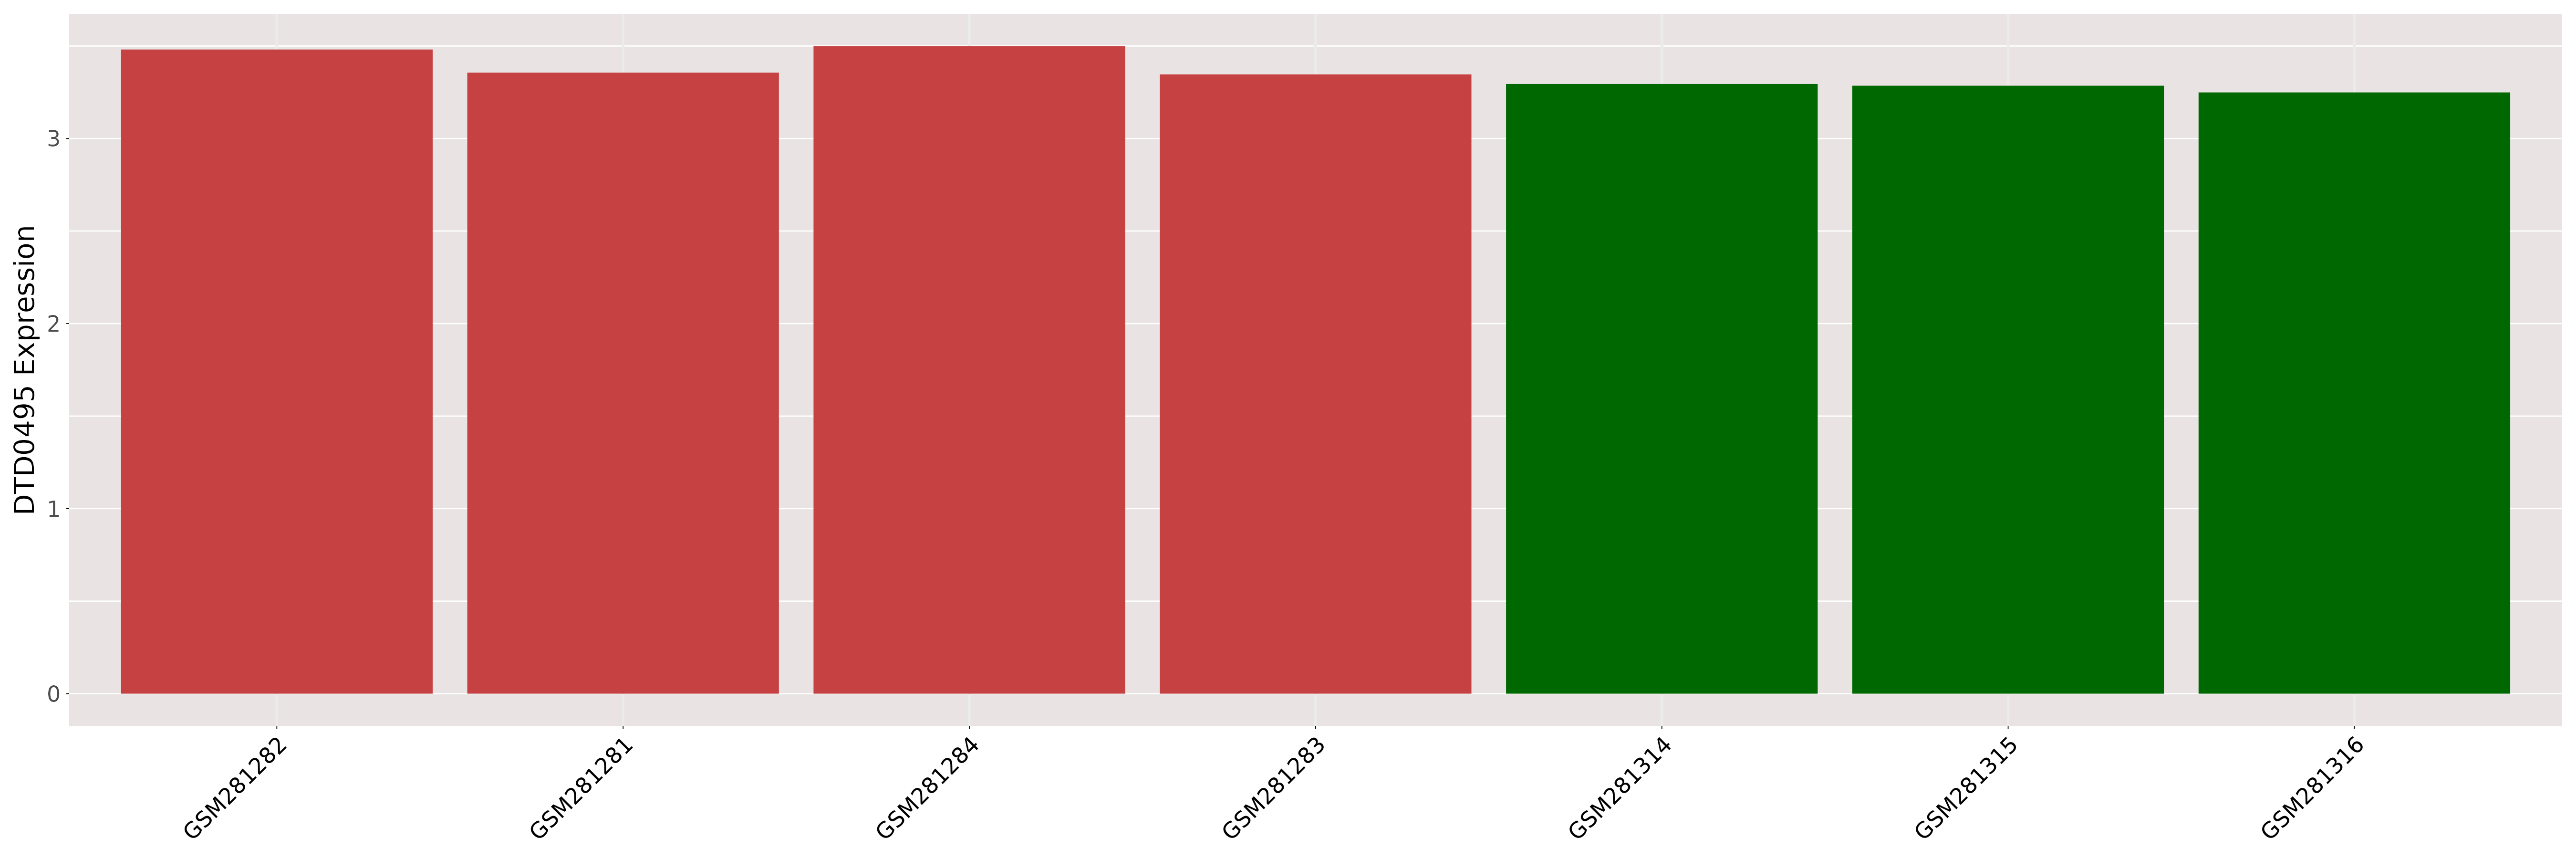
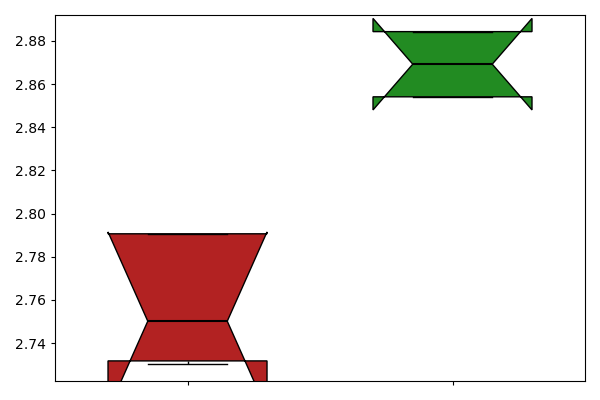
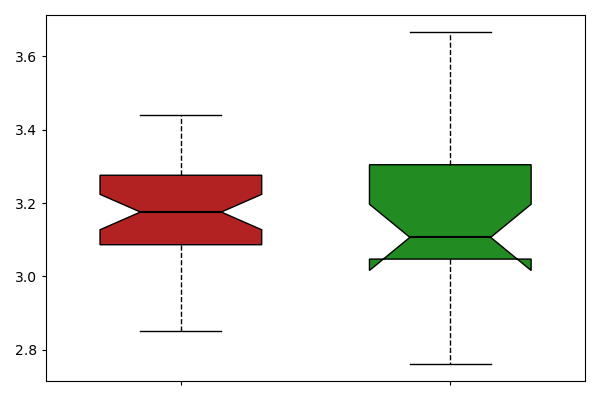
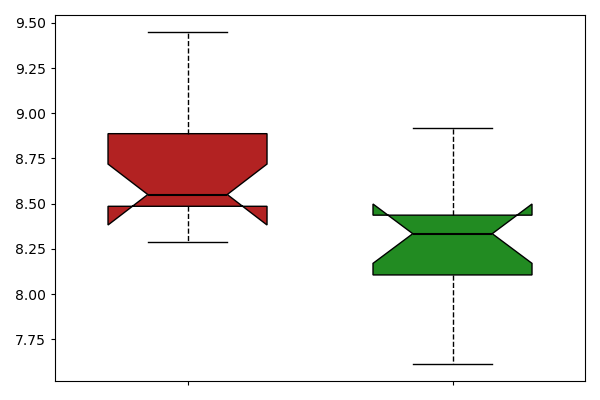
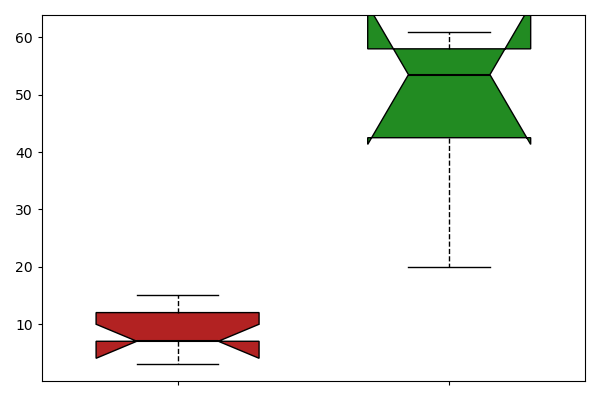
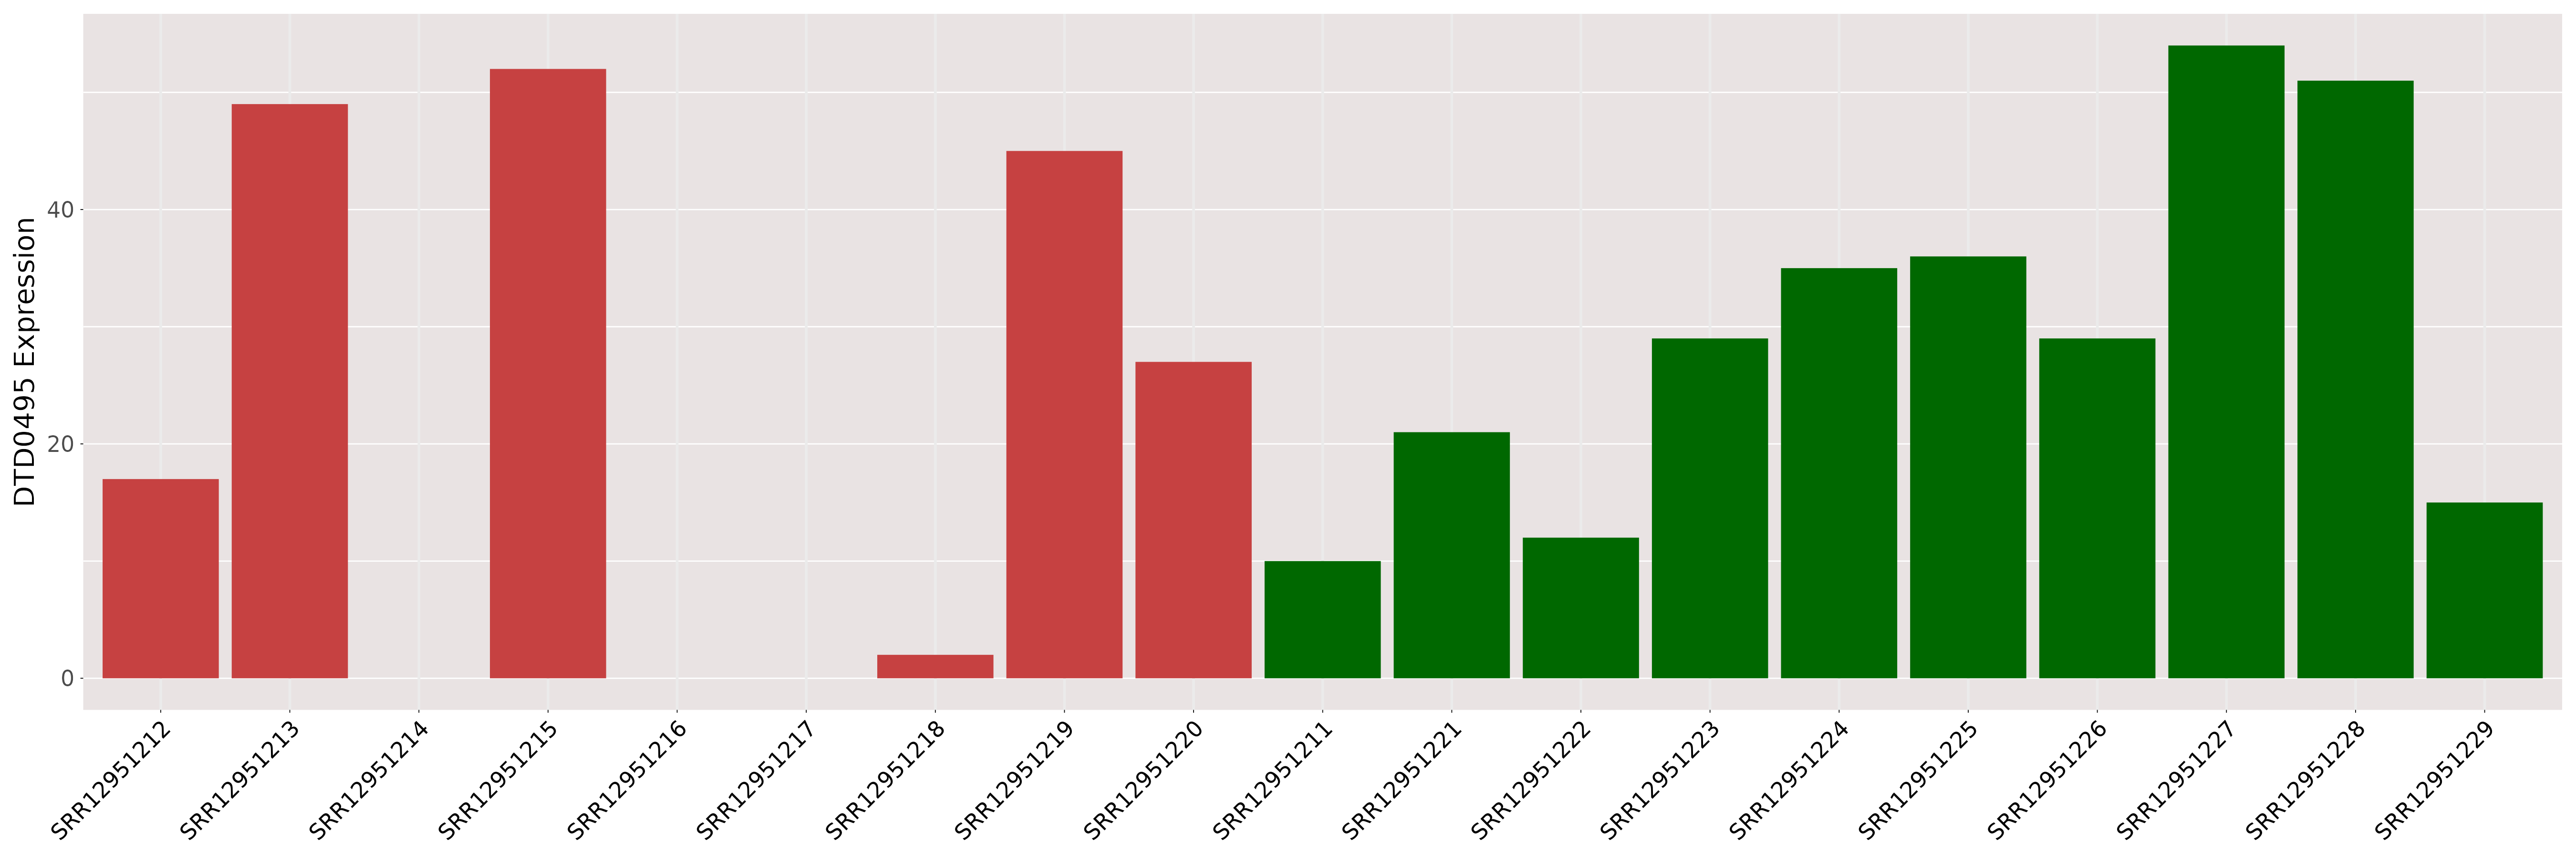
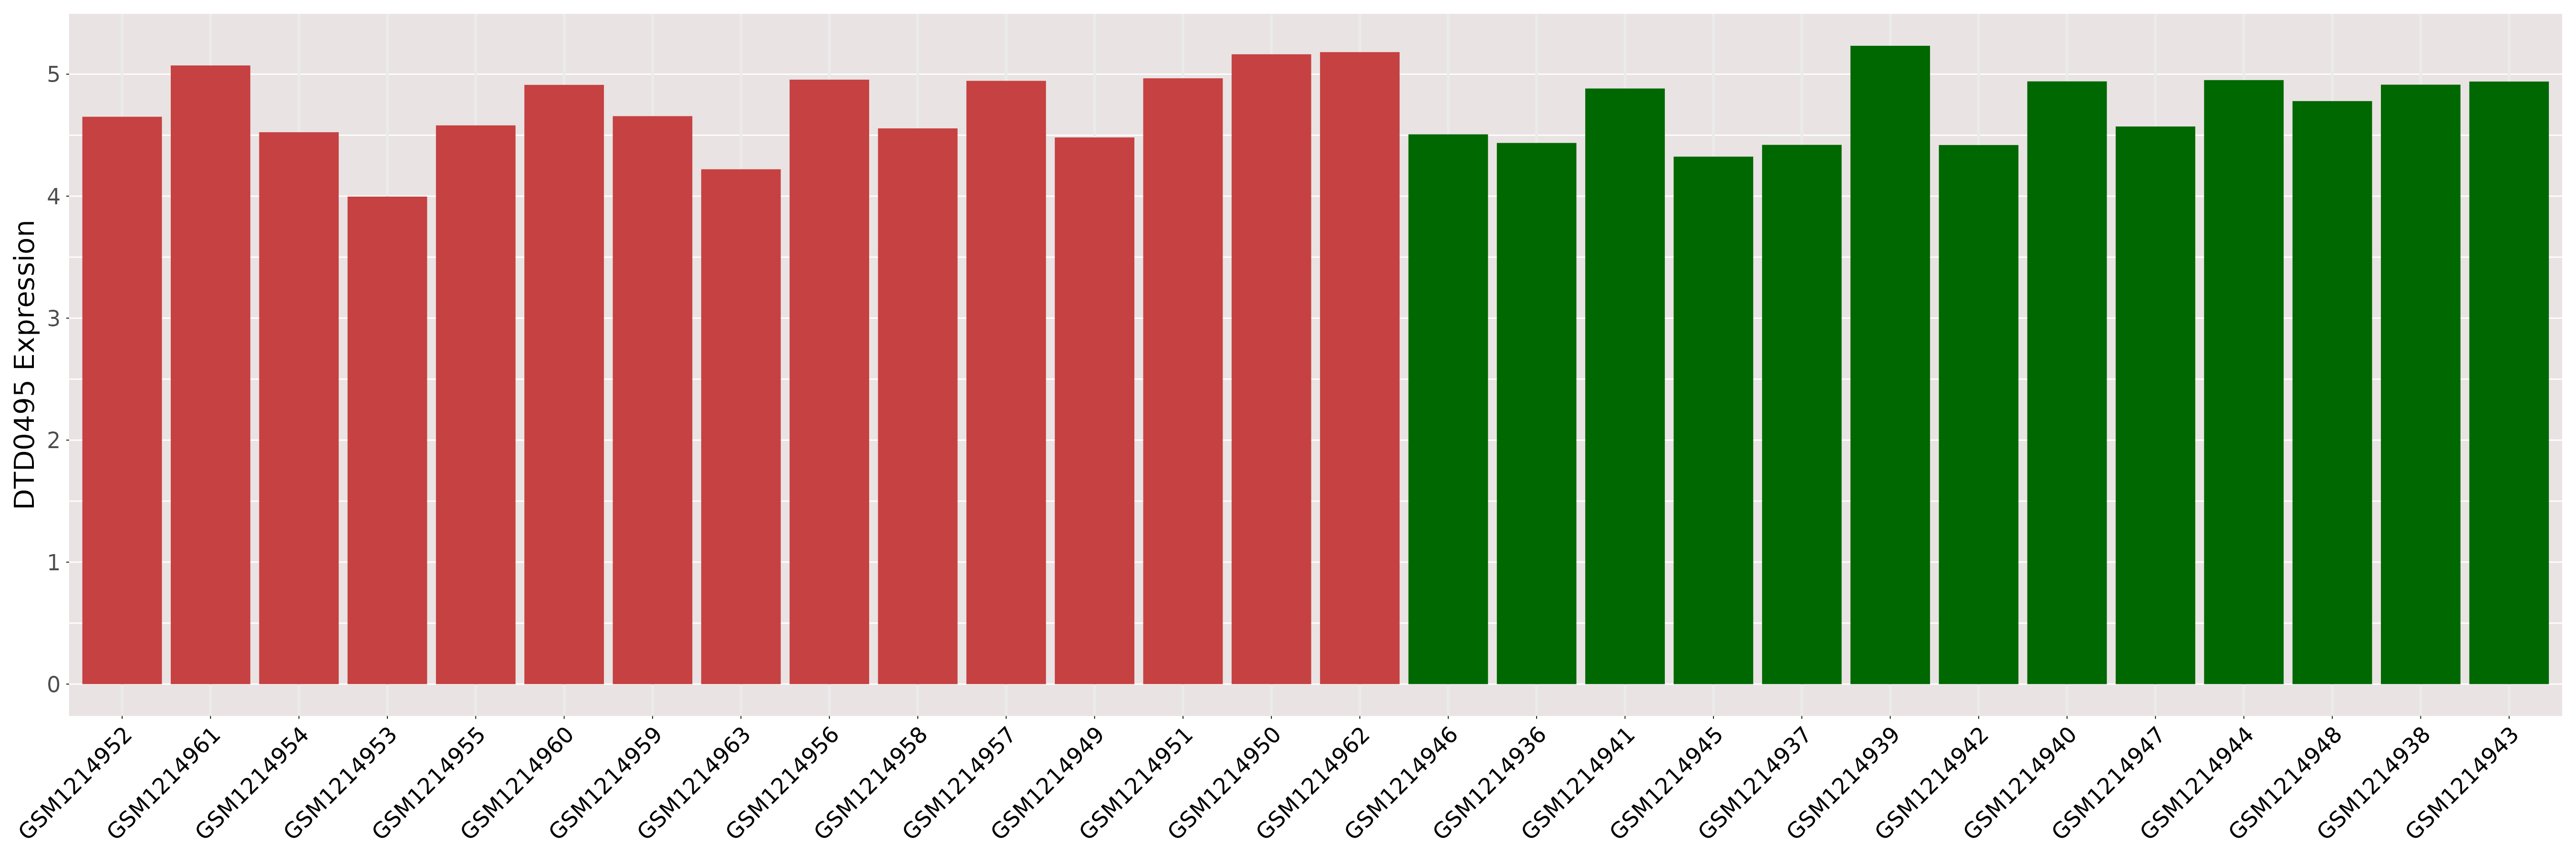
| The Studied Tissue | Liver | ||||
| The Specified Disease | Hepatitis b virus infection [ICD-11:1E50.1] | ||||
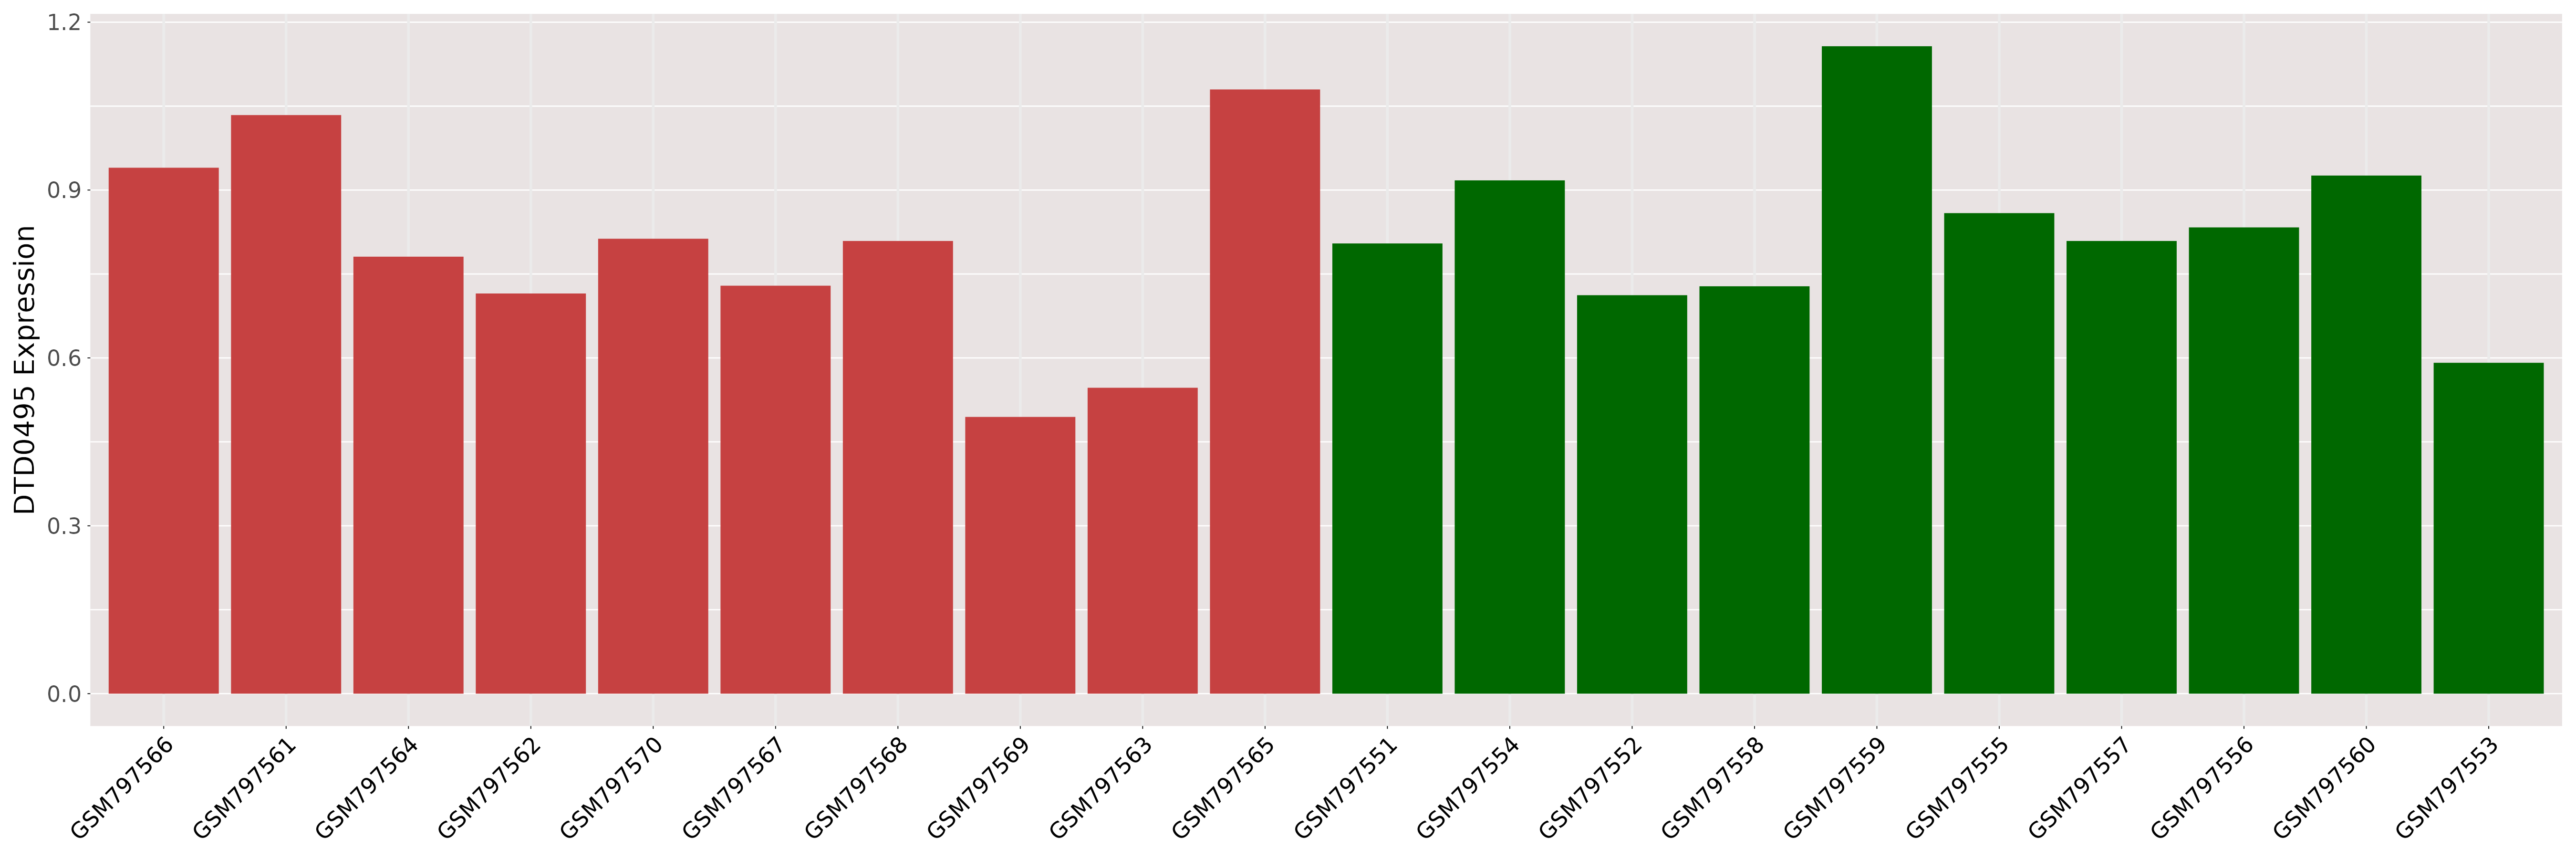
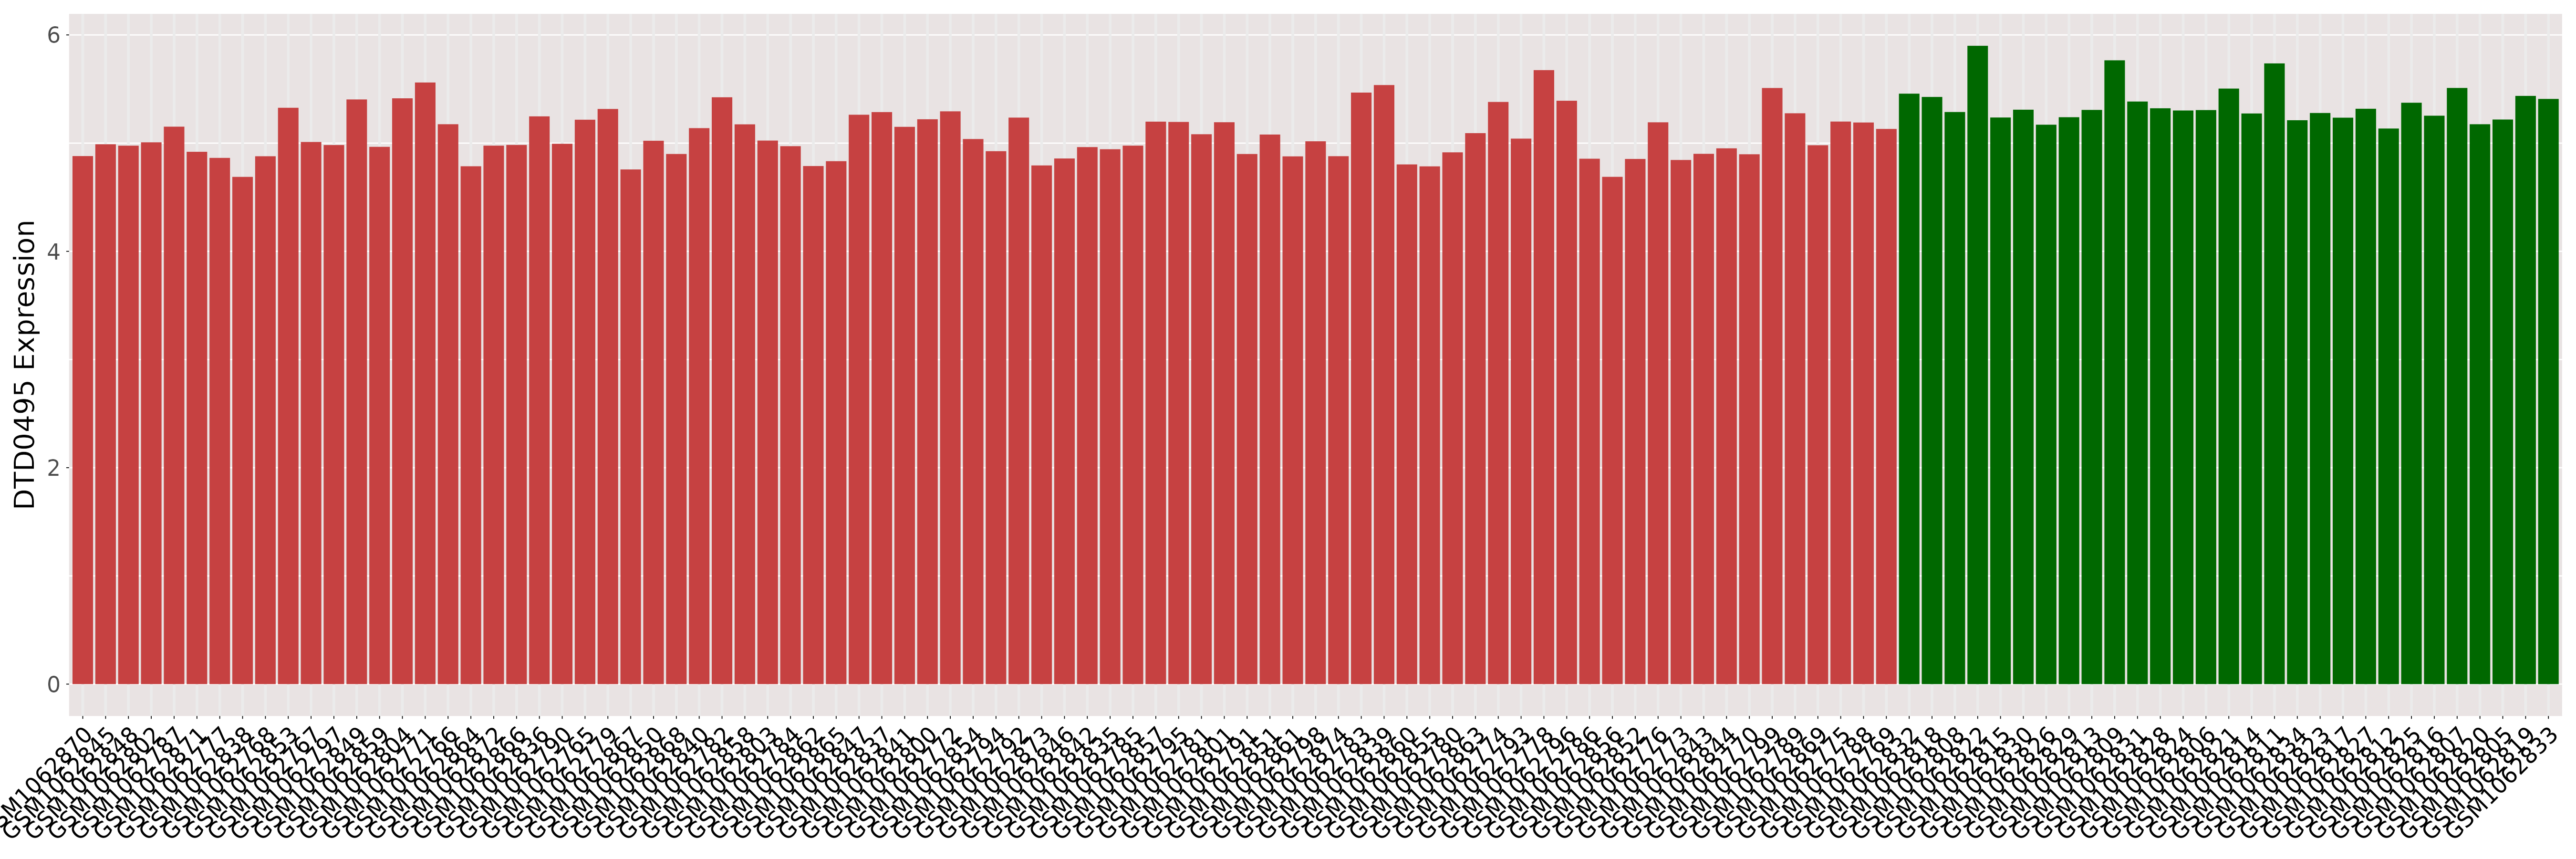
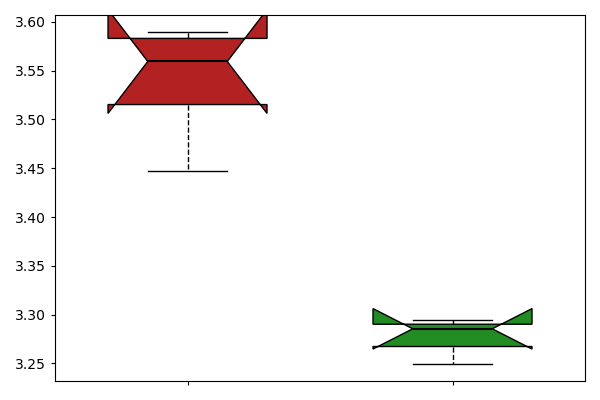
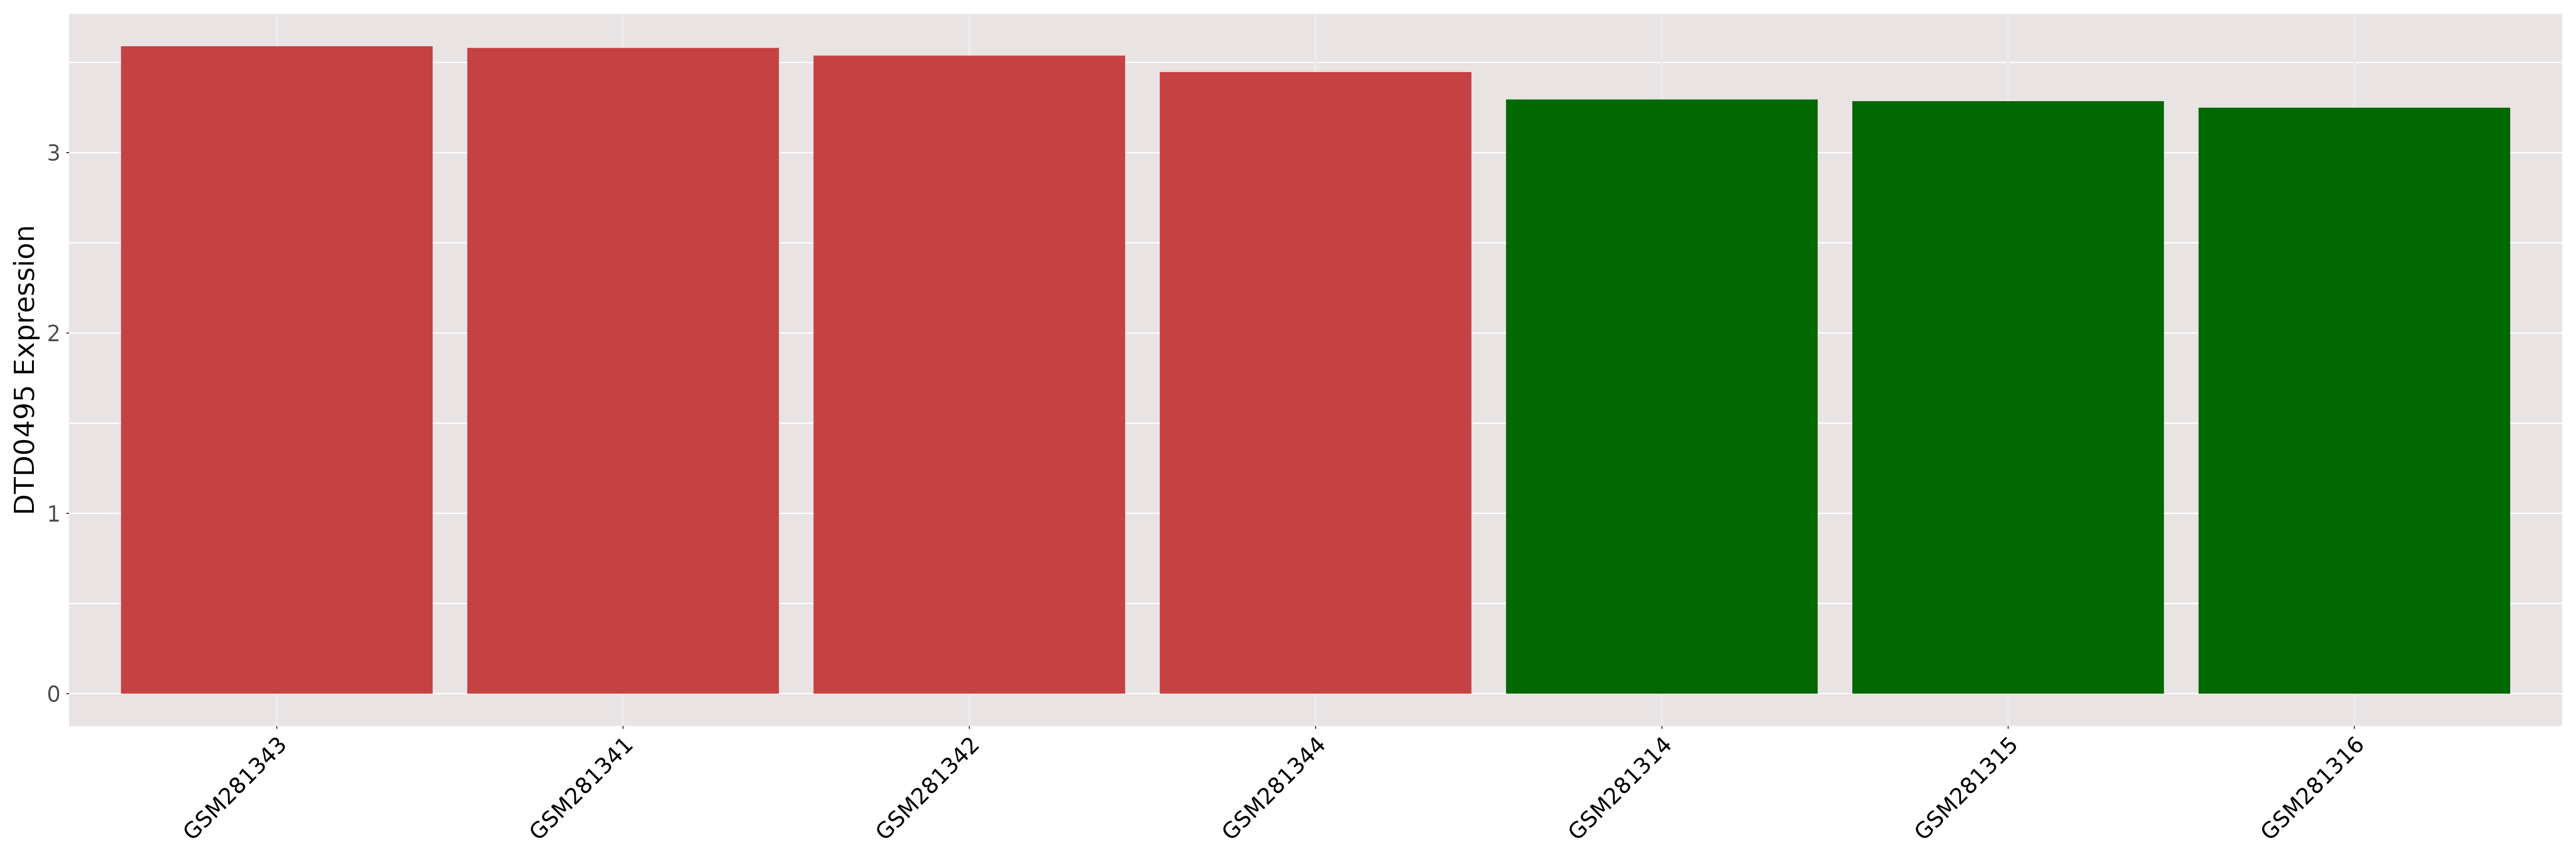
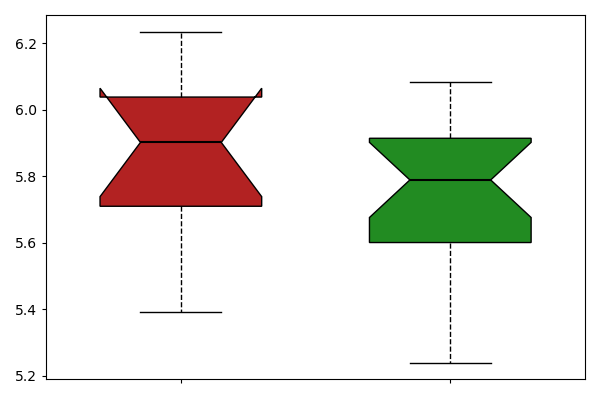
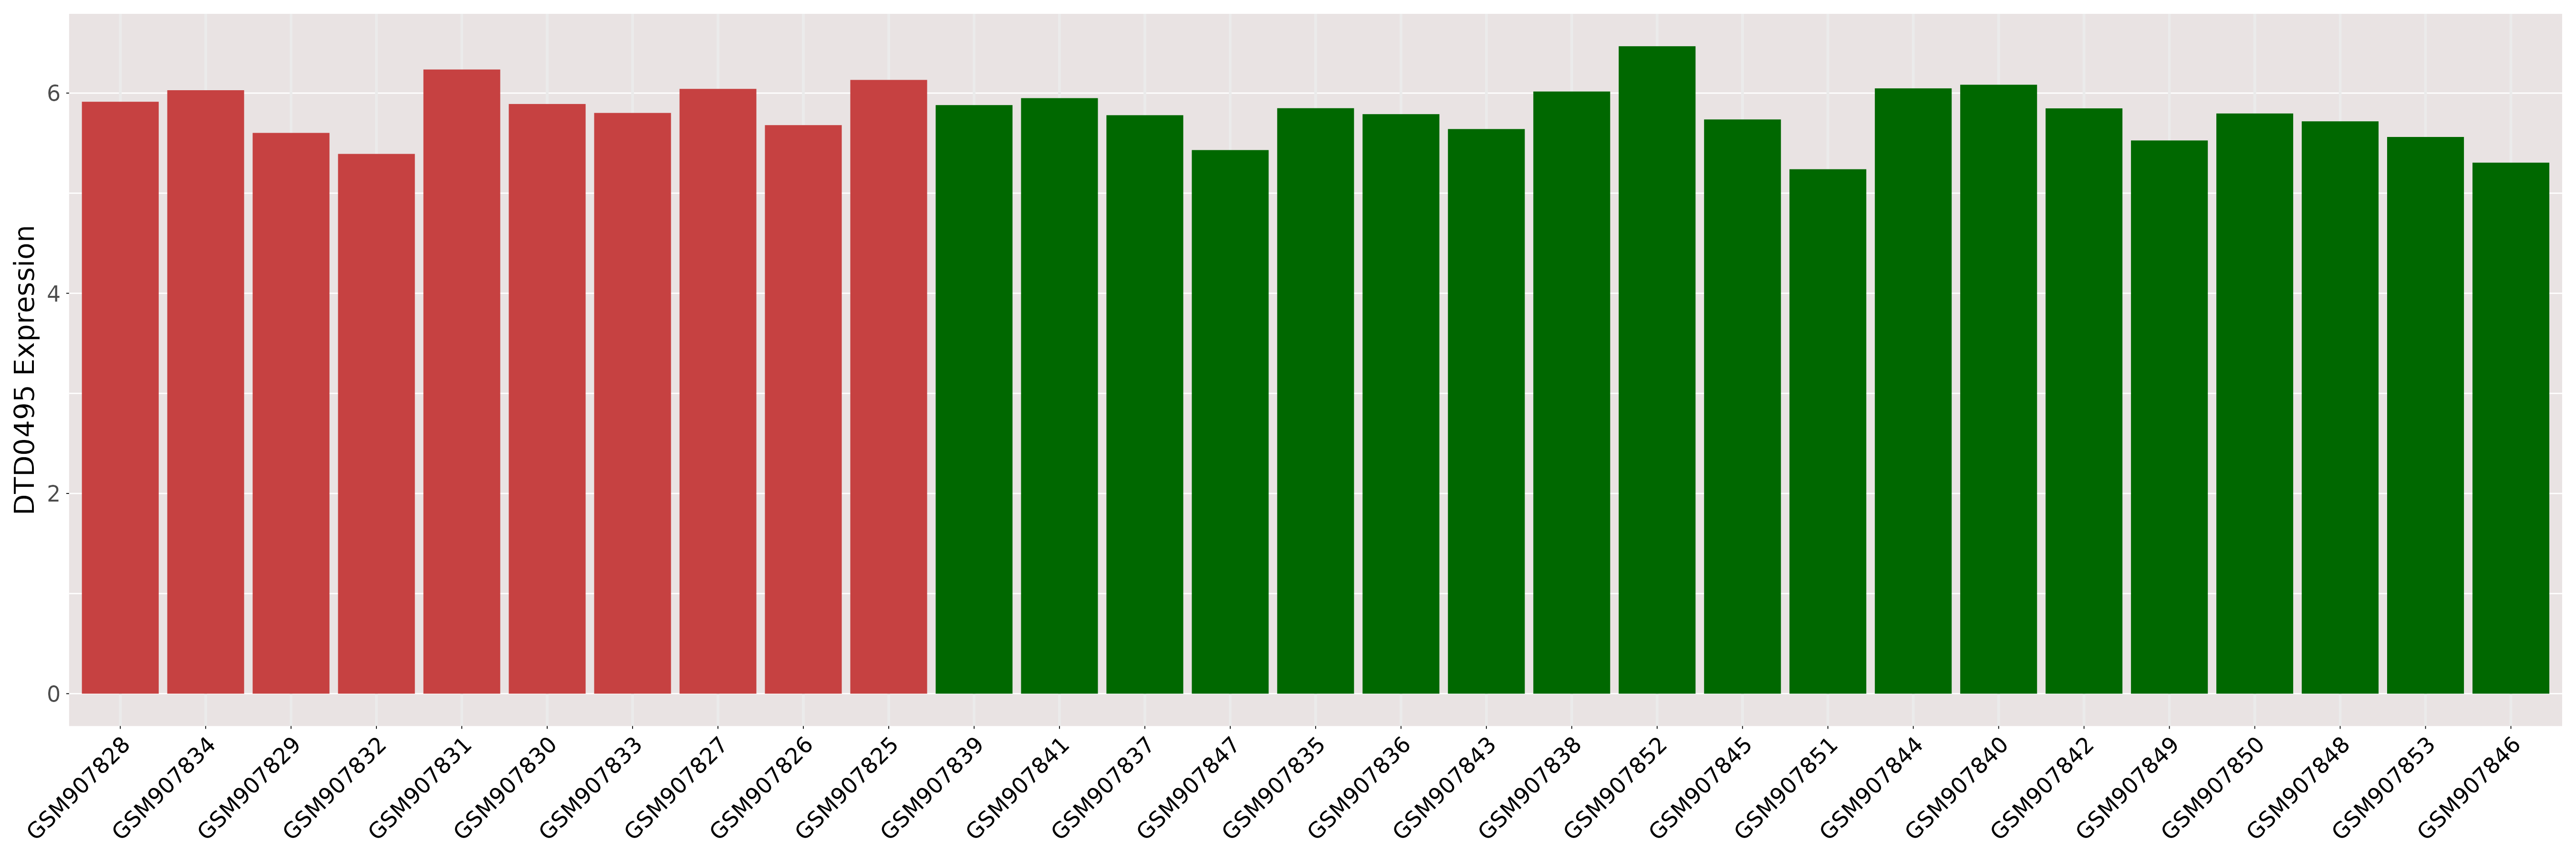
| The Expression Level of Disease Section Compare with the Healthy Individual Tissue | p-value:0.7381113065979171; Fold-change:0.9859382273833136; Z-score:0.1909036956574281 | ||||
|
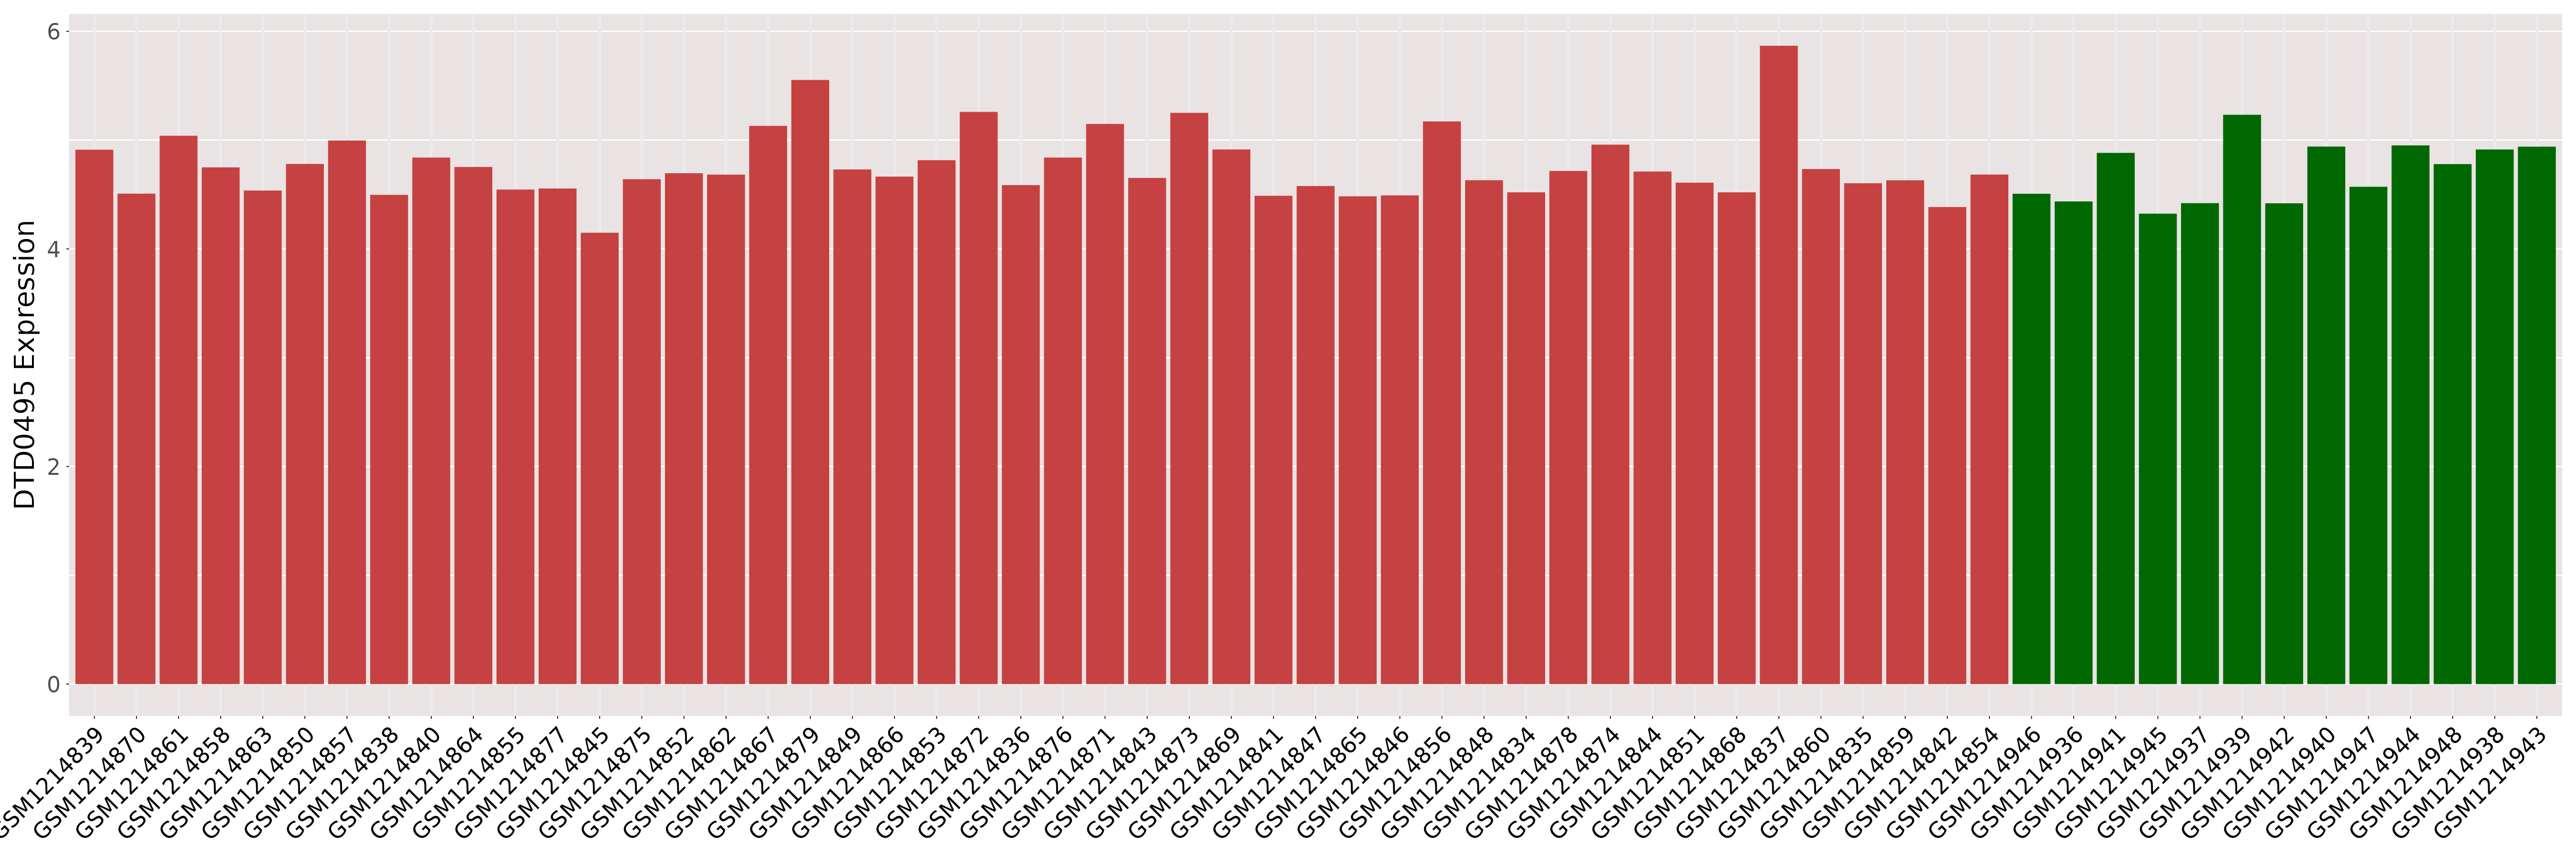
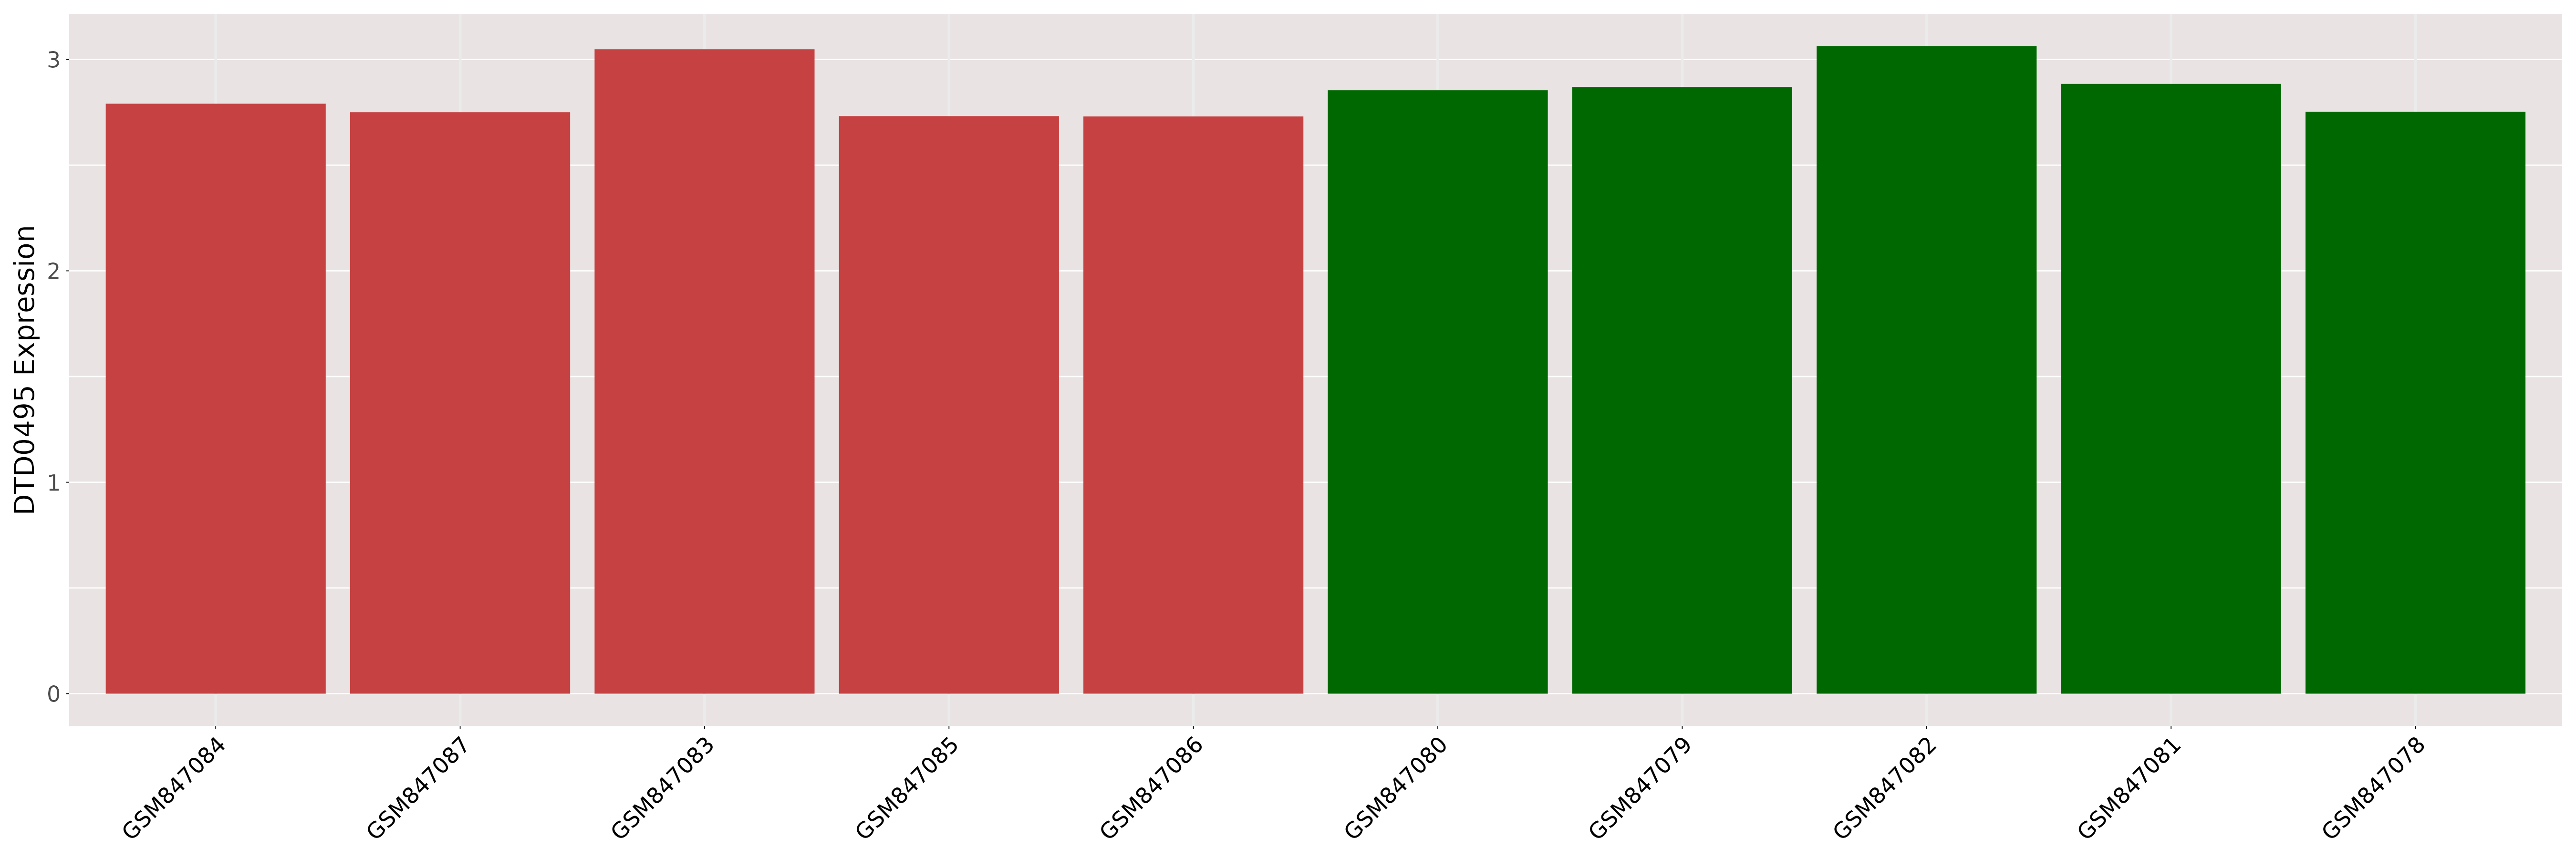
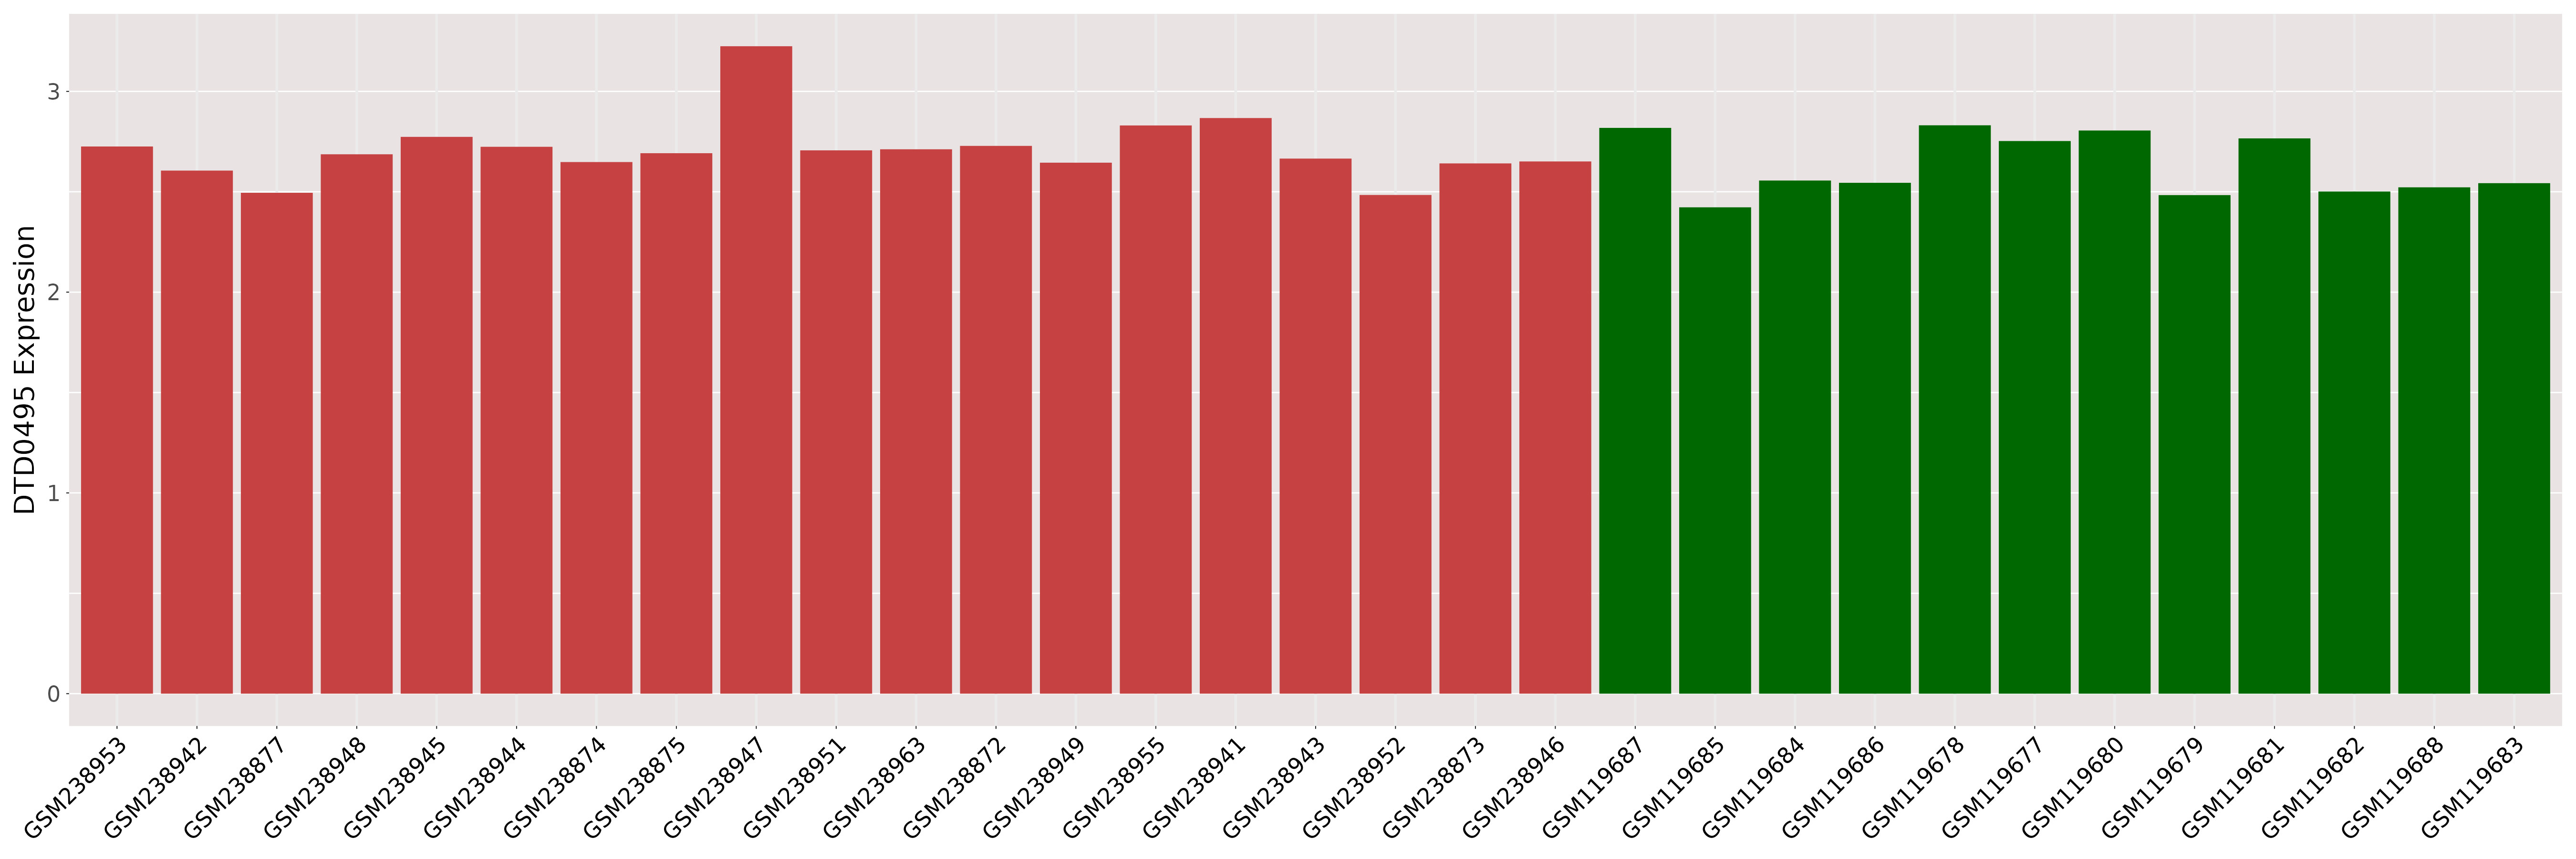
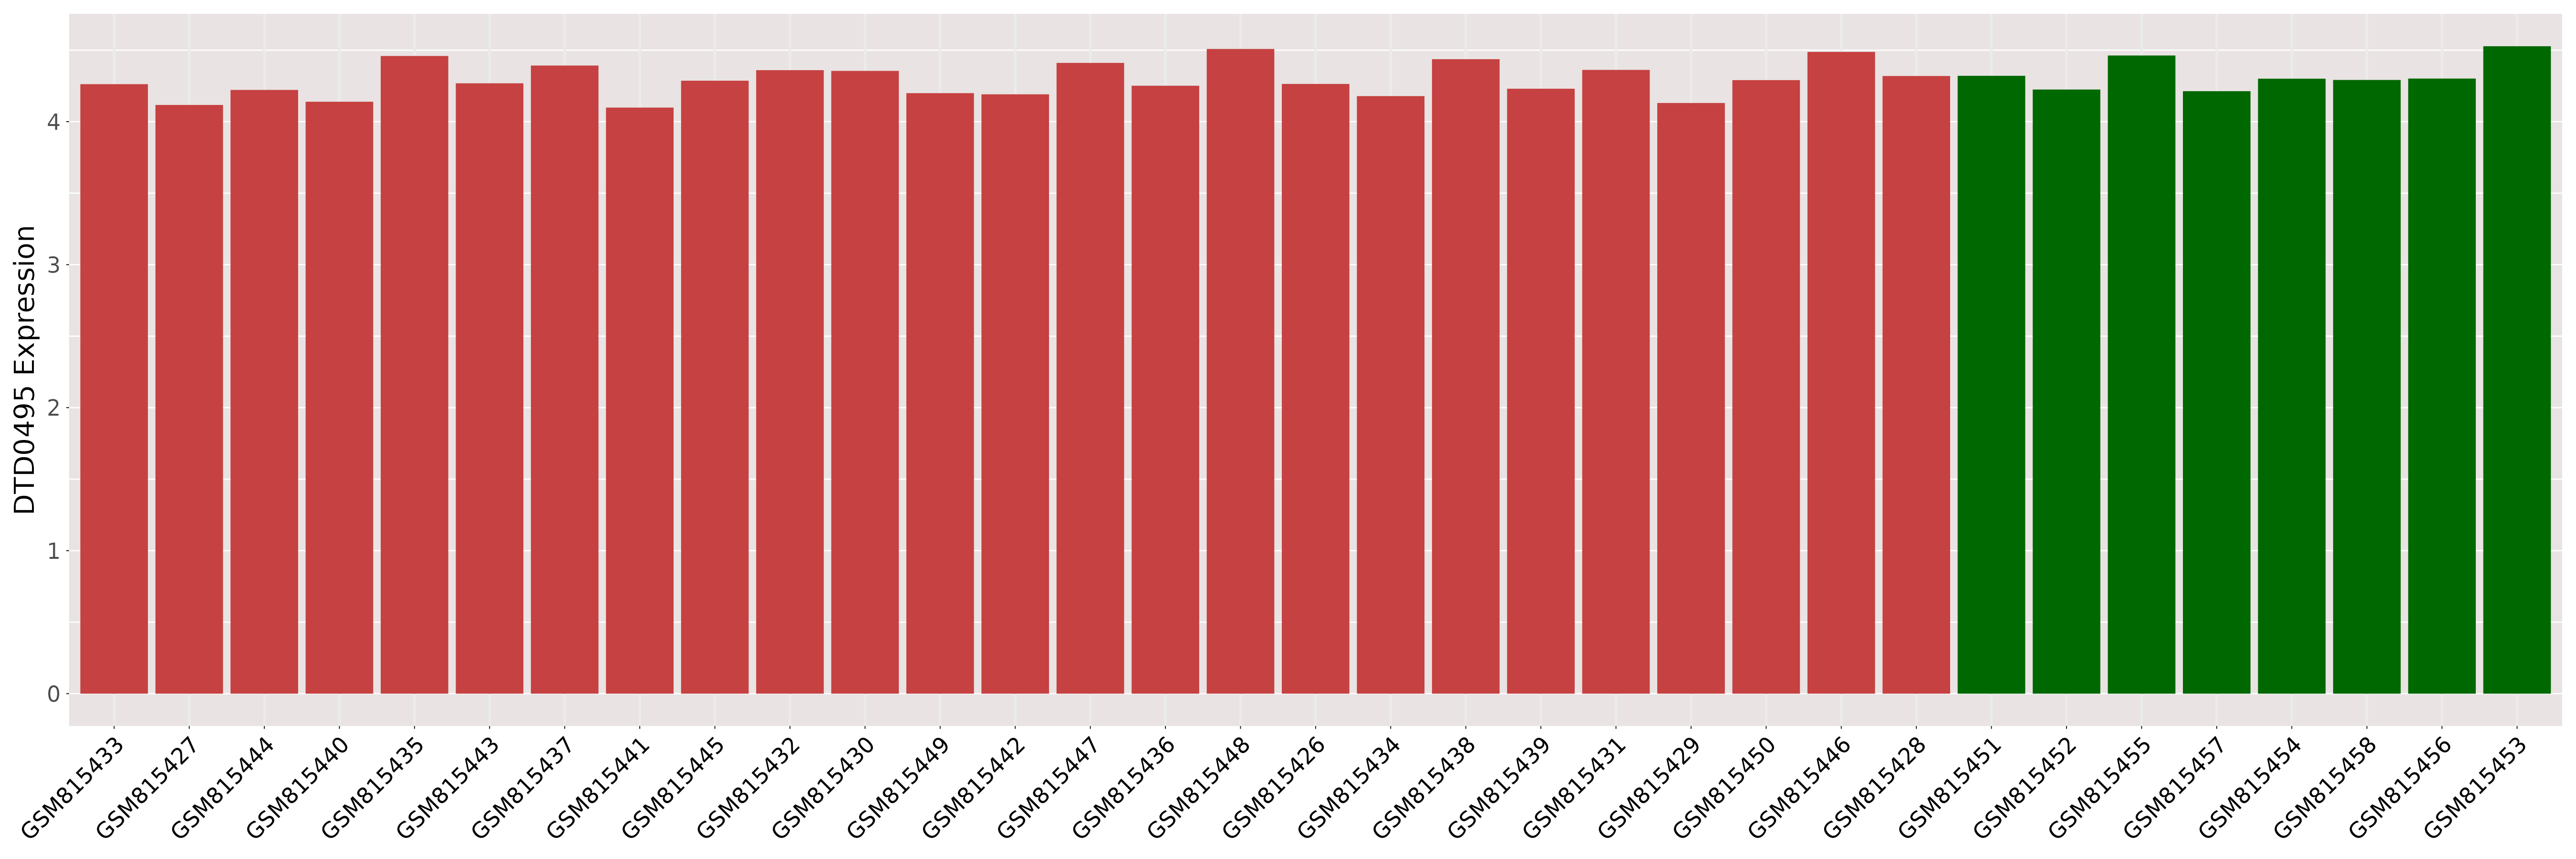
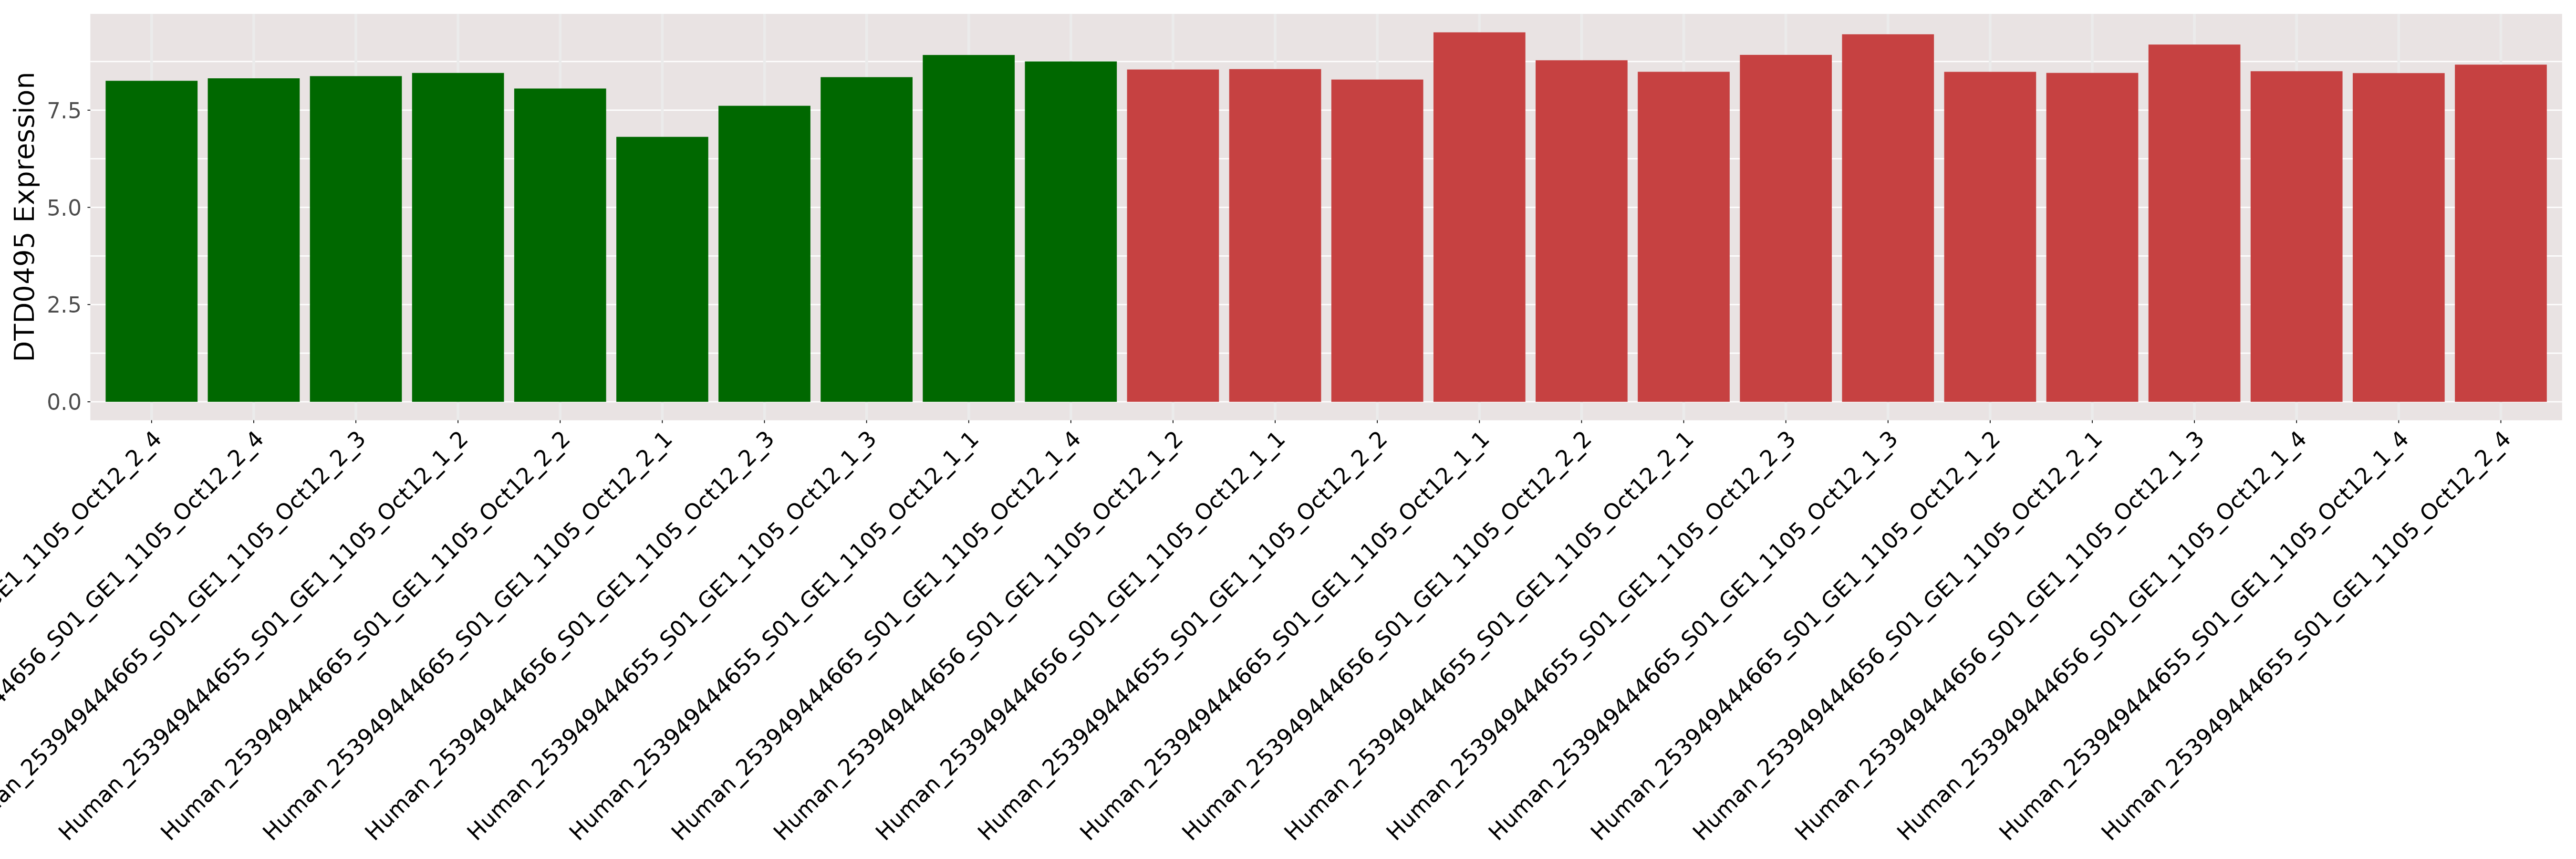
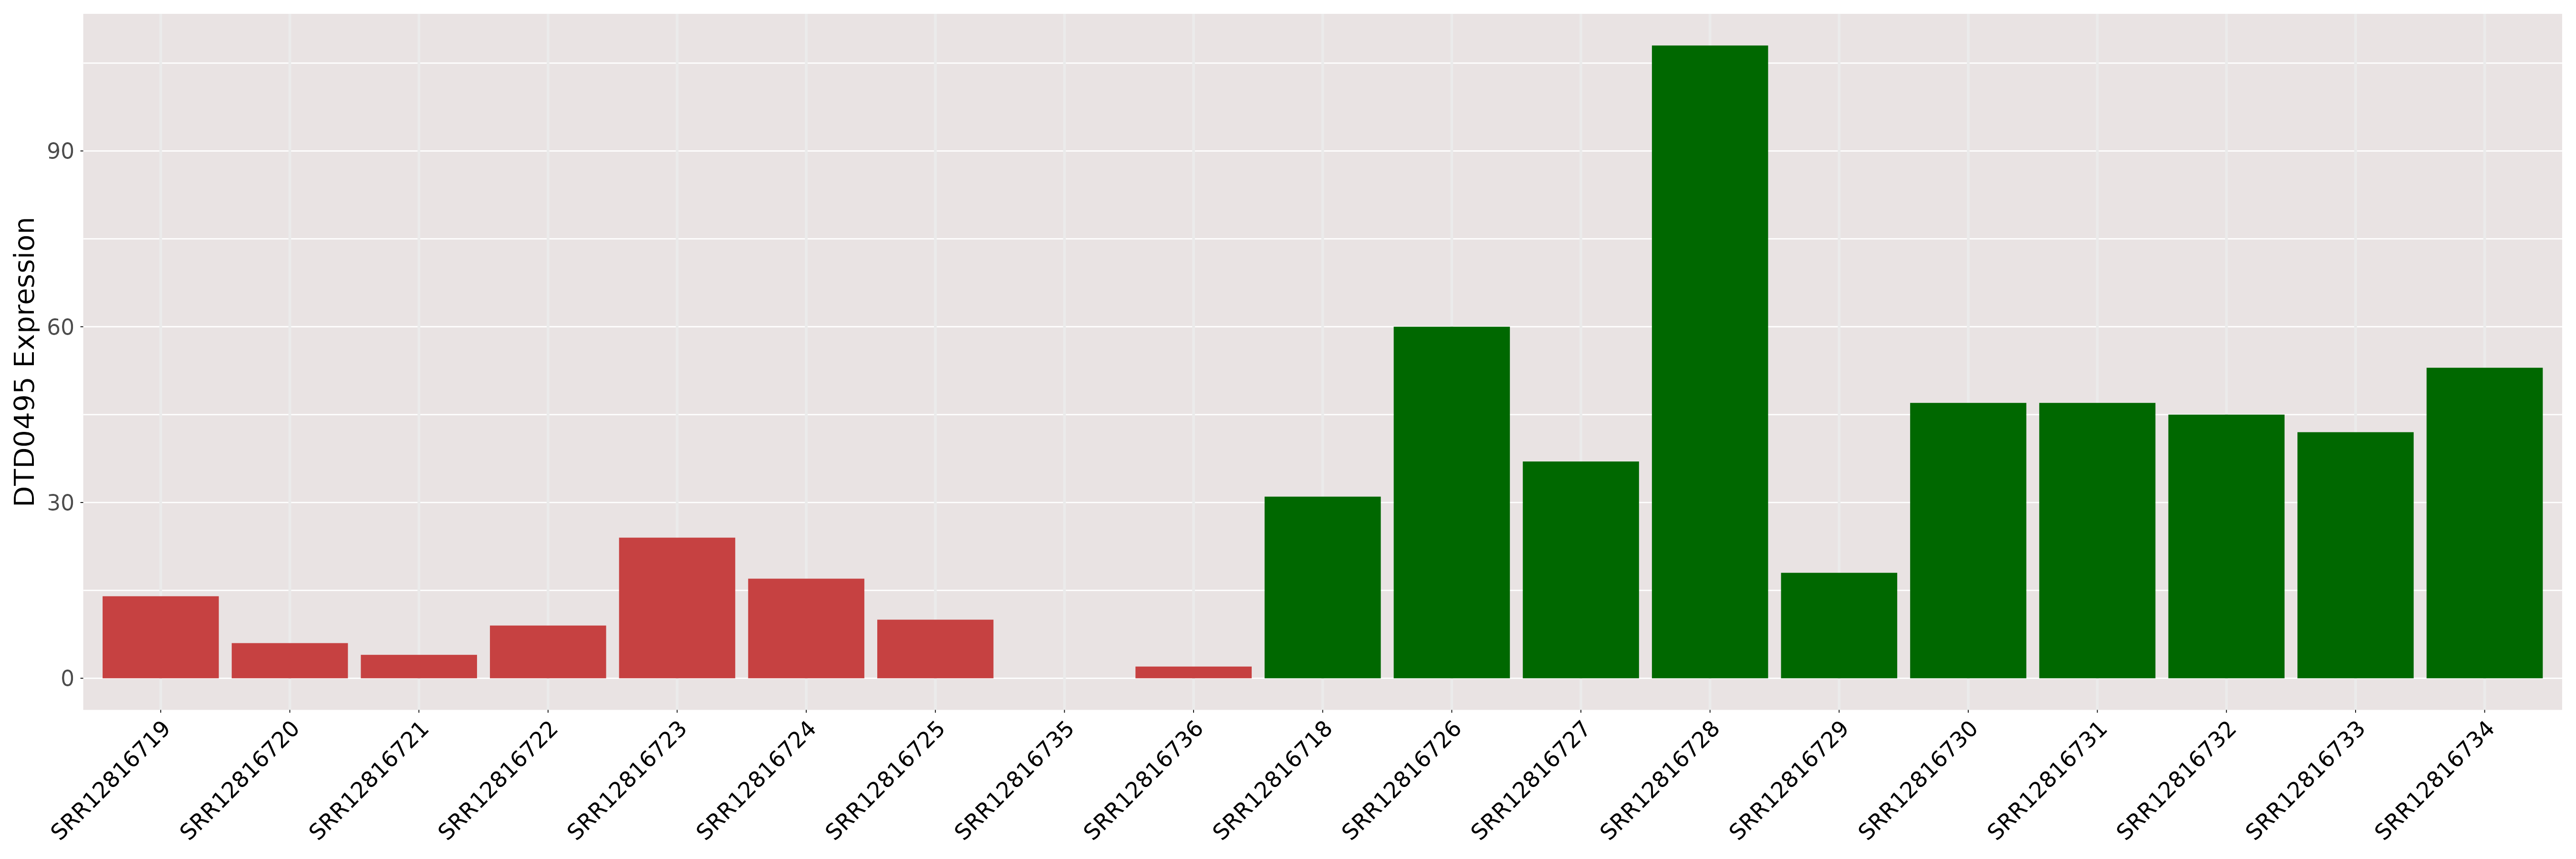
Please Click the above Thumbnail to View/Download the Expression Barchart for All Samples | ||||
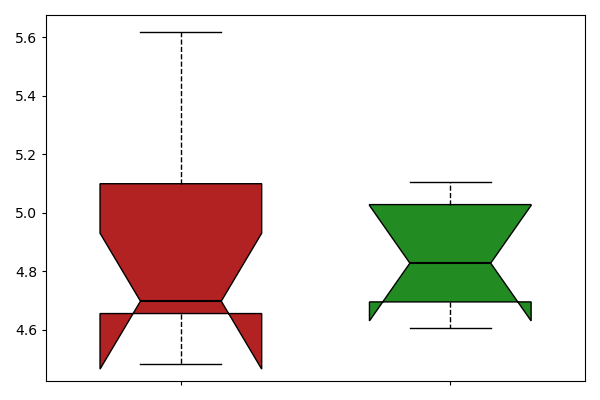
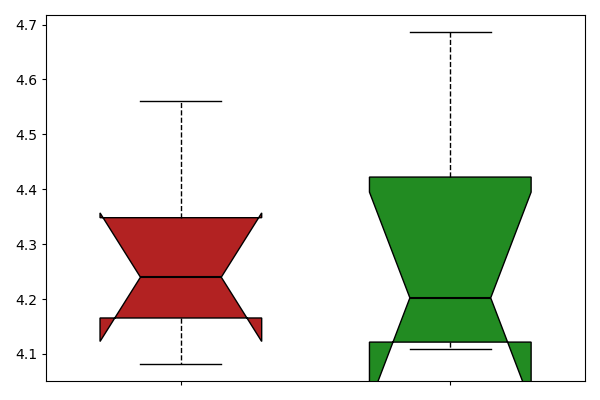
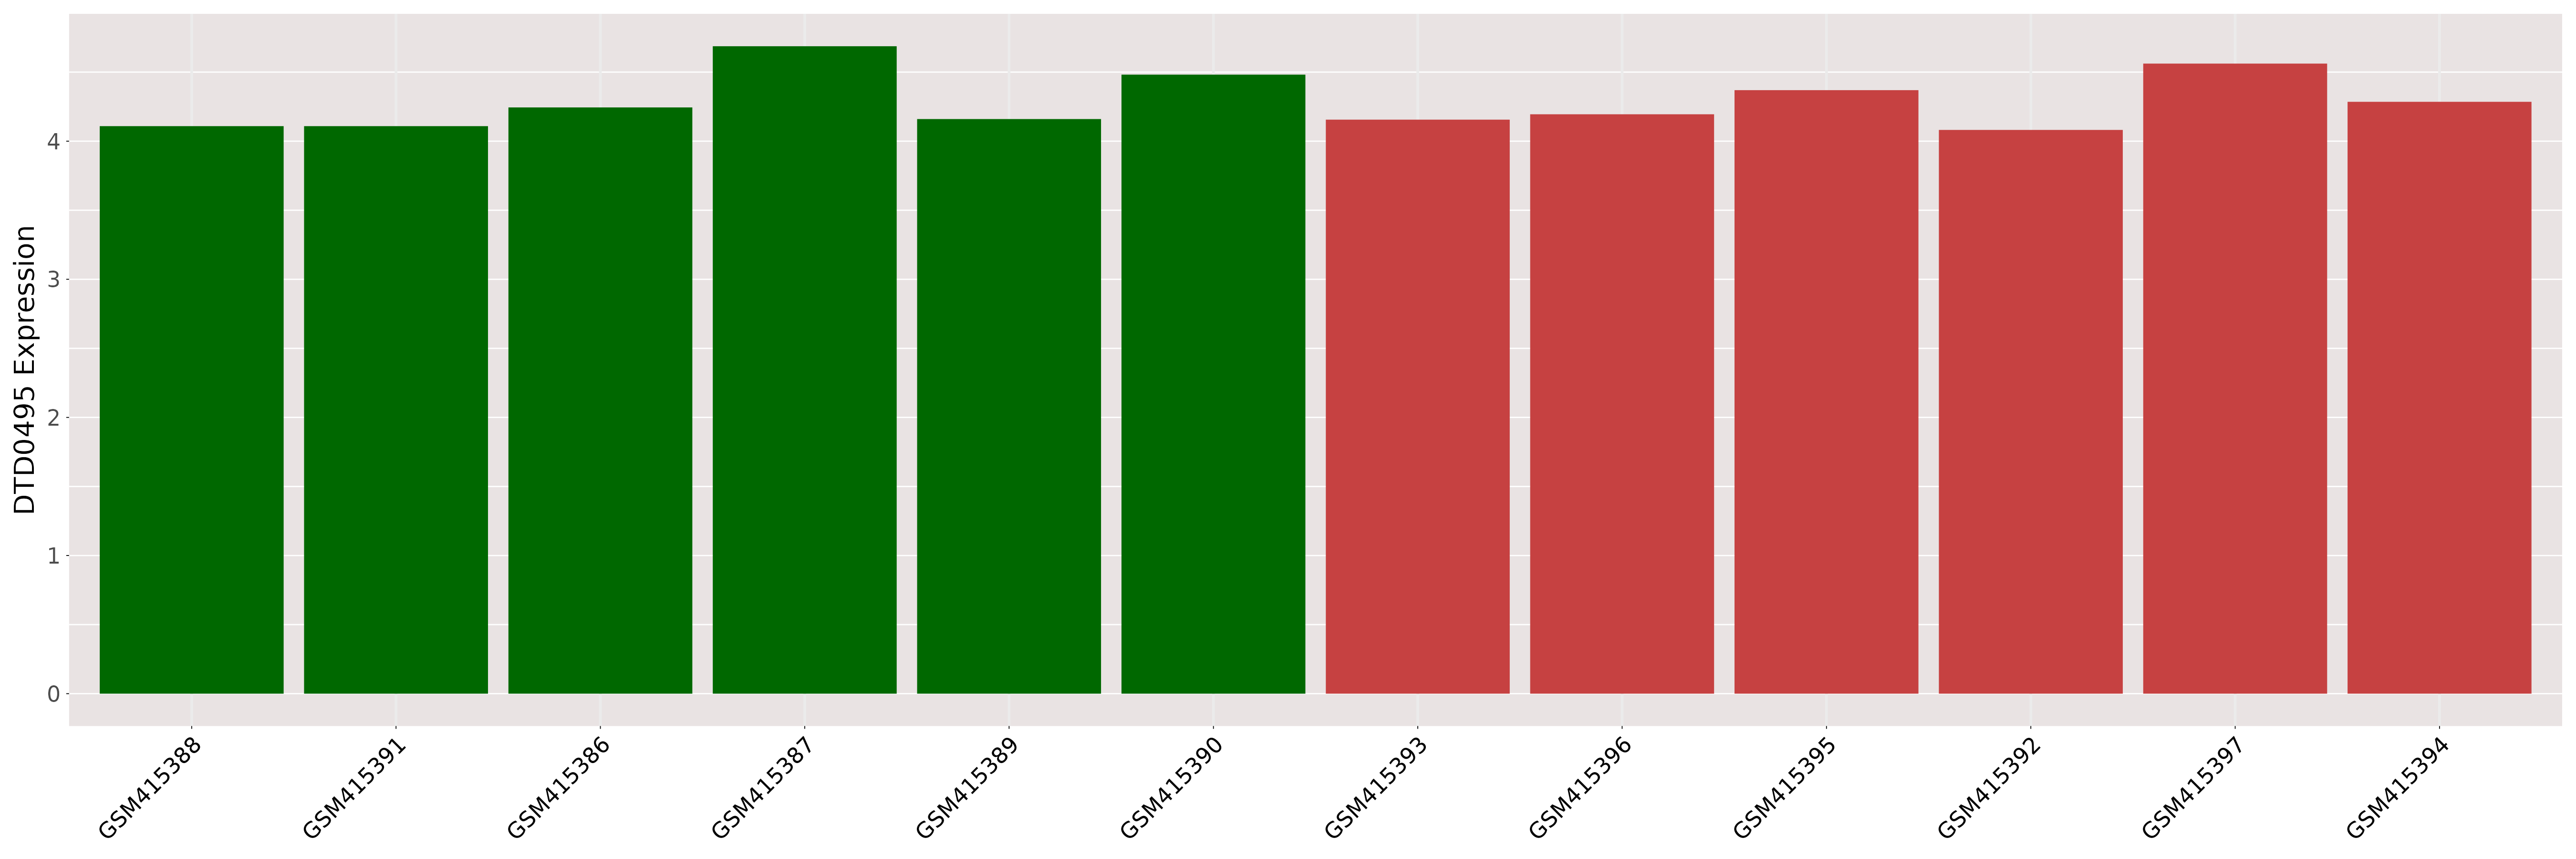
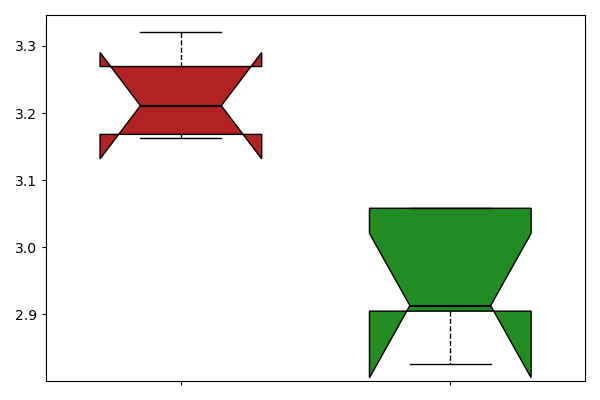
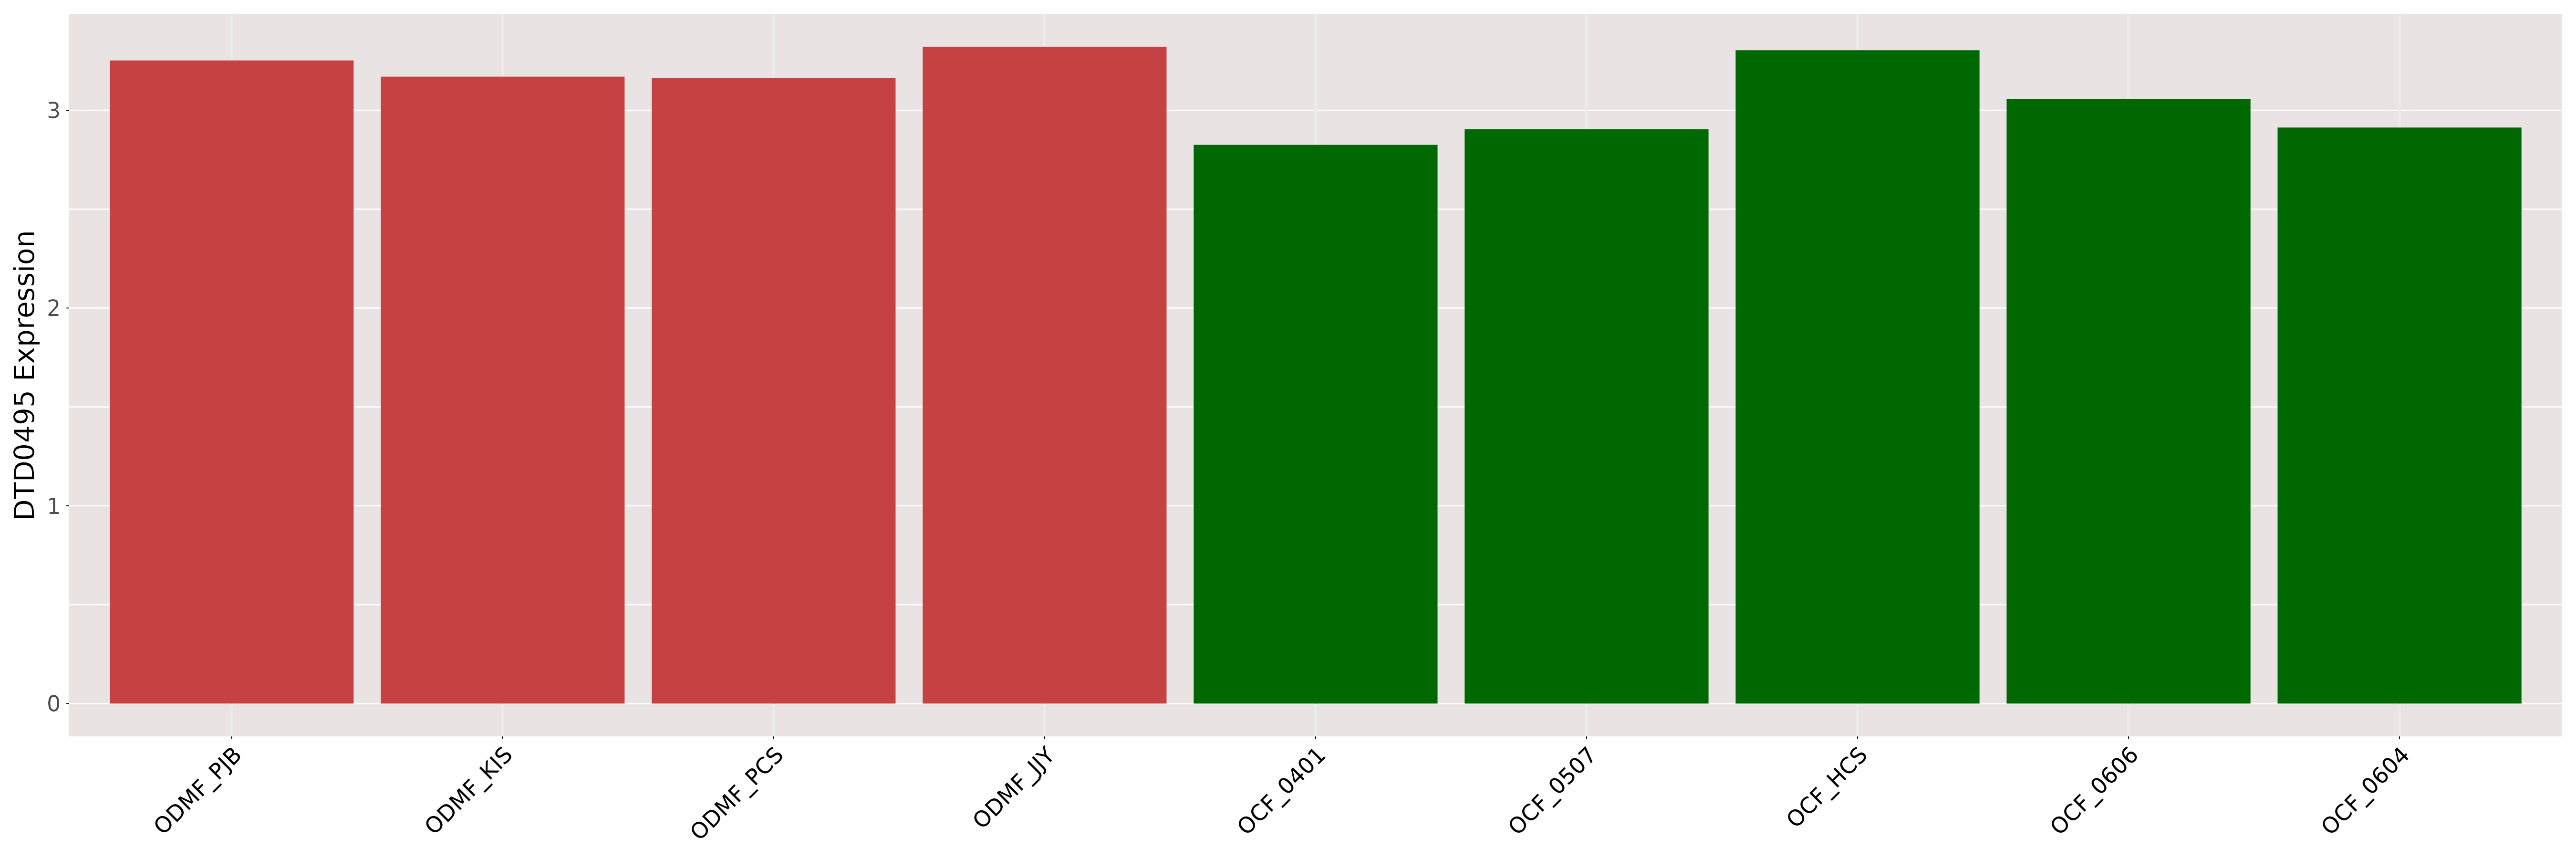
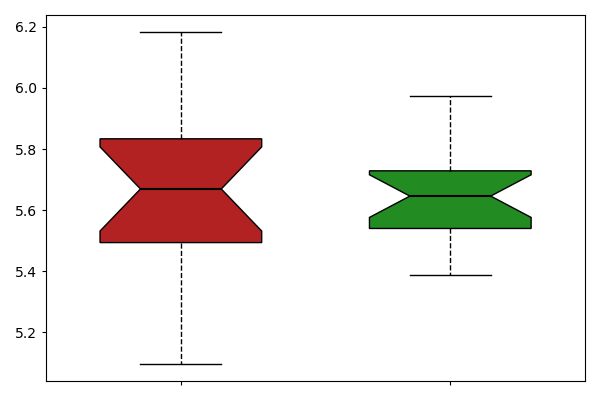
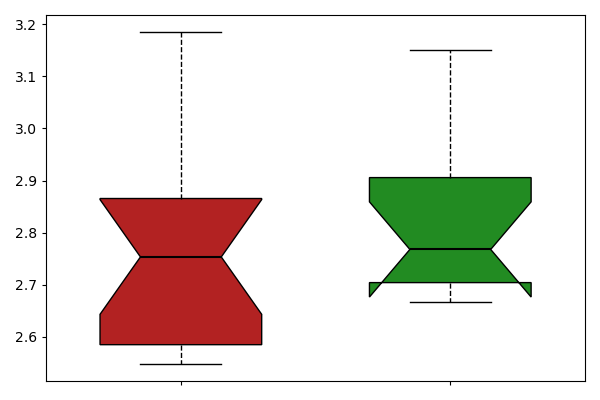
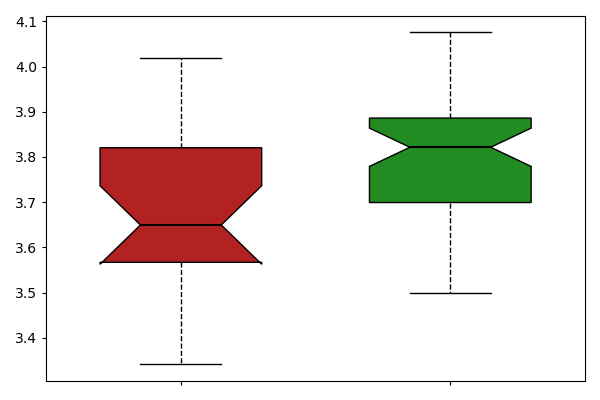
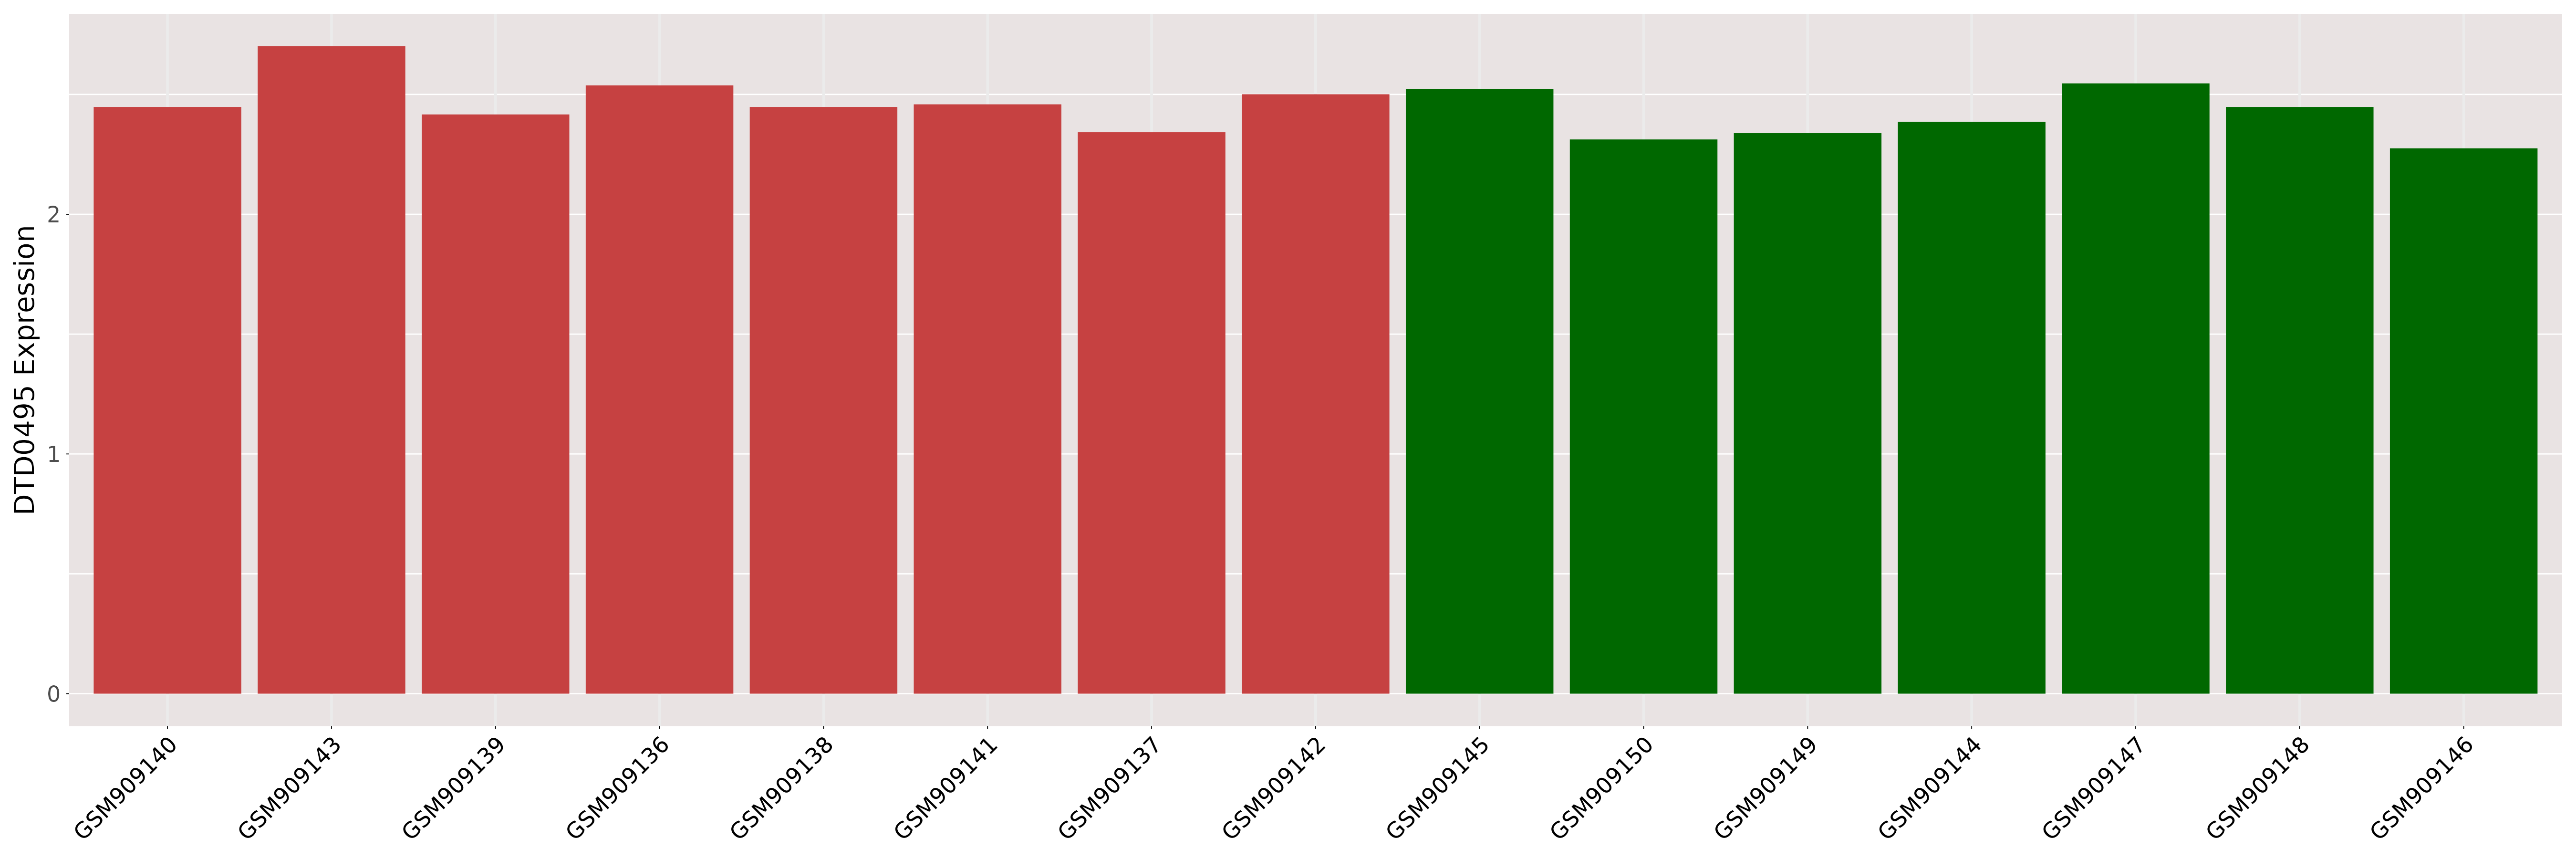
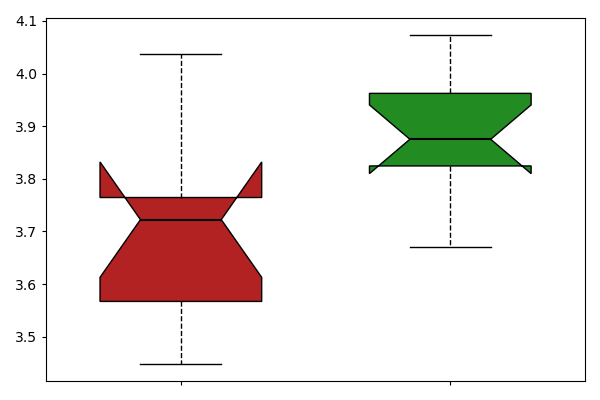
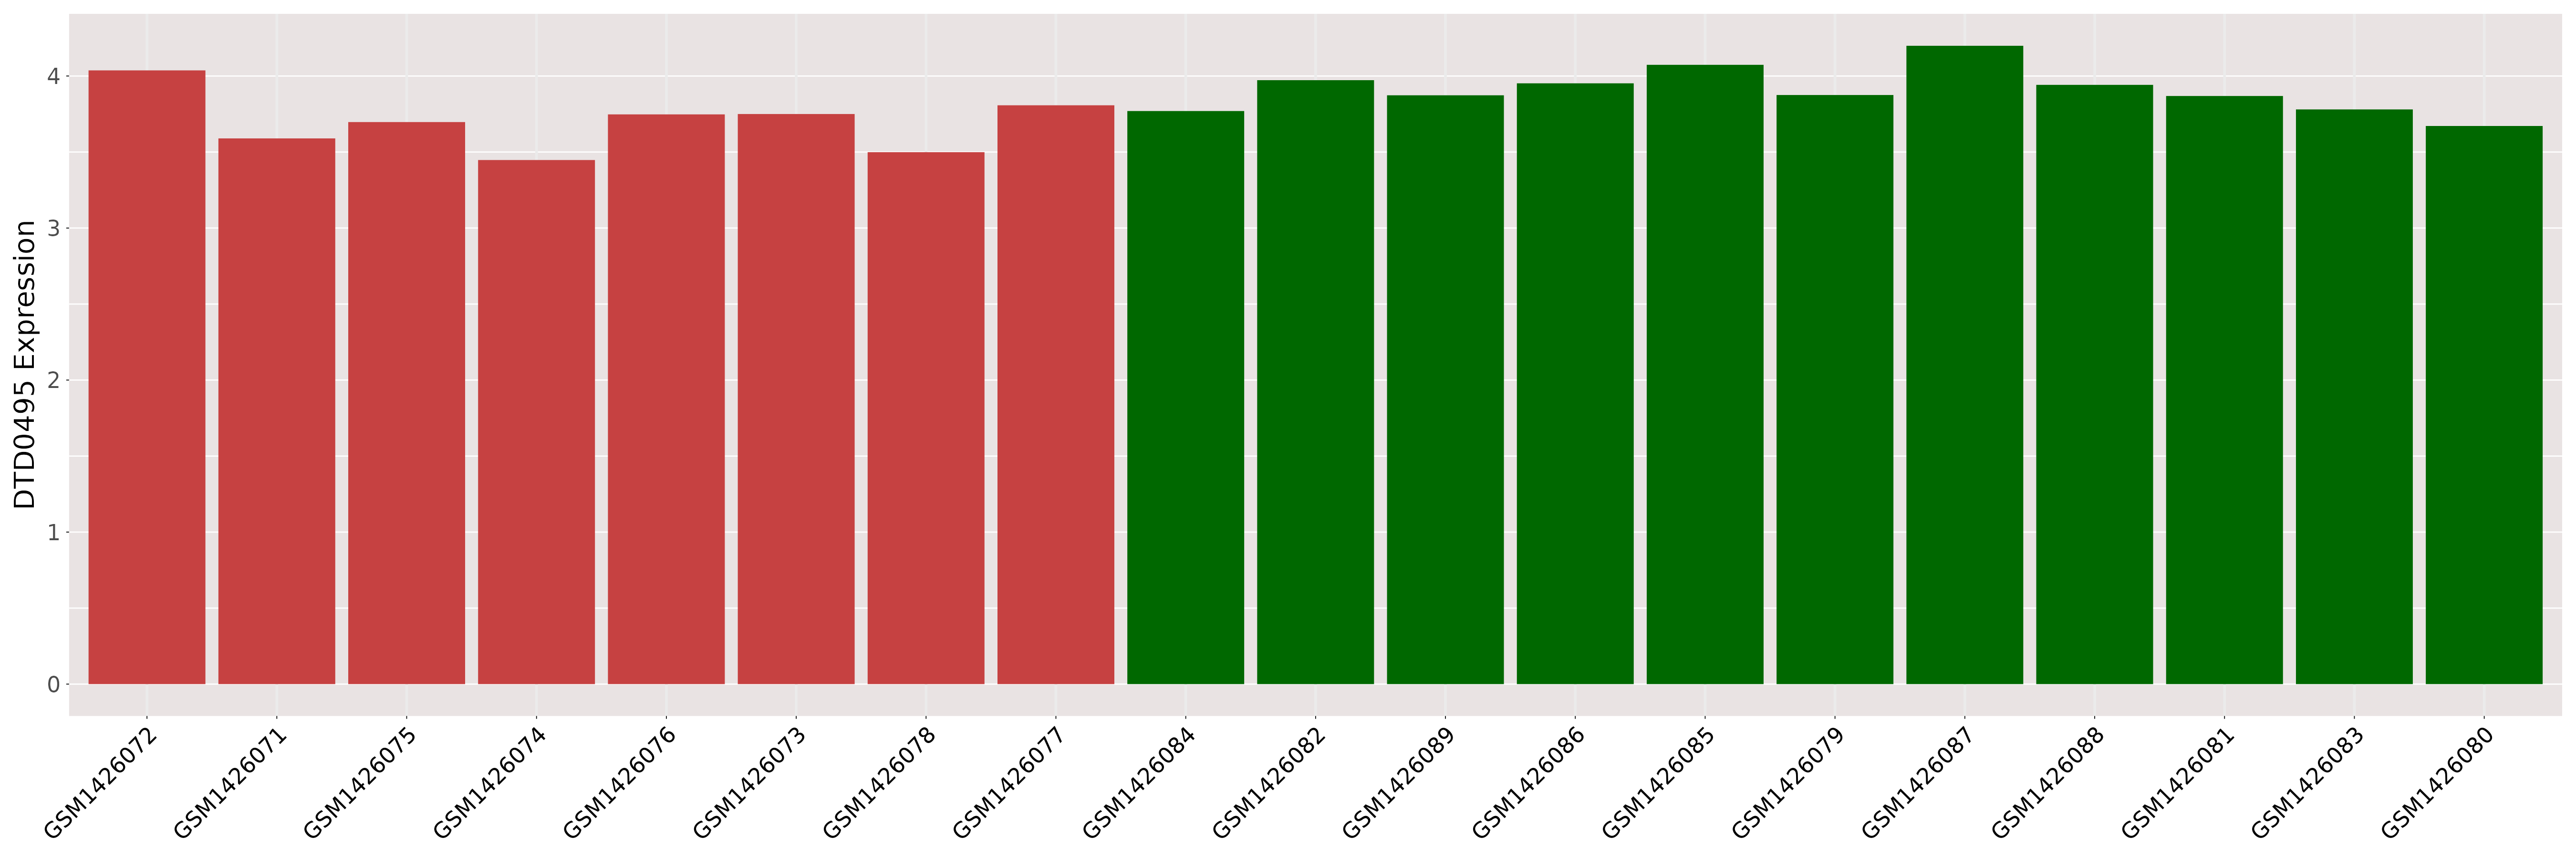
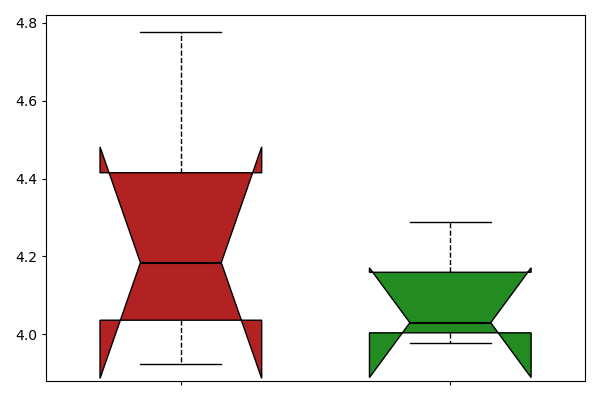
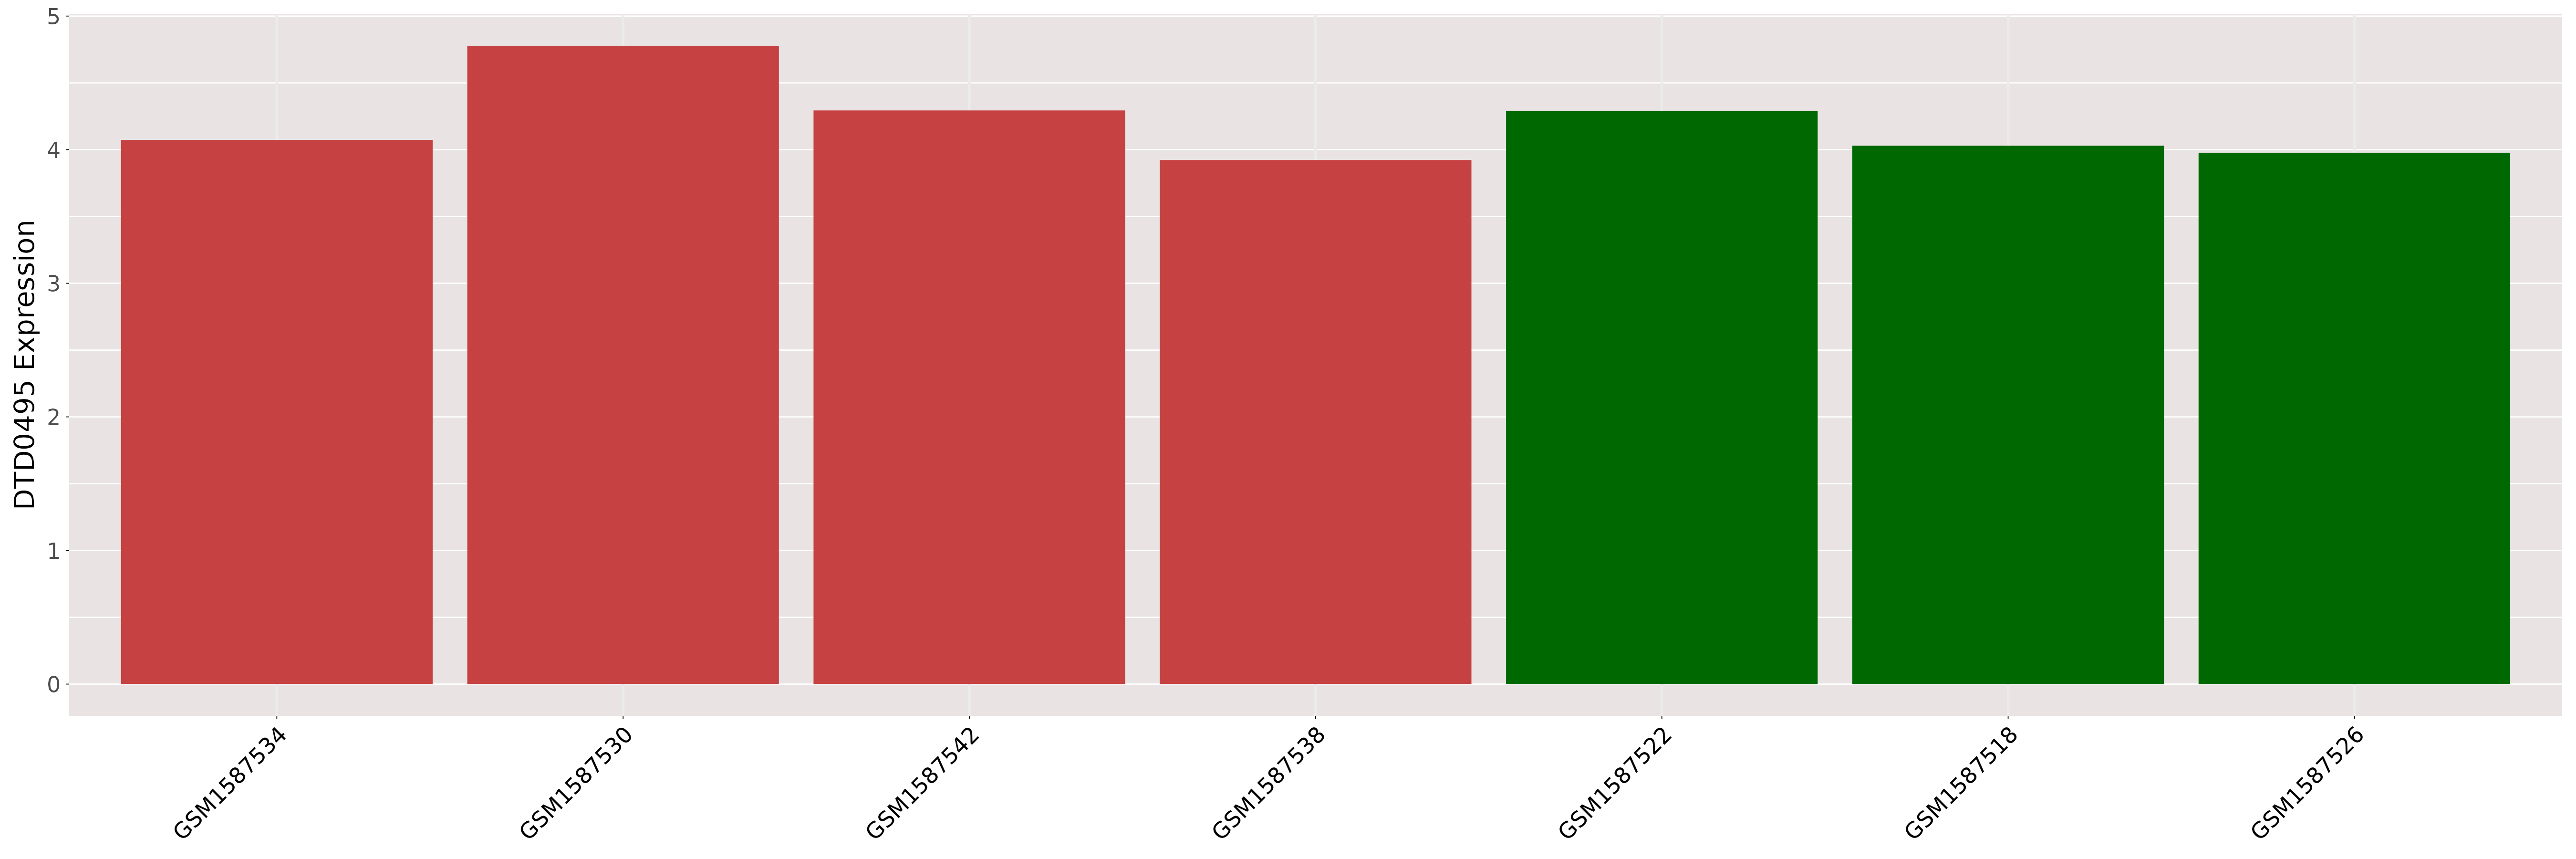
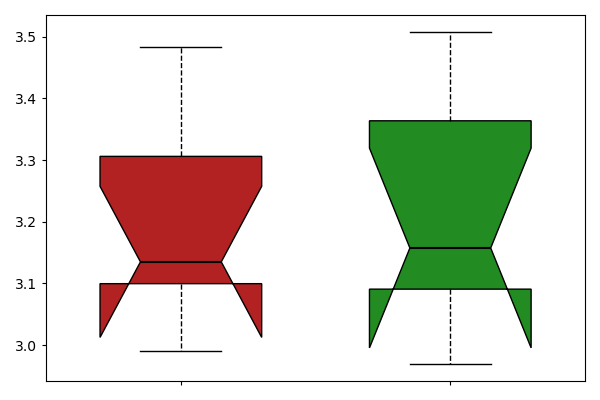
| ICD-11: 02 Neoplasm | |||||
| [+] ICD-11: 2A00.0Y Ependymoma (other specified primary brain neoplasm) | Click to Show/Hide the Full List | ||||
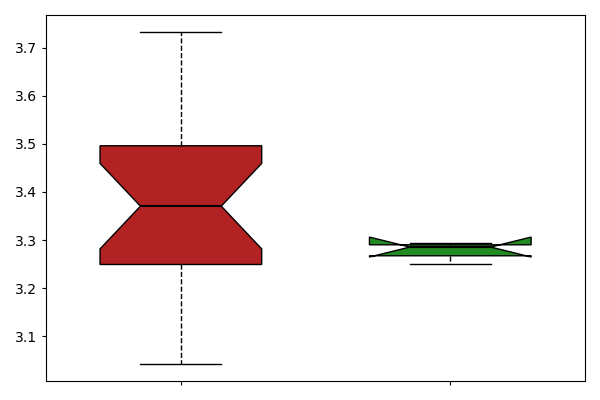
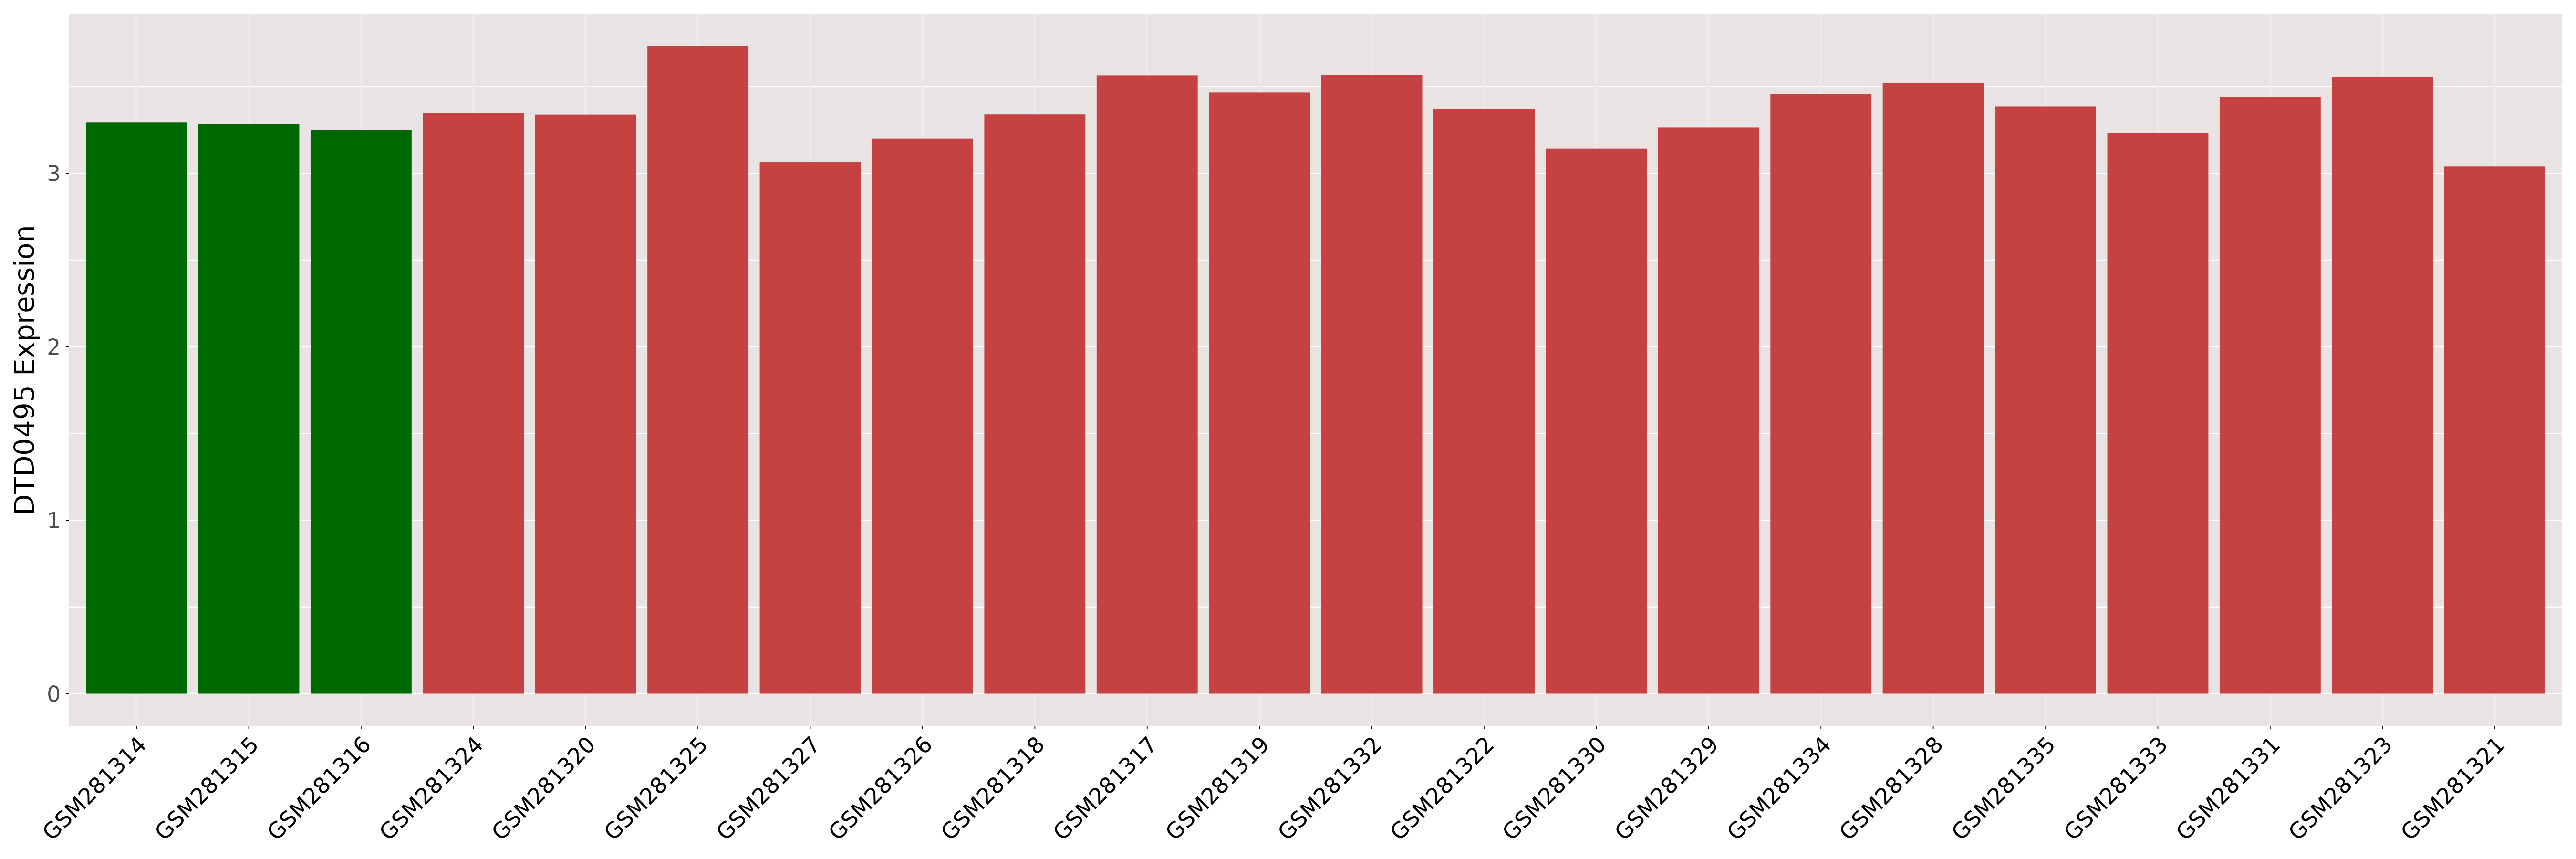
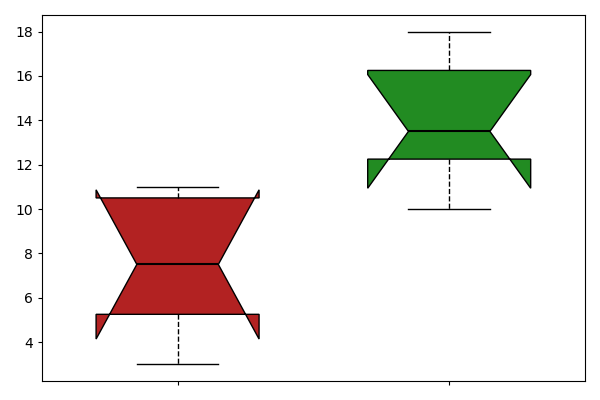
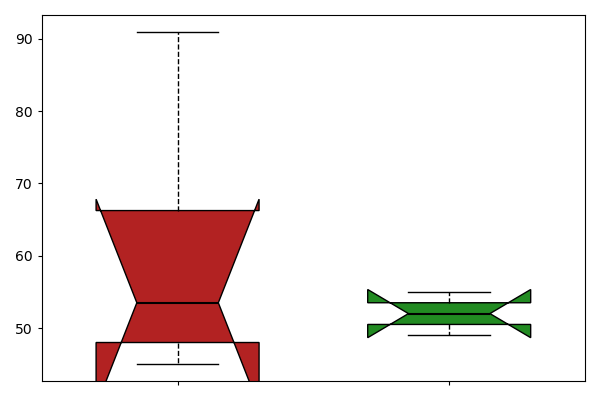
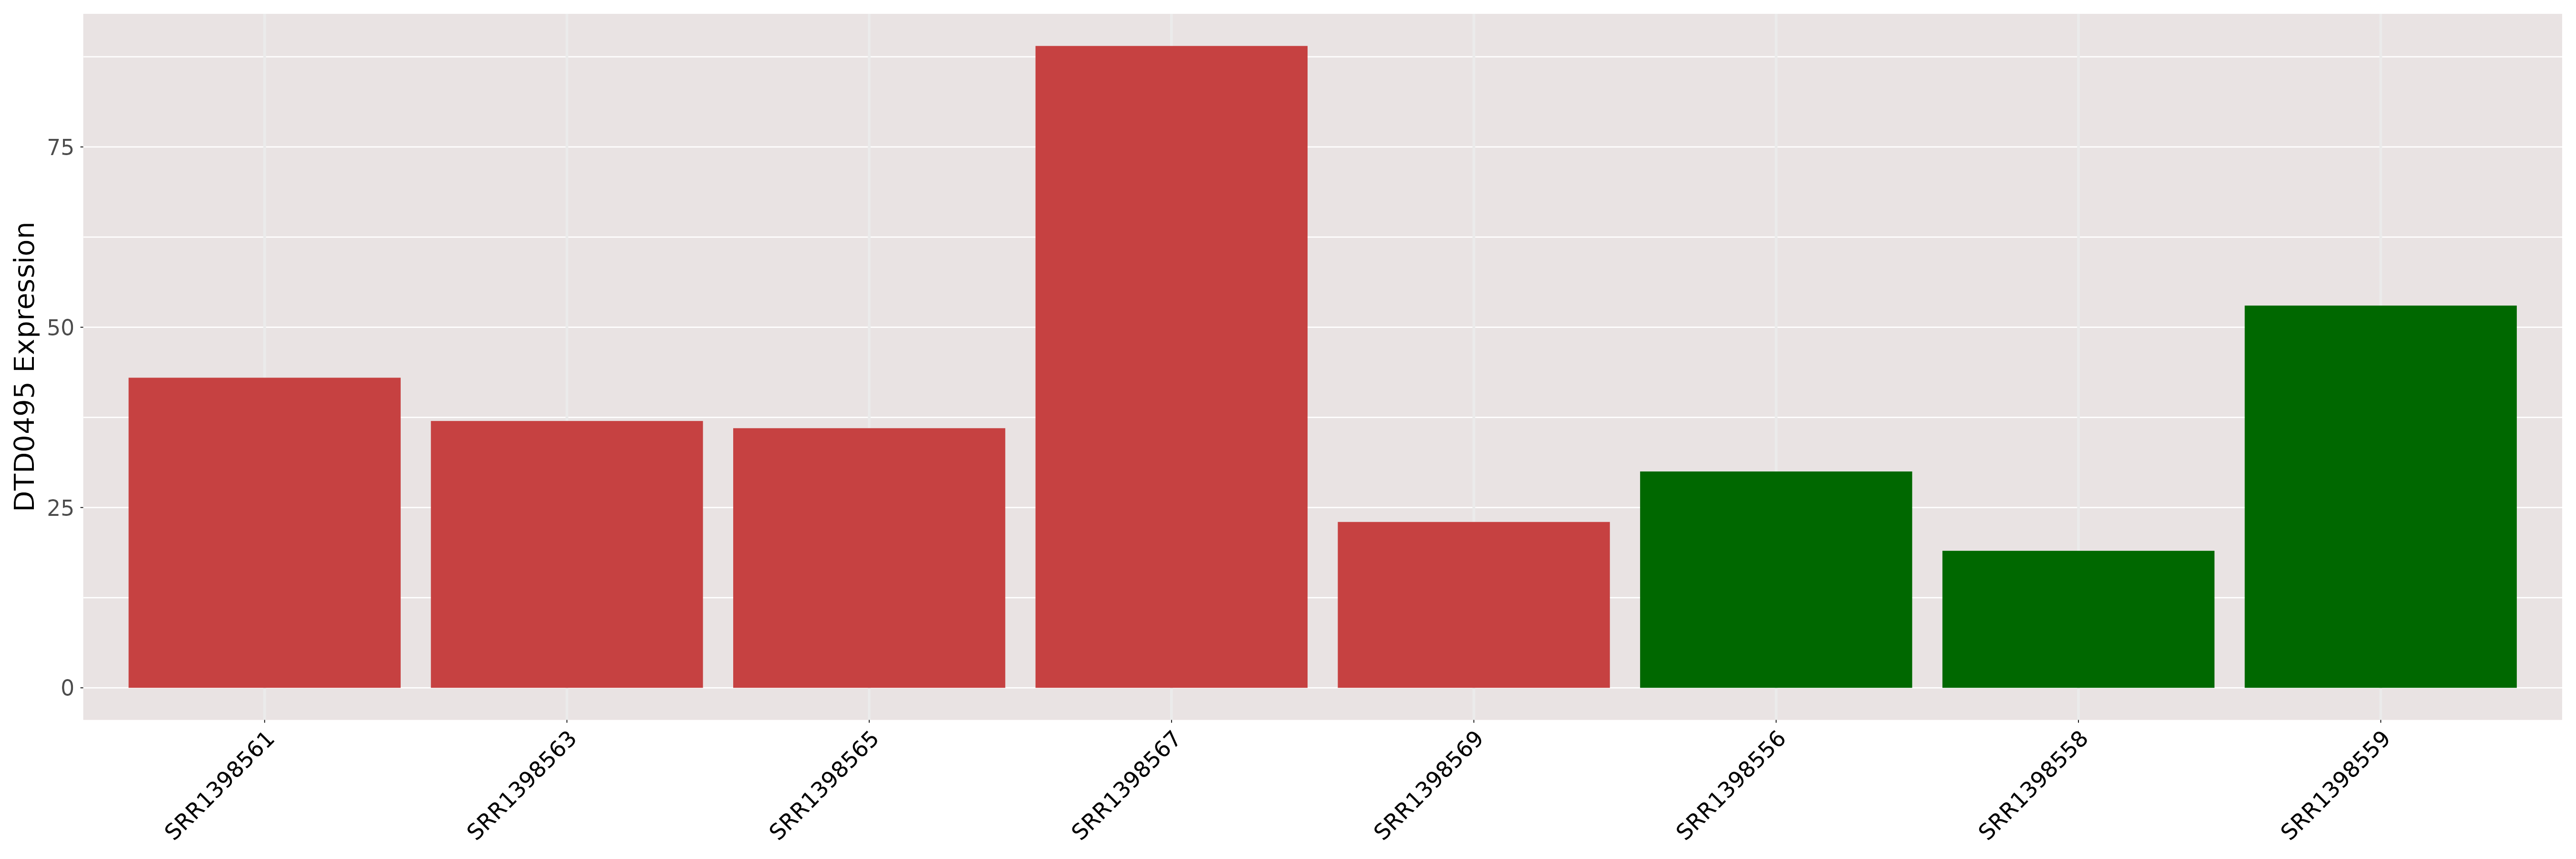
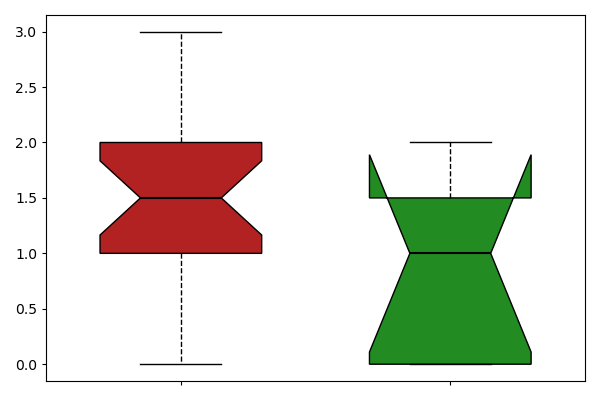
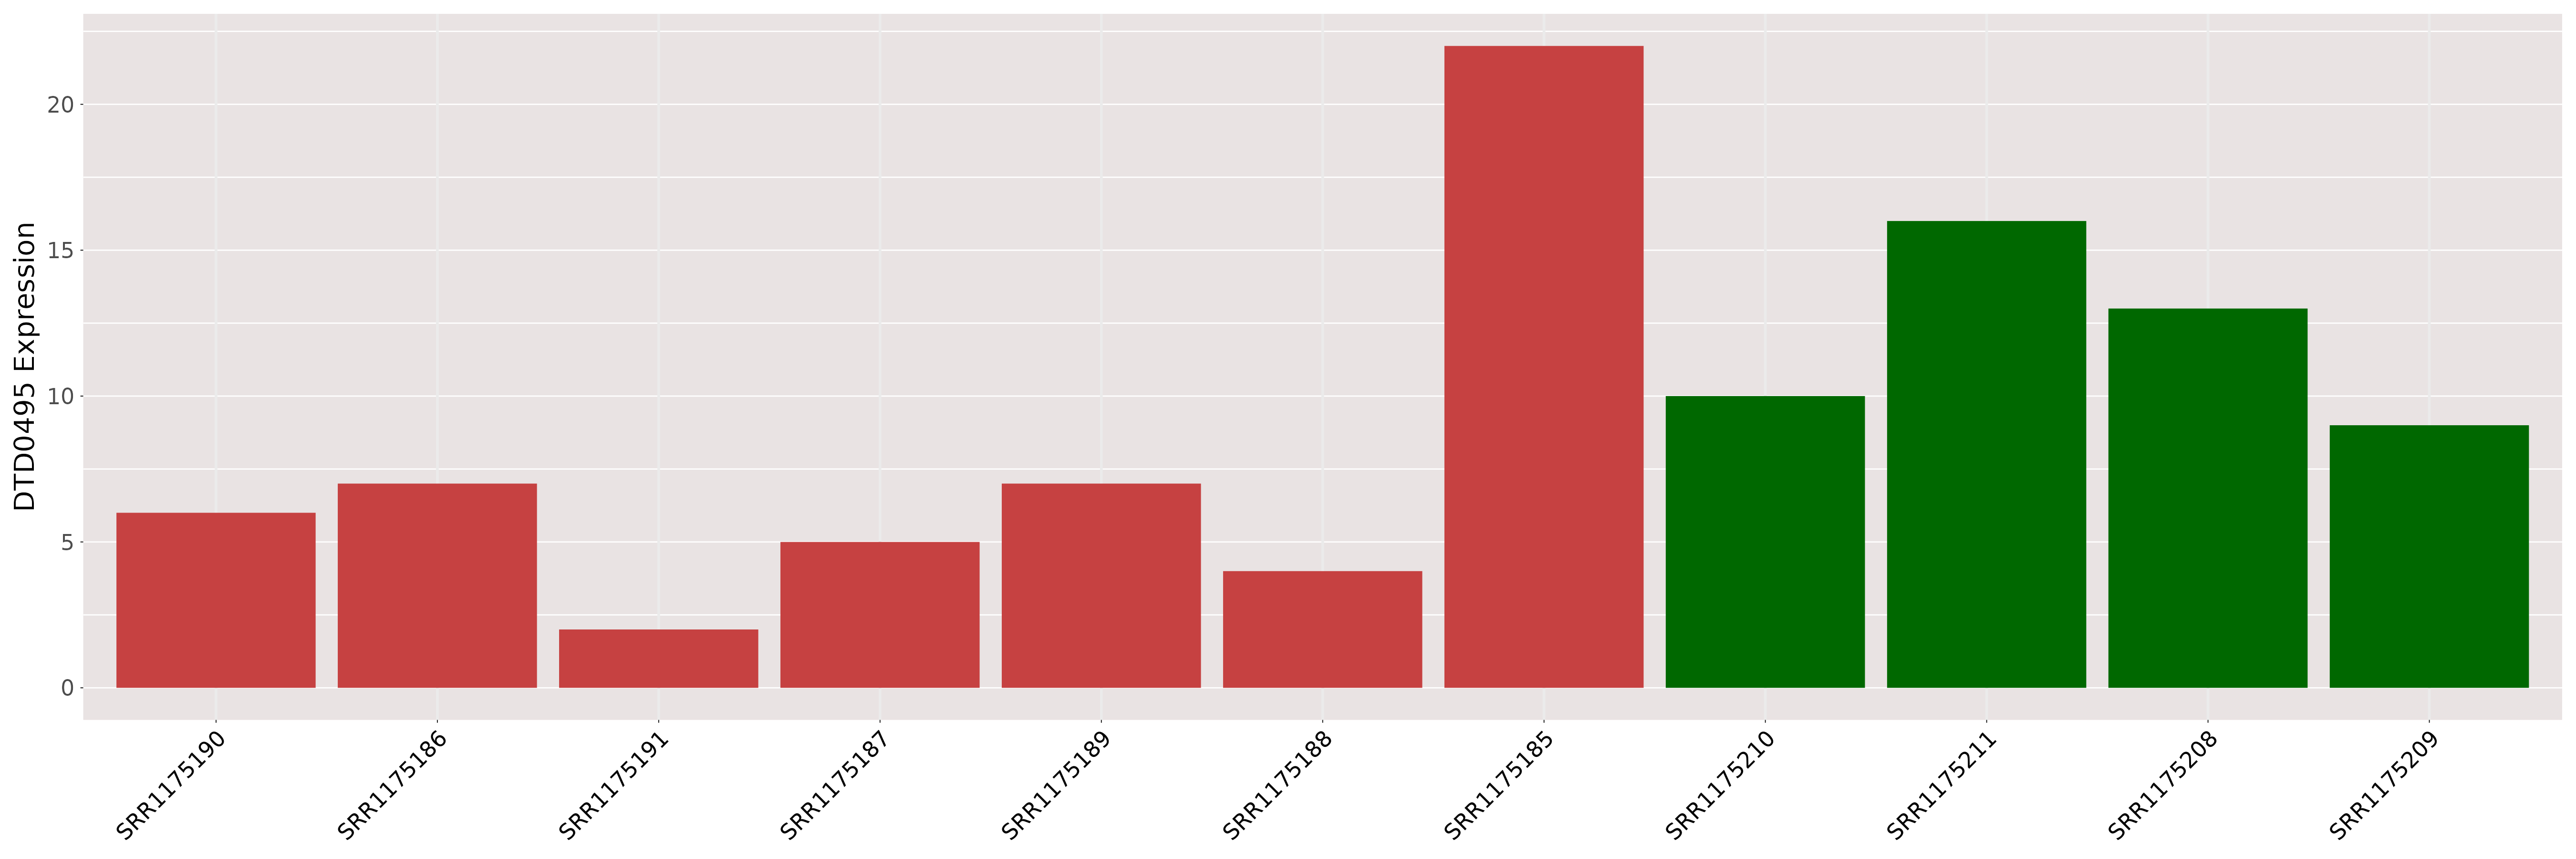
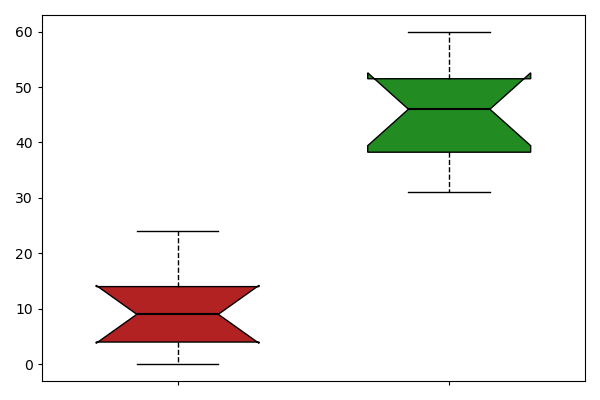
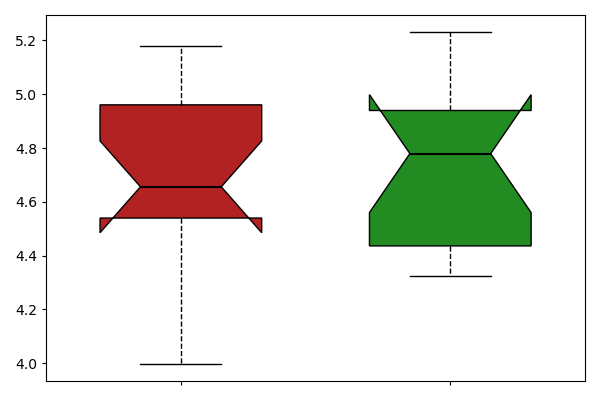
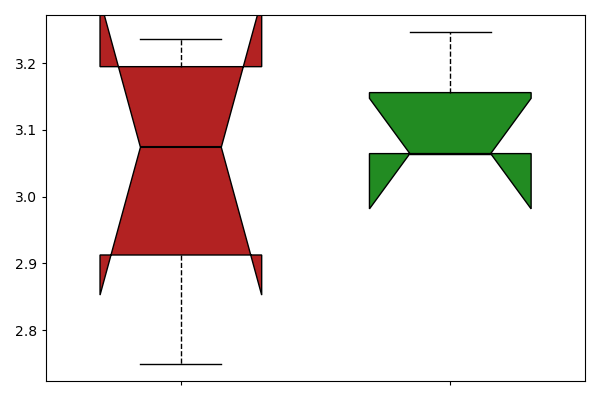
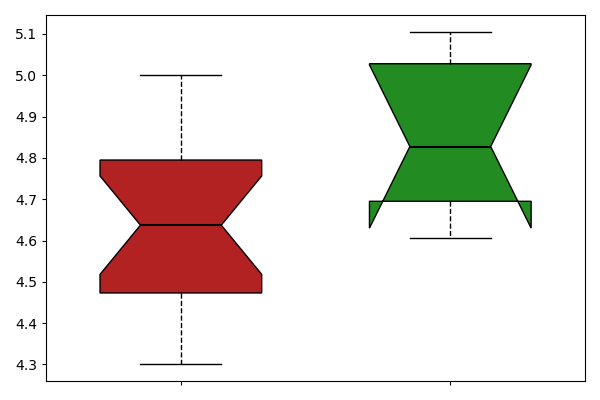
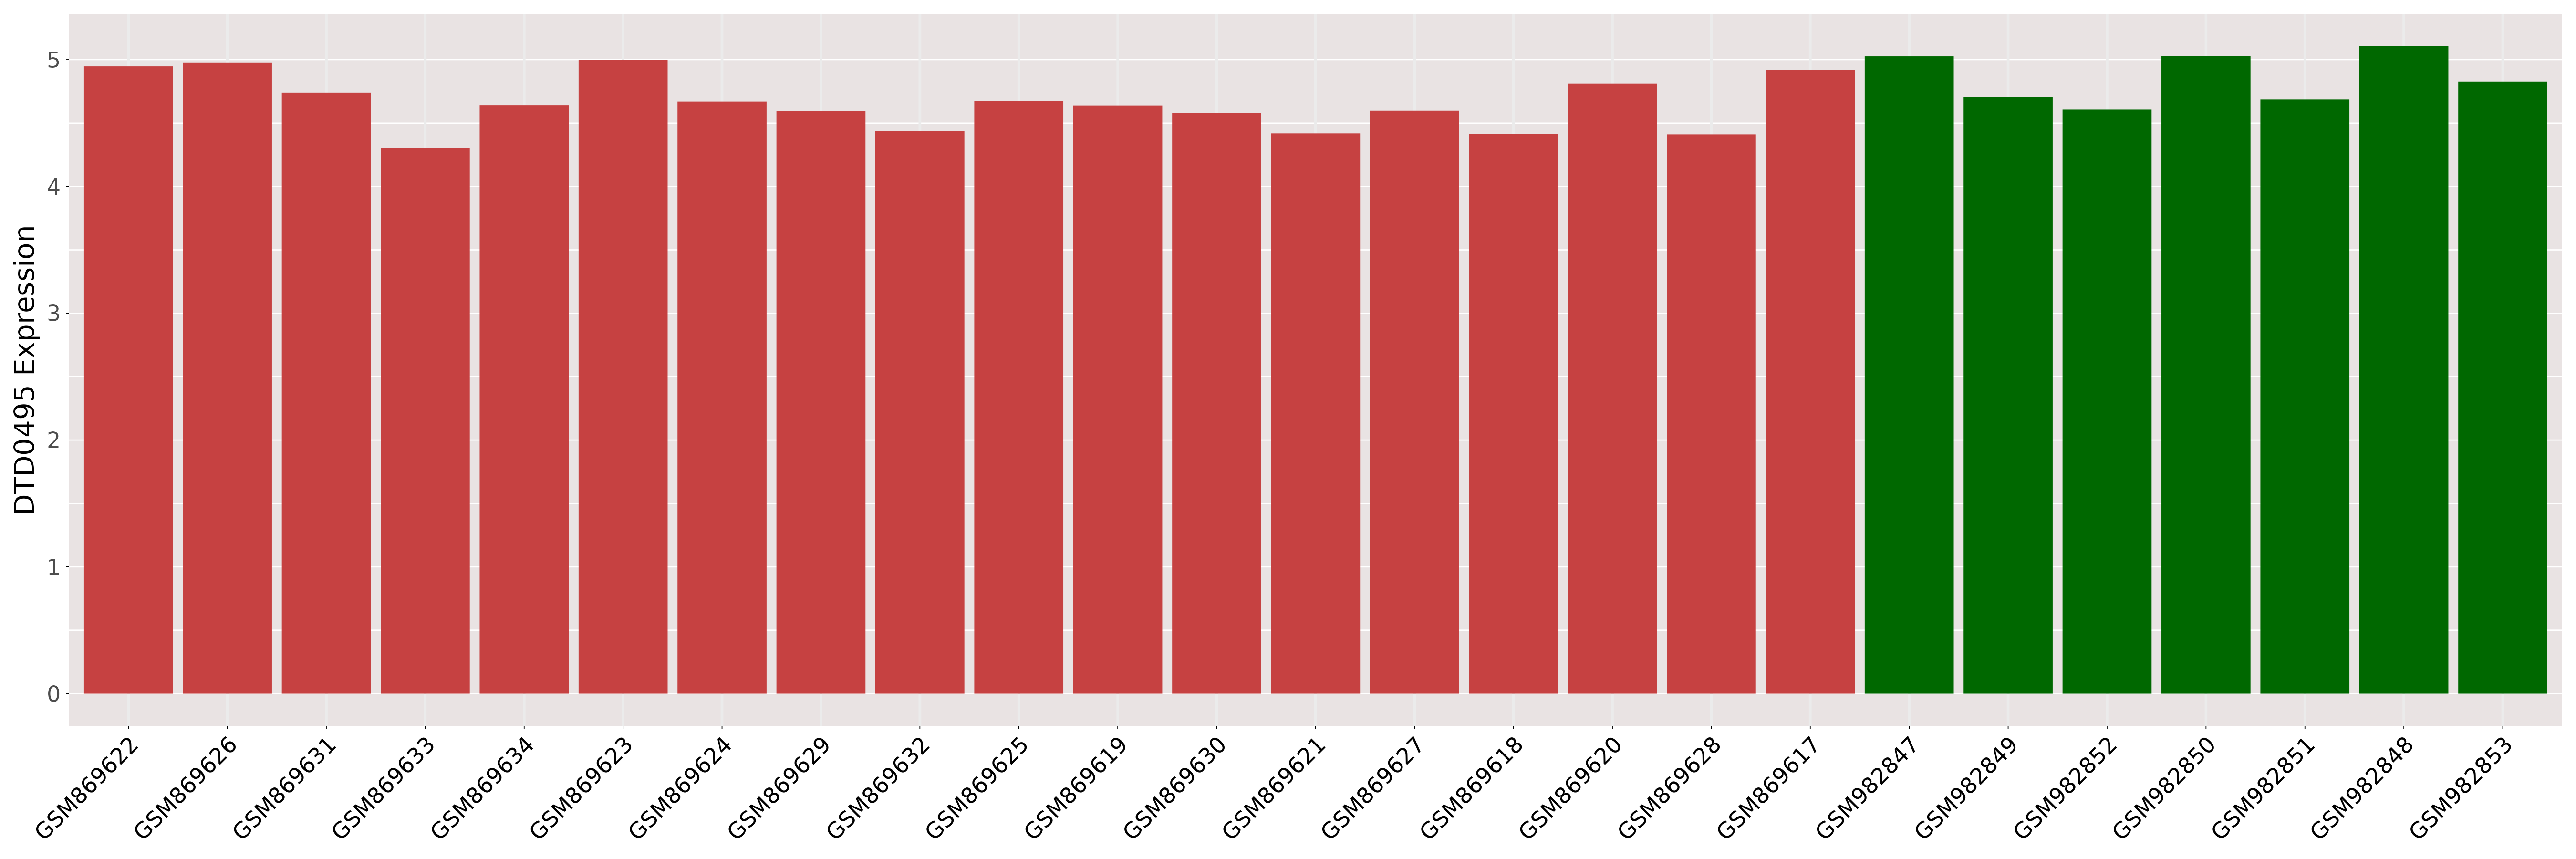
| The Studied Tissue | Brain | ||||
| The Specified Disease | Ependymoma [ICD-11:2A00.0Y] | ||||
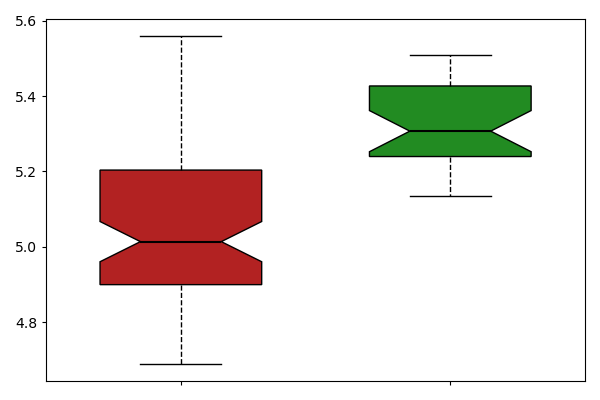
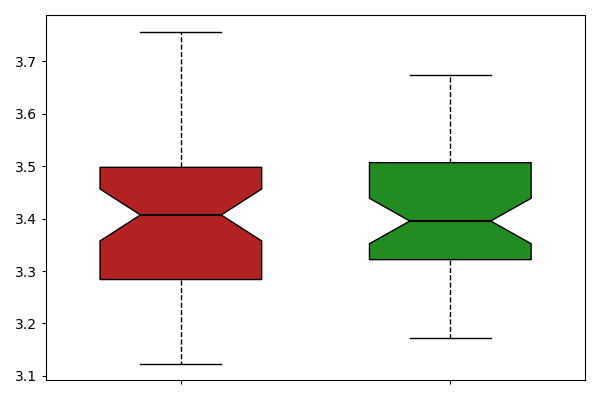
| The Expression Level of Disease Section Compare with the Healthy Individual Tissue | p-value:0.6147910248042607; Fold-change:0.9811685248107213; Z-score:0.1712332741374433 | ||||
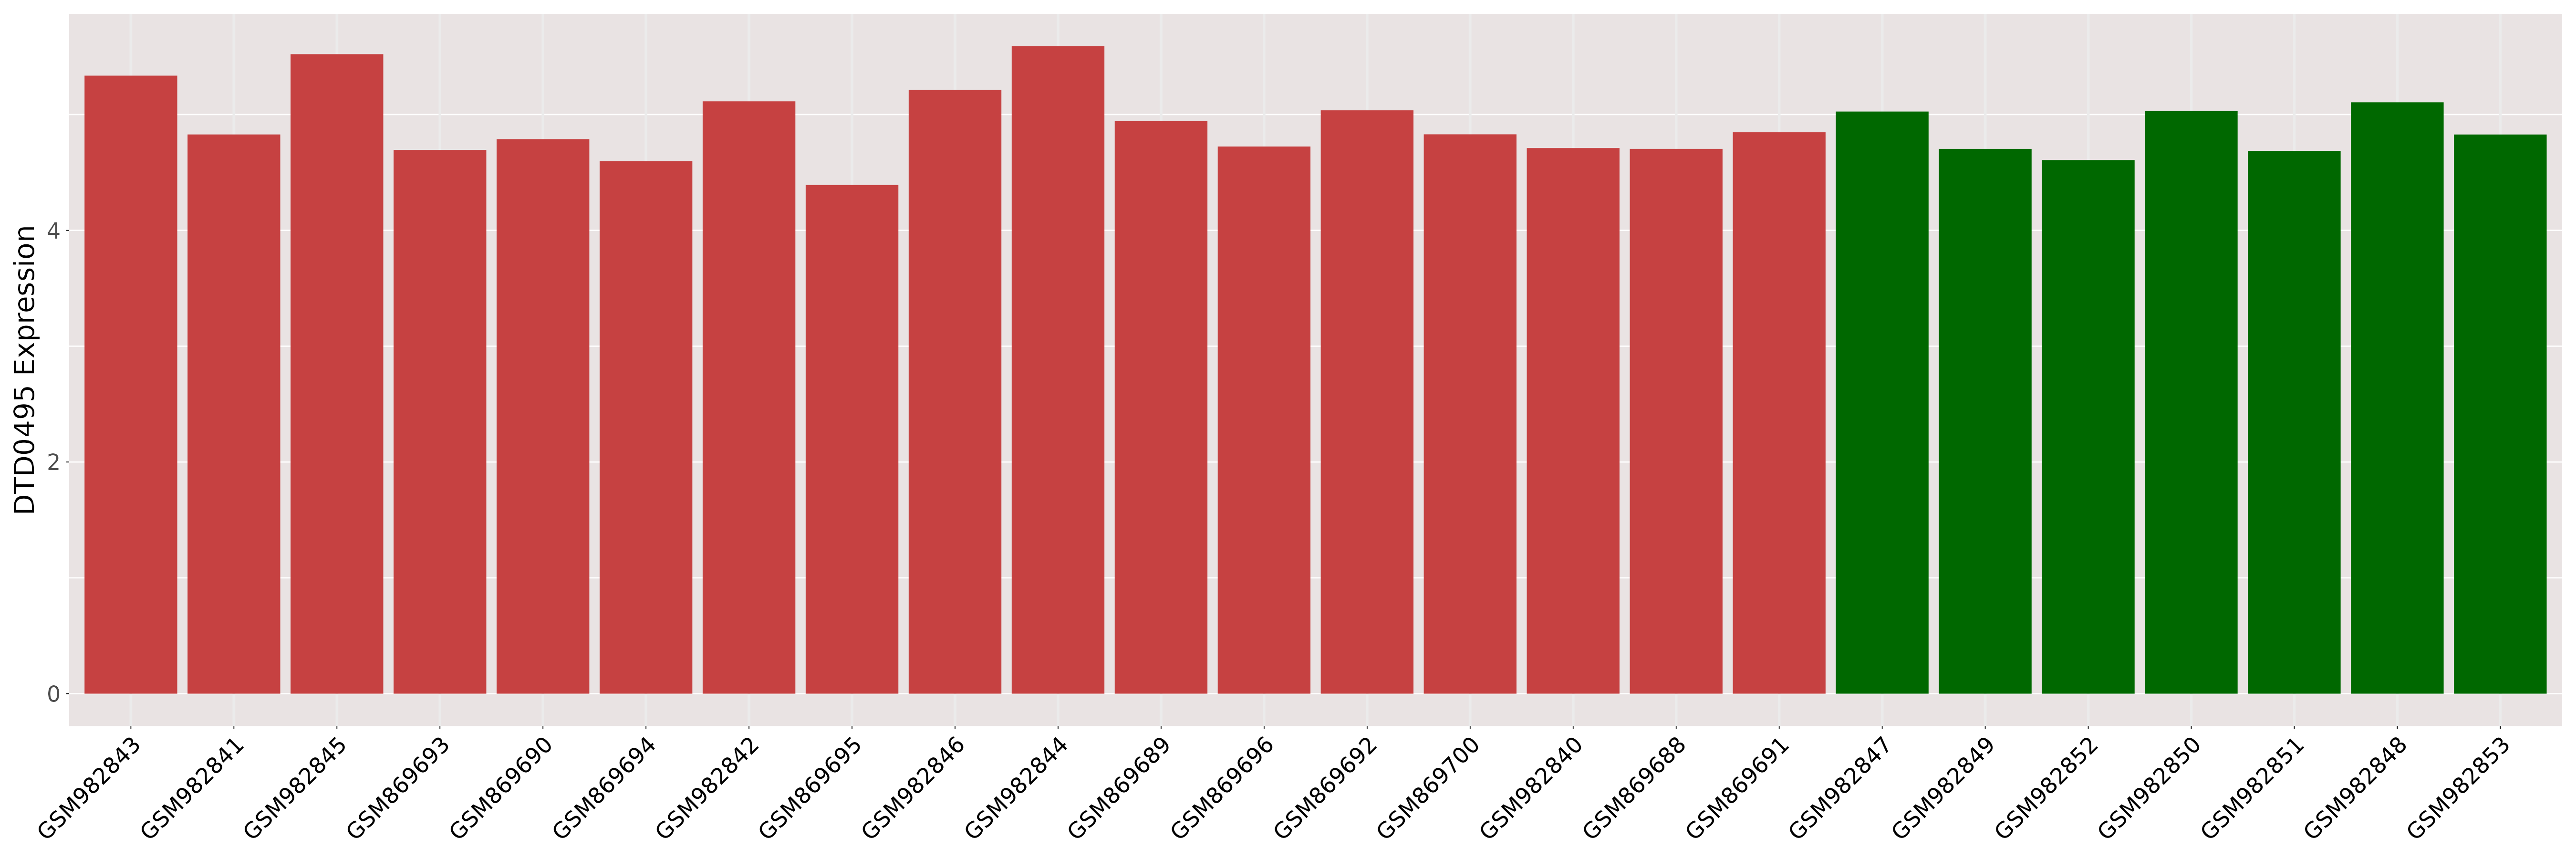
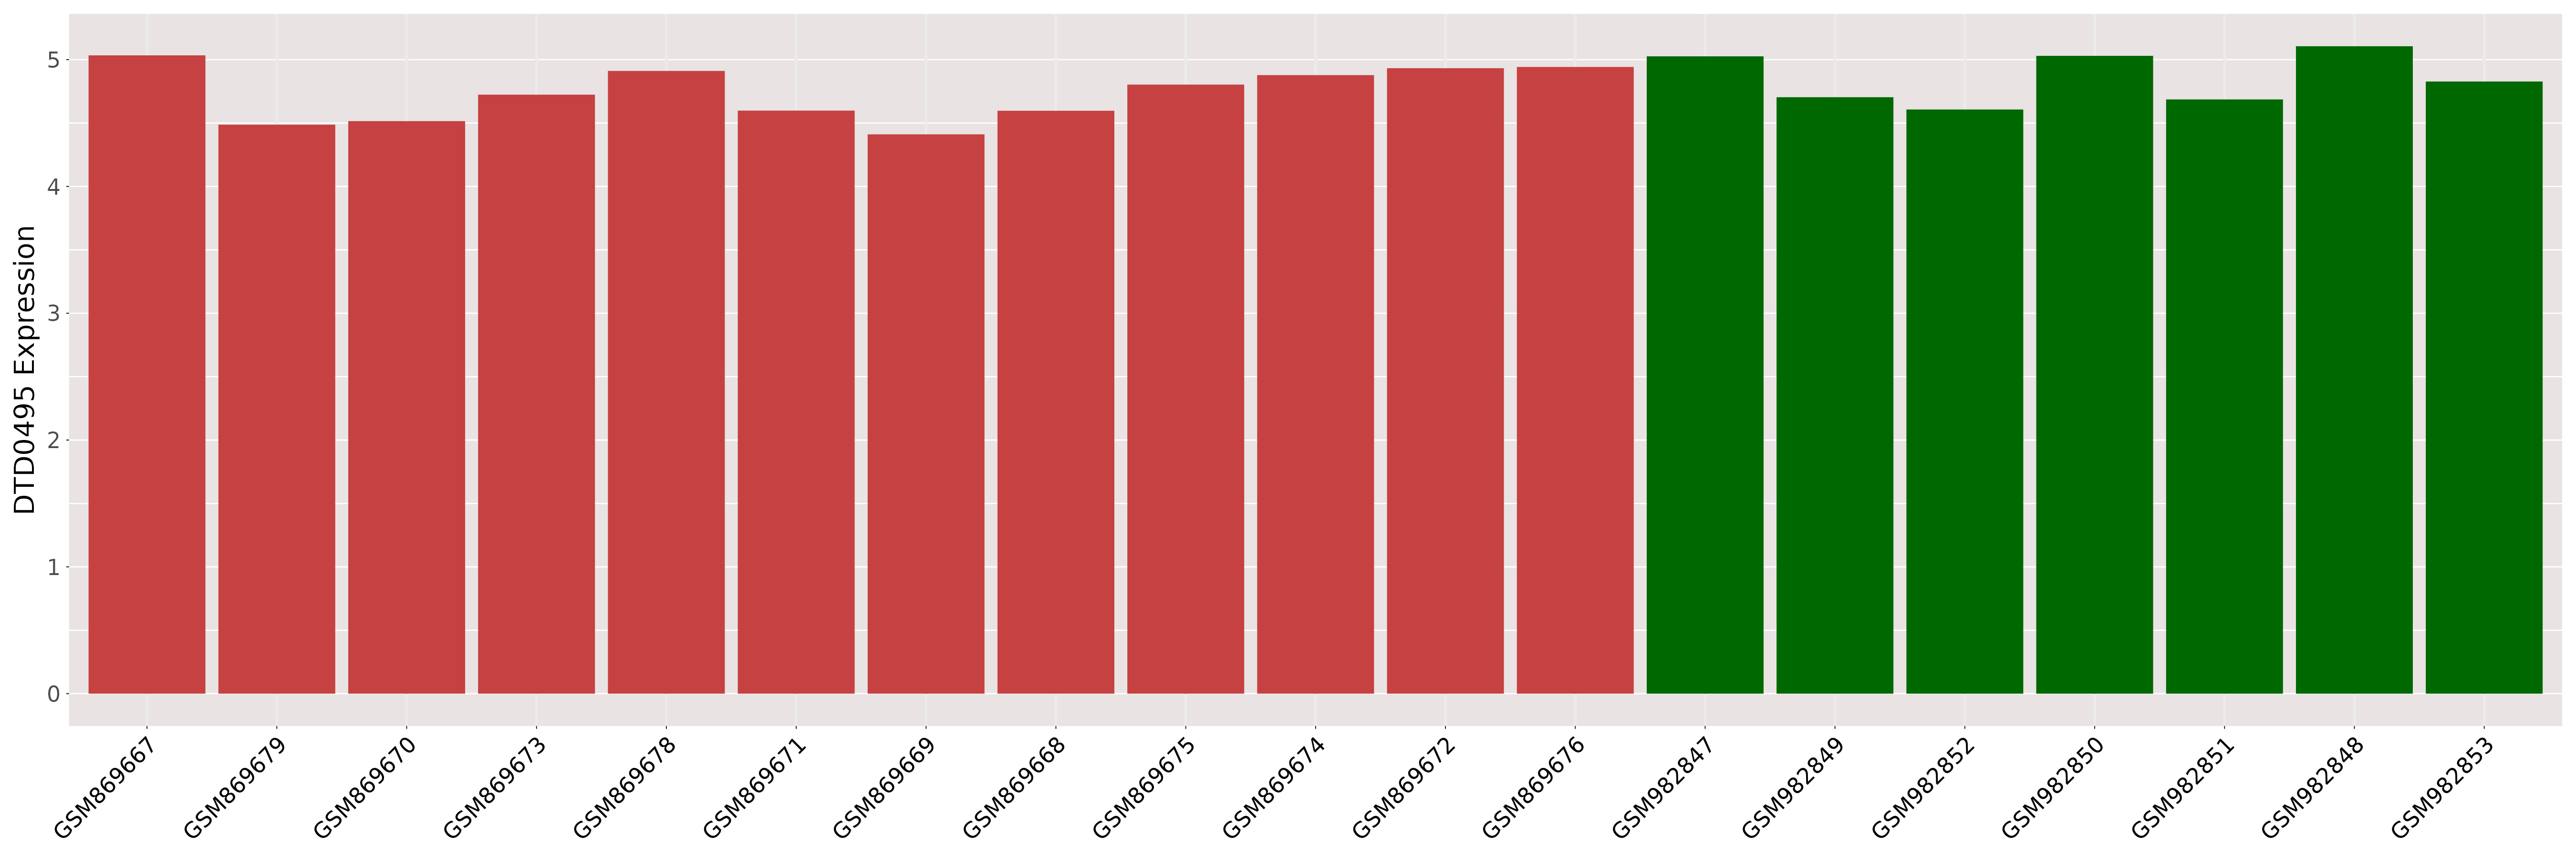
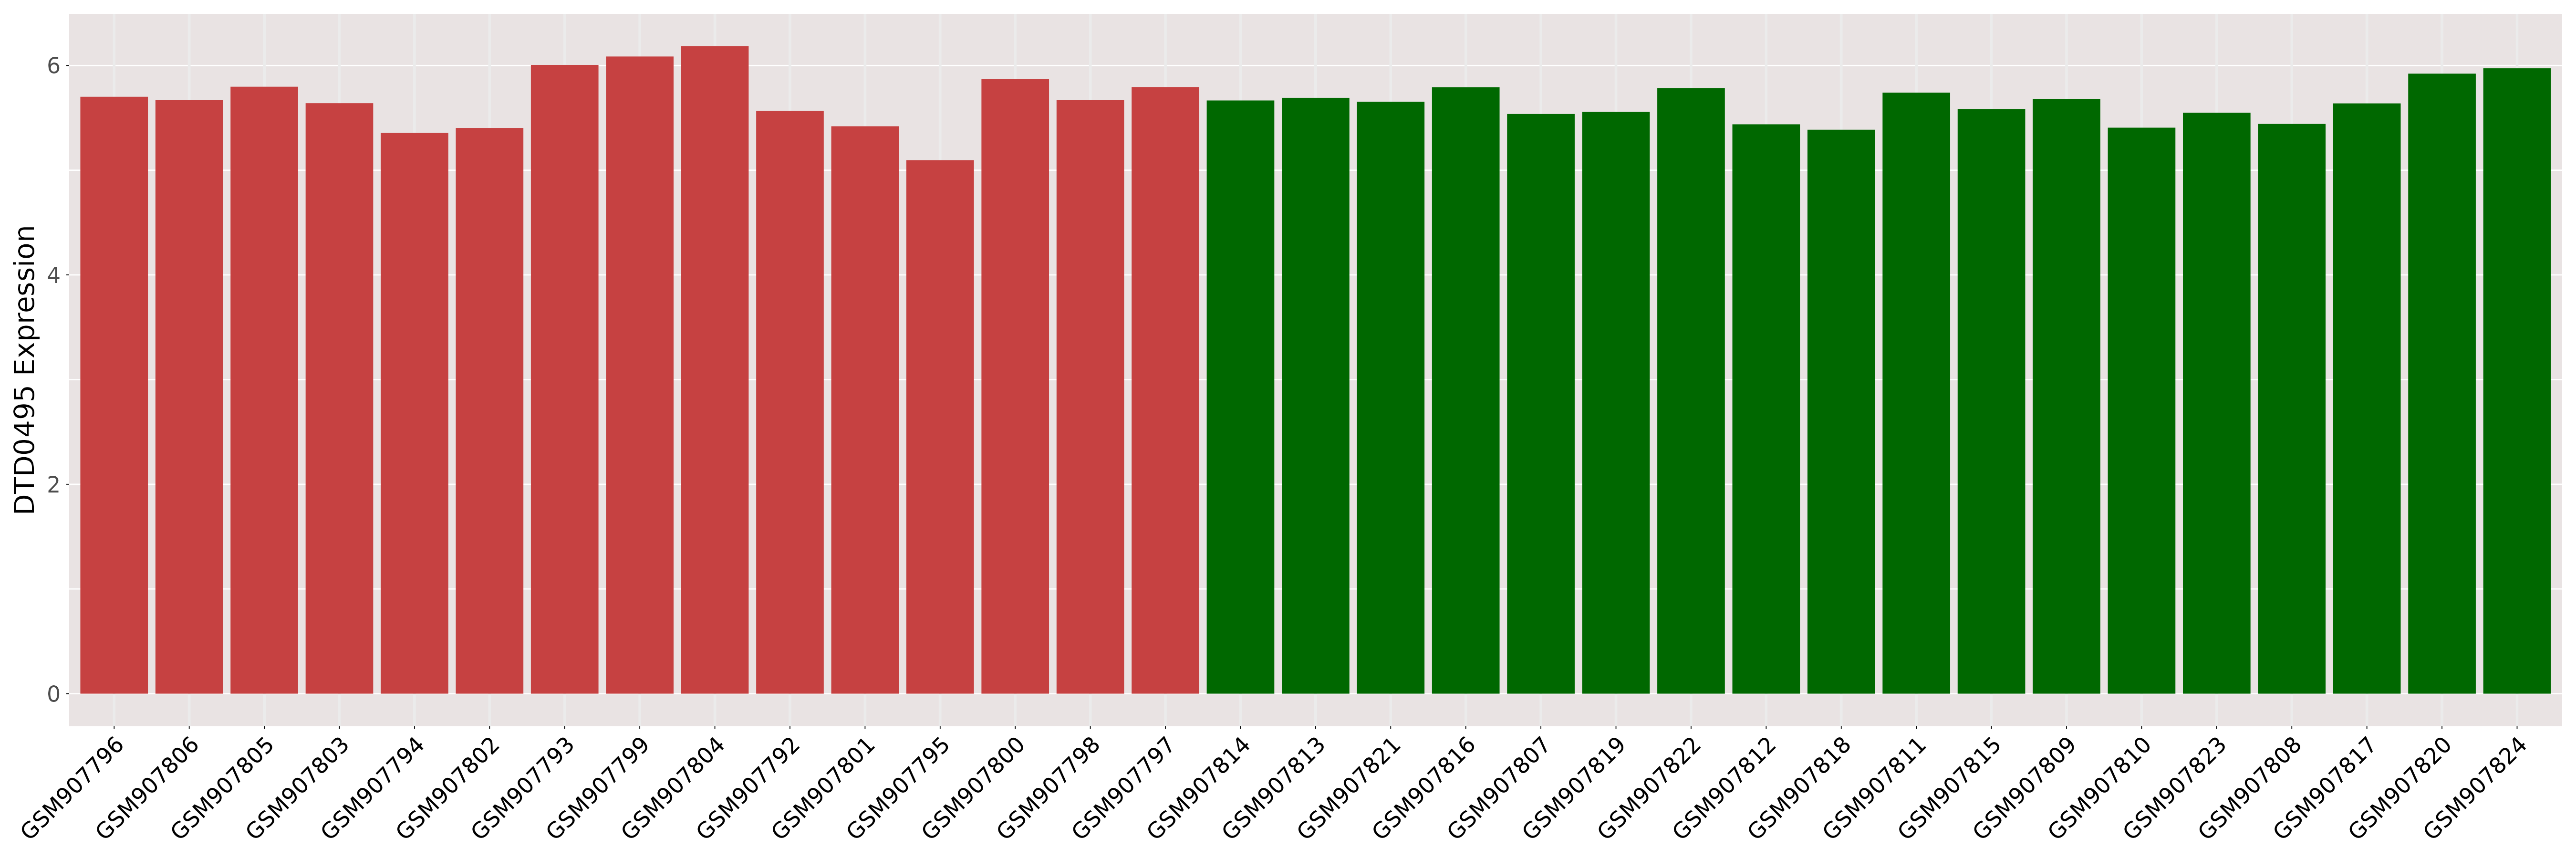
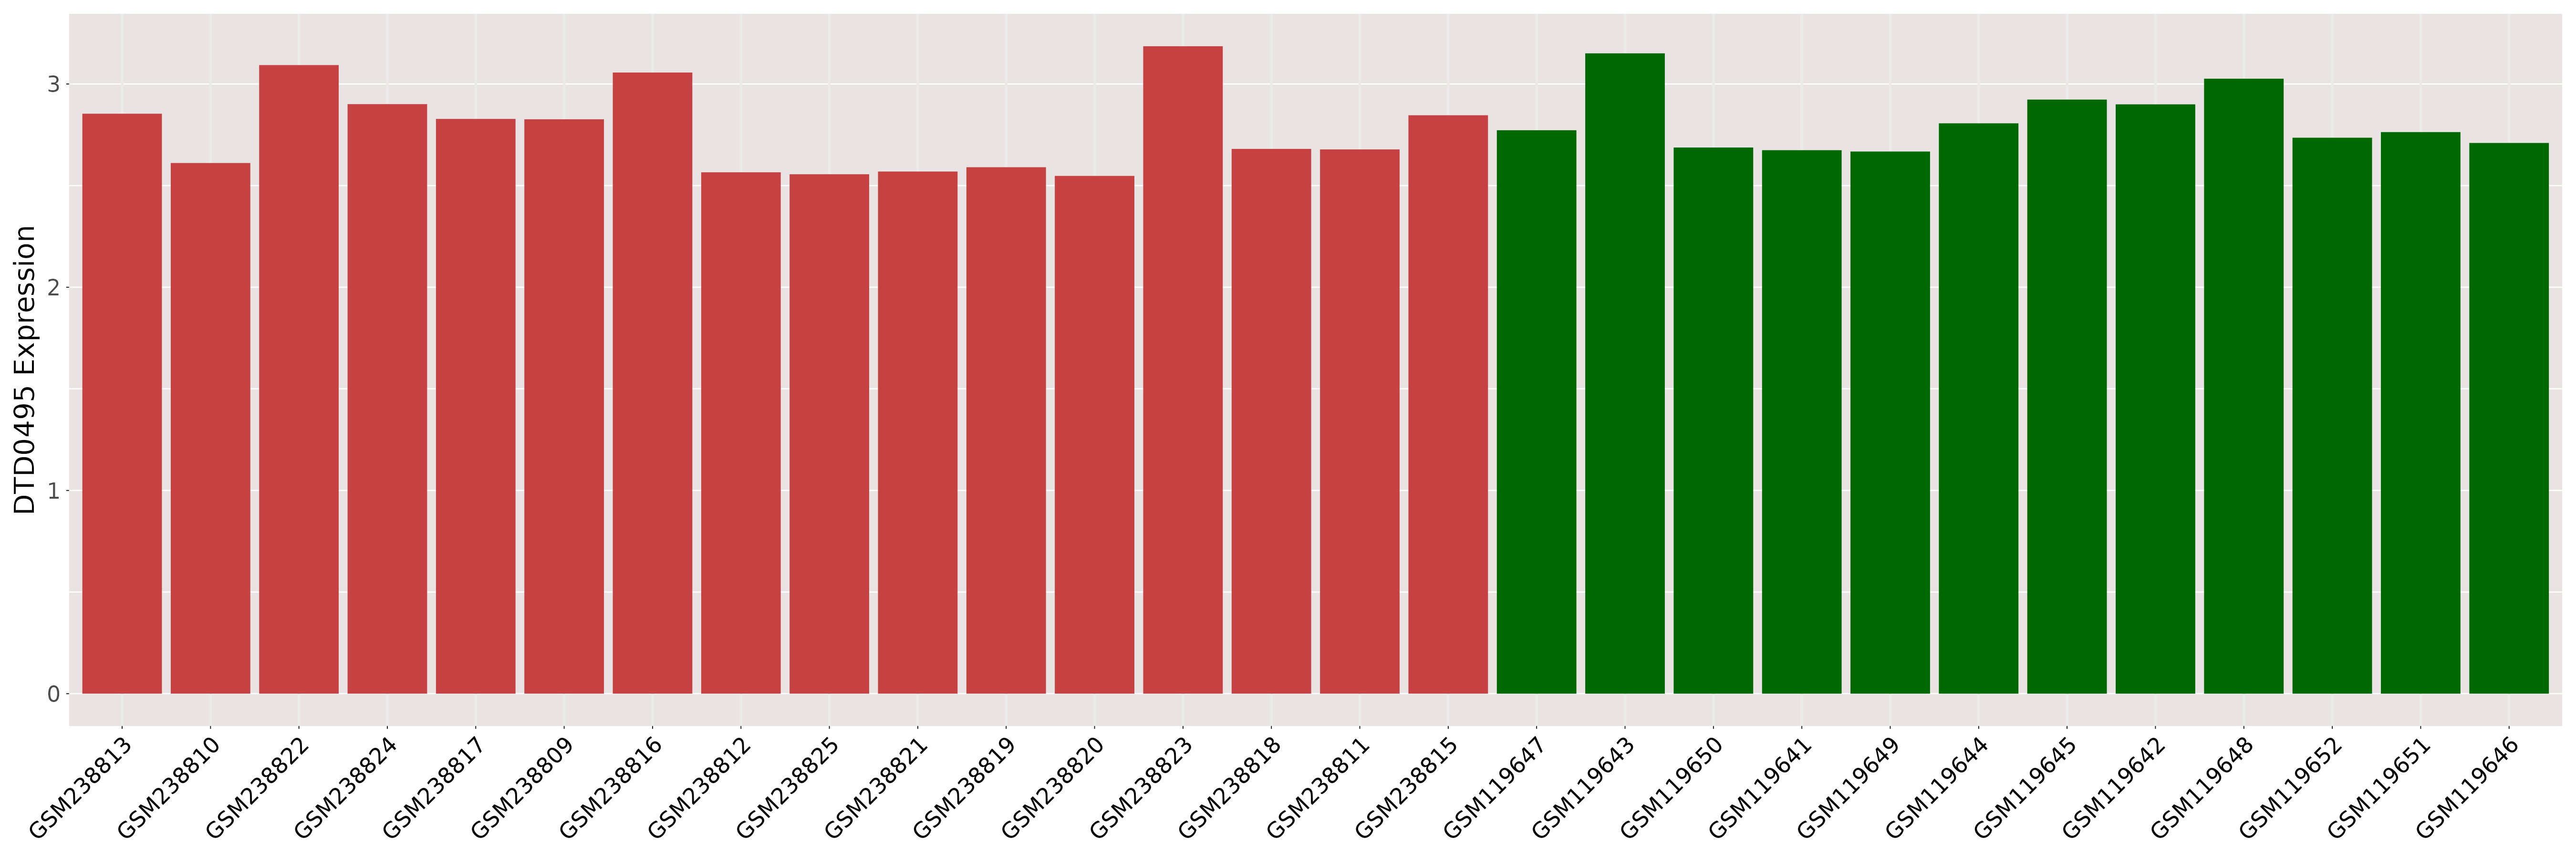
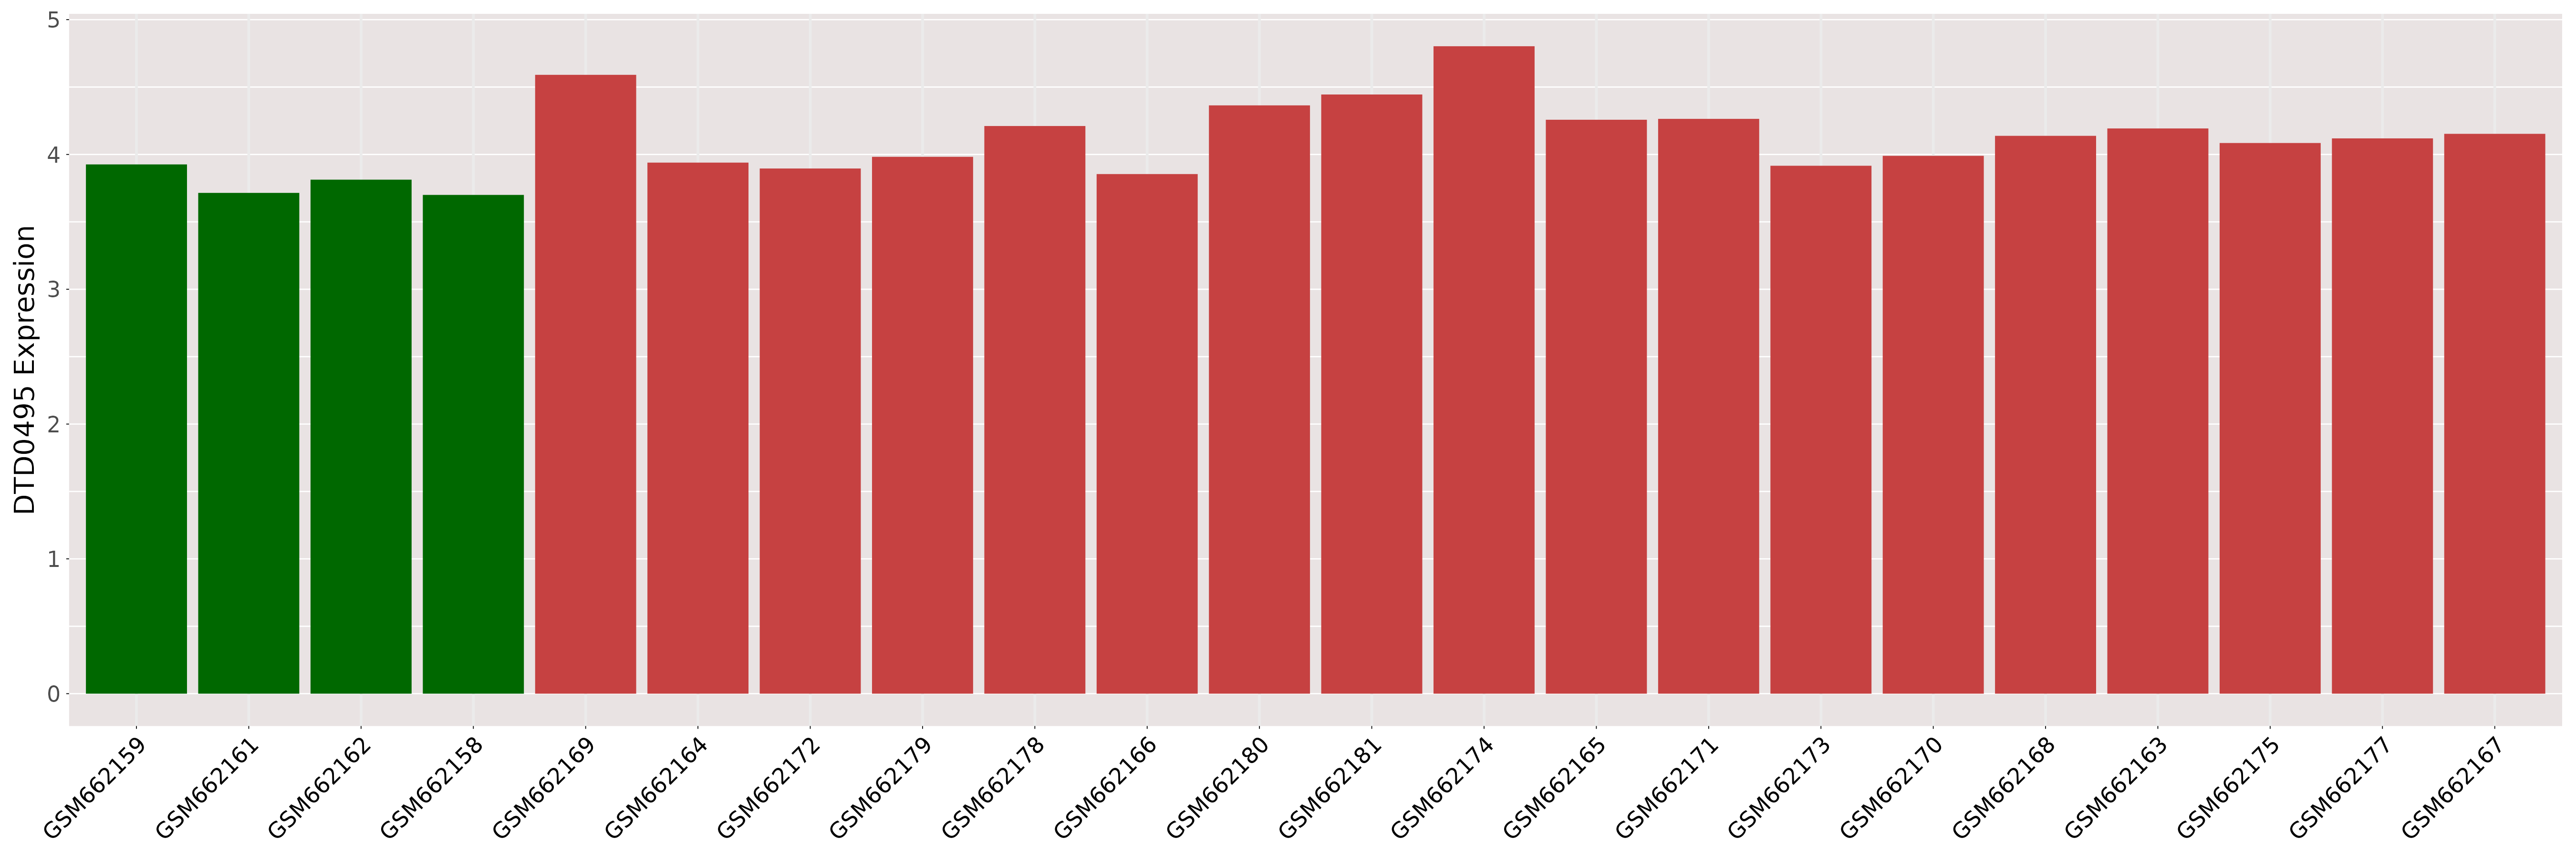
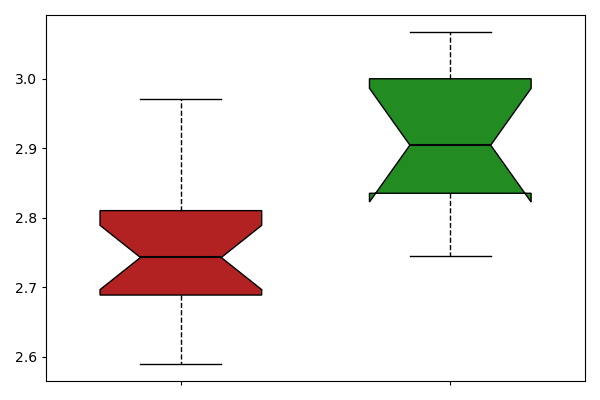
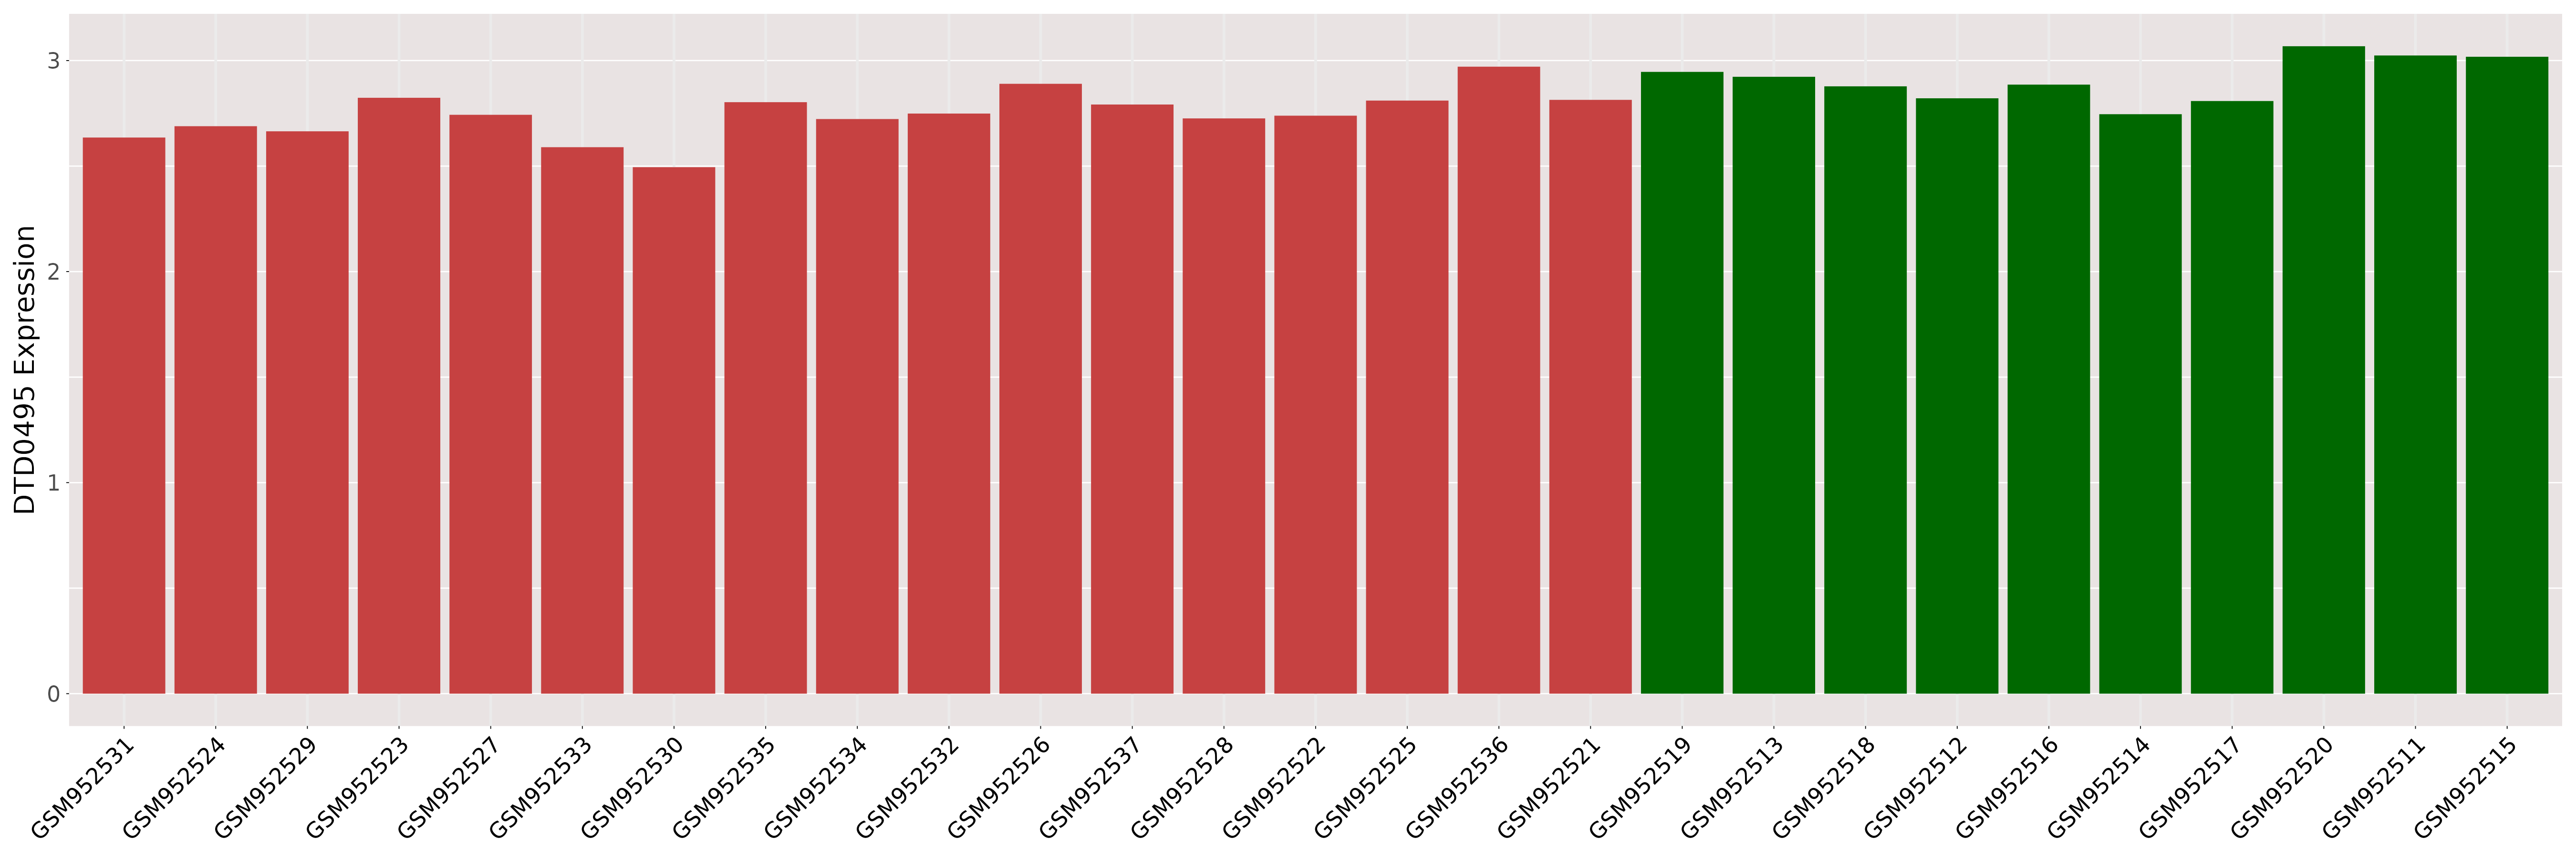
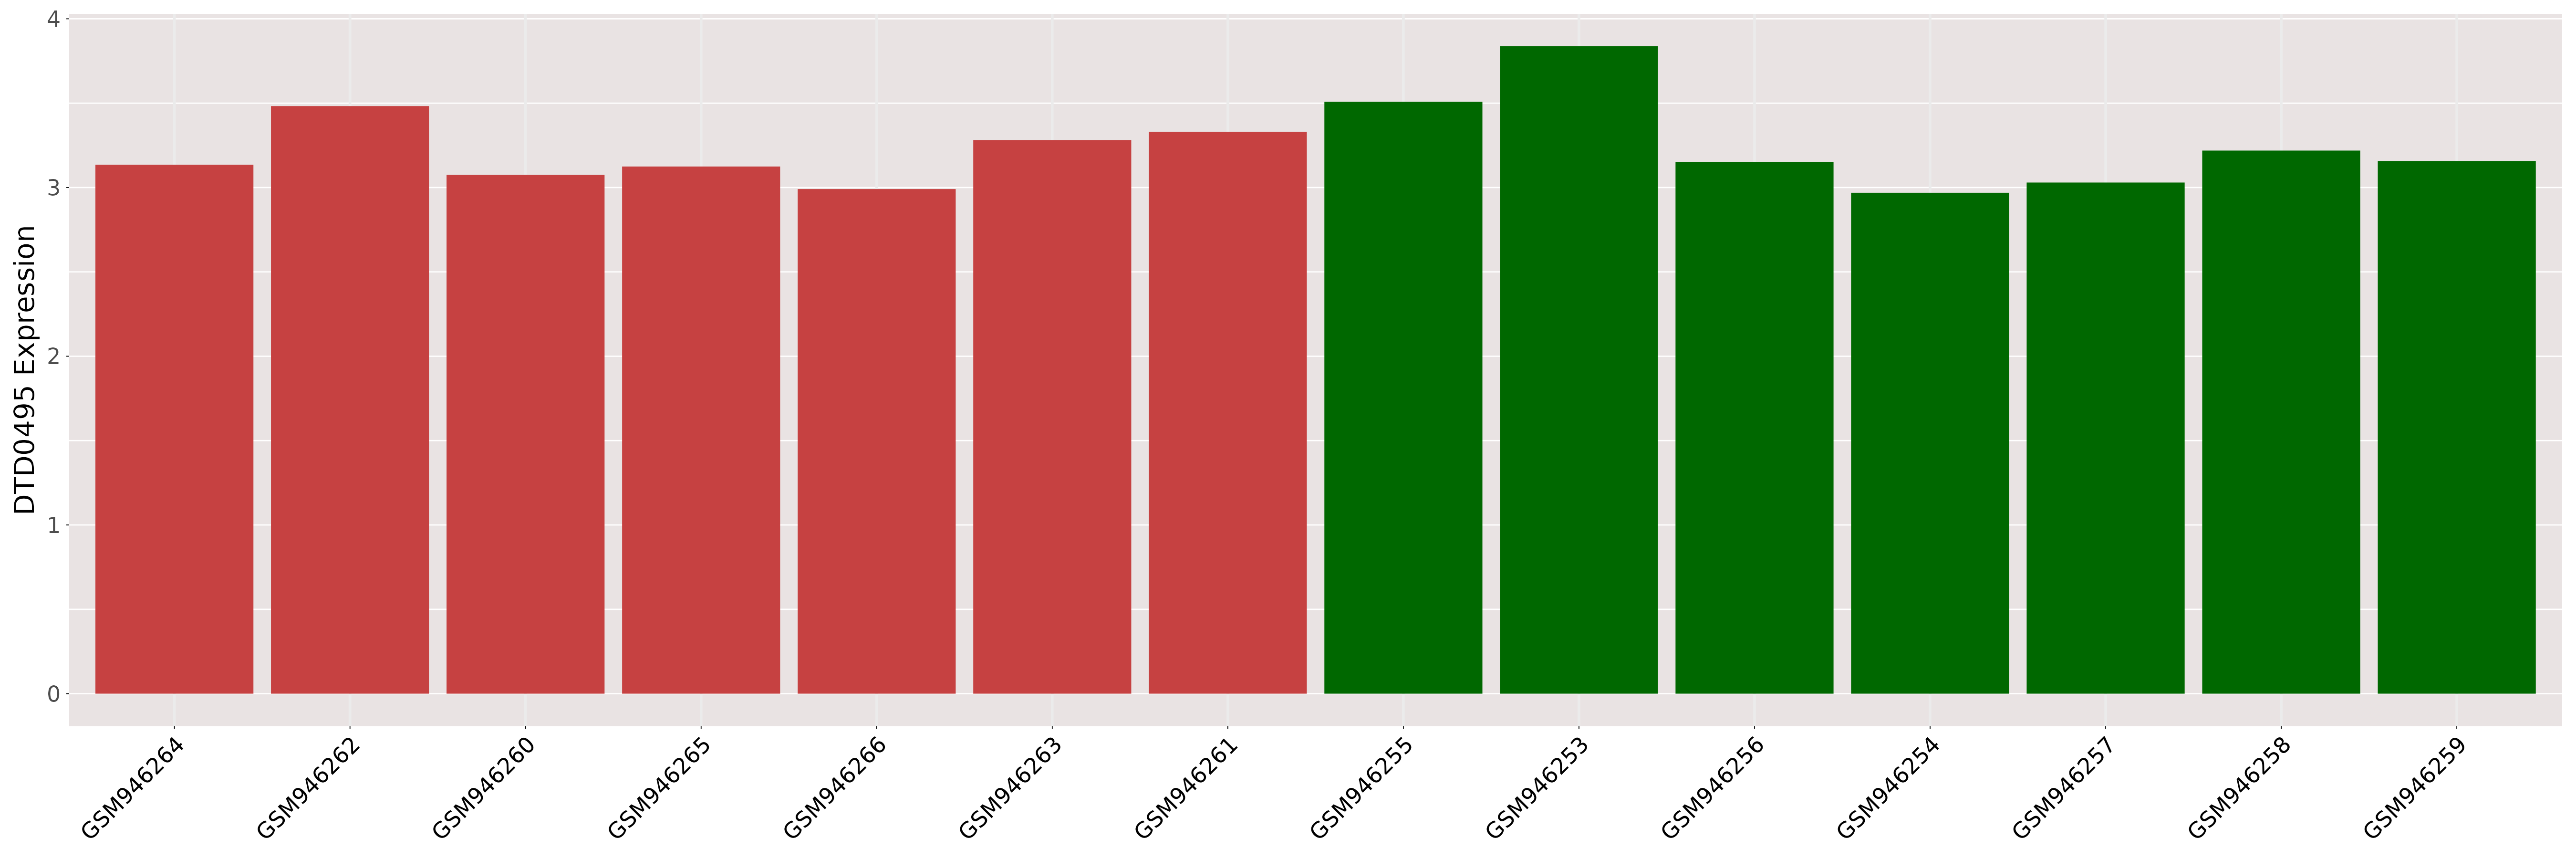
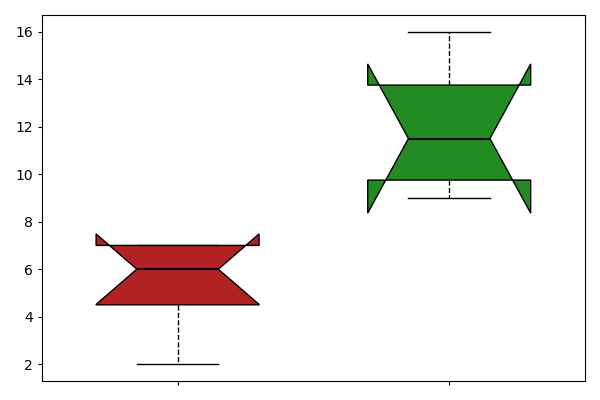
| DT expression in the diseased tissue of patients
DT expression in the normal tissue of healthy individuals
|
|||||
|
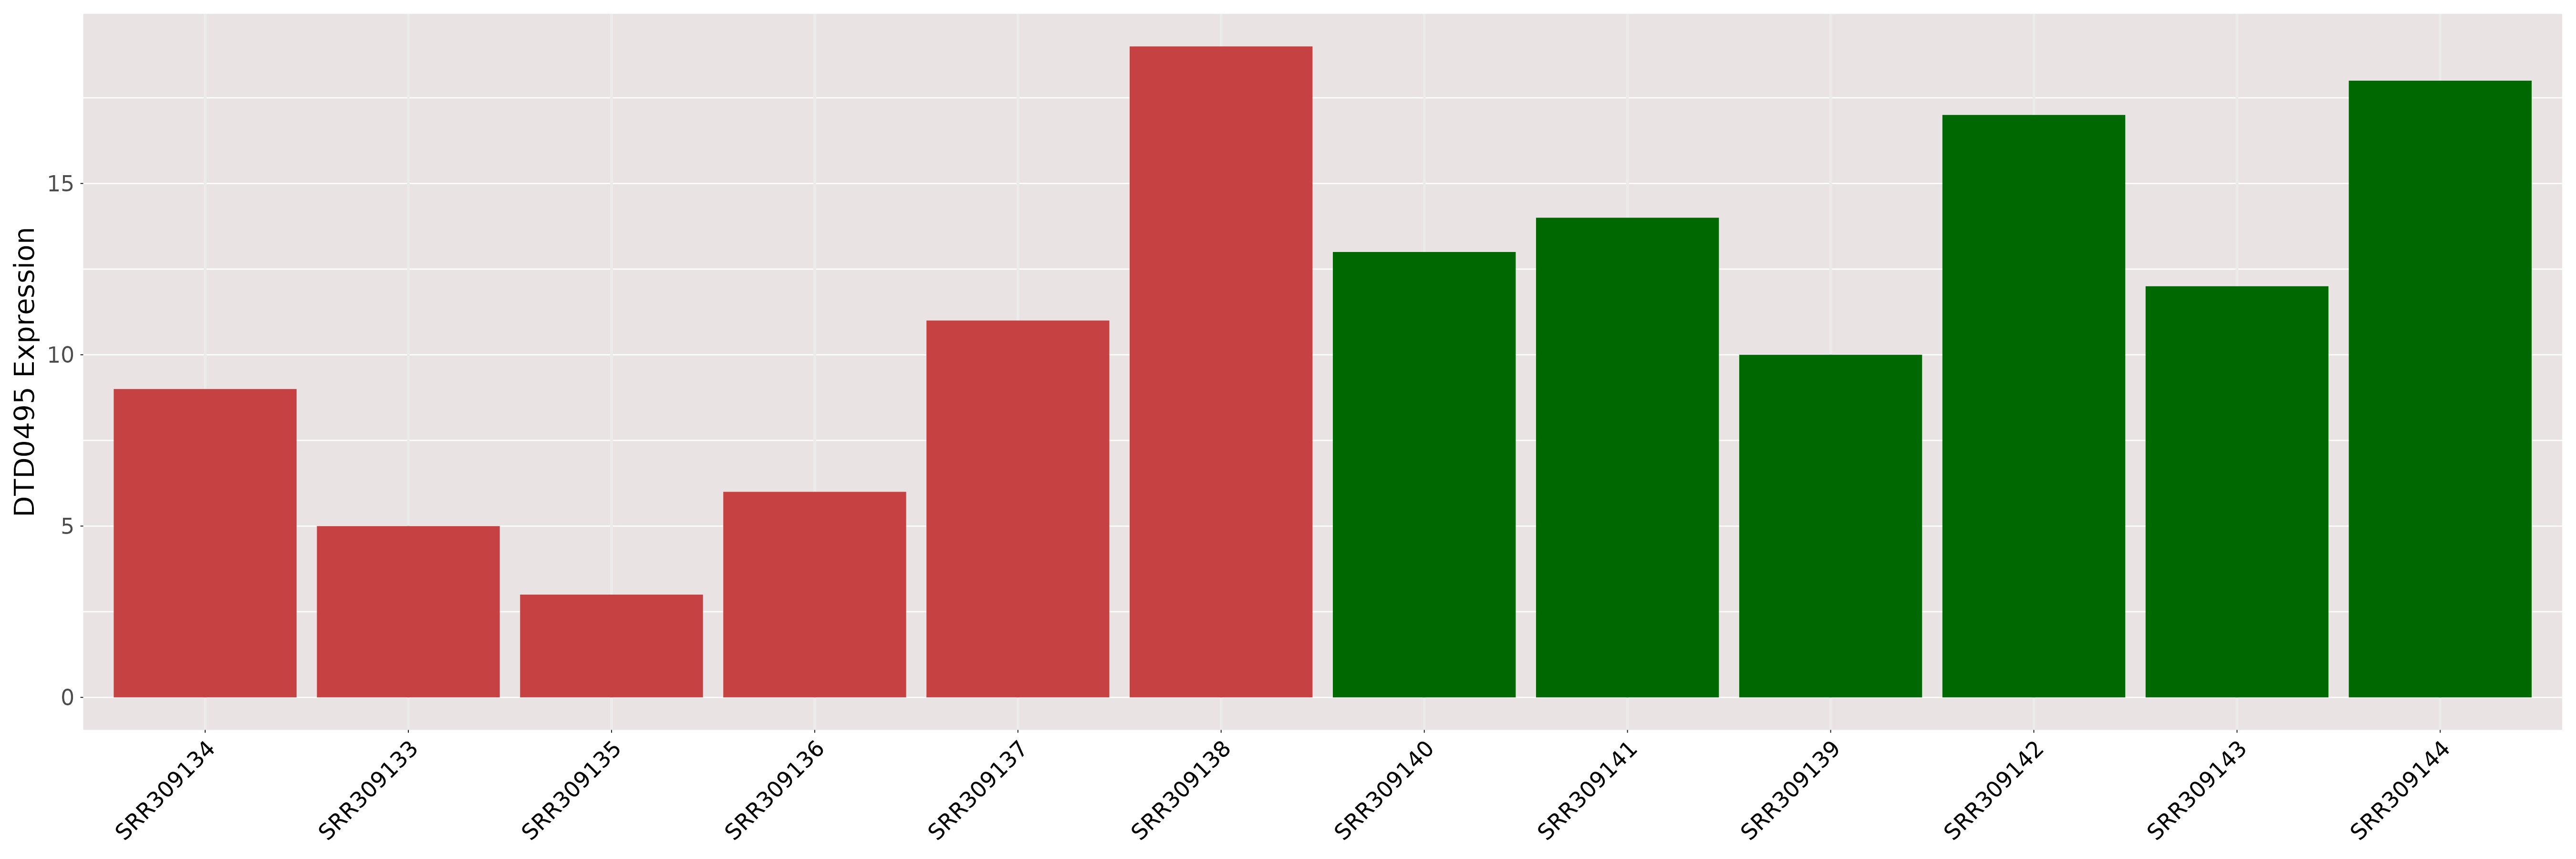
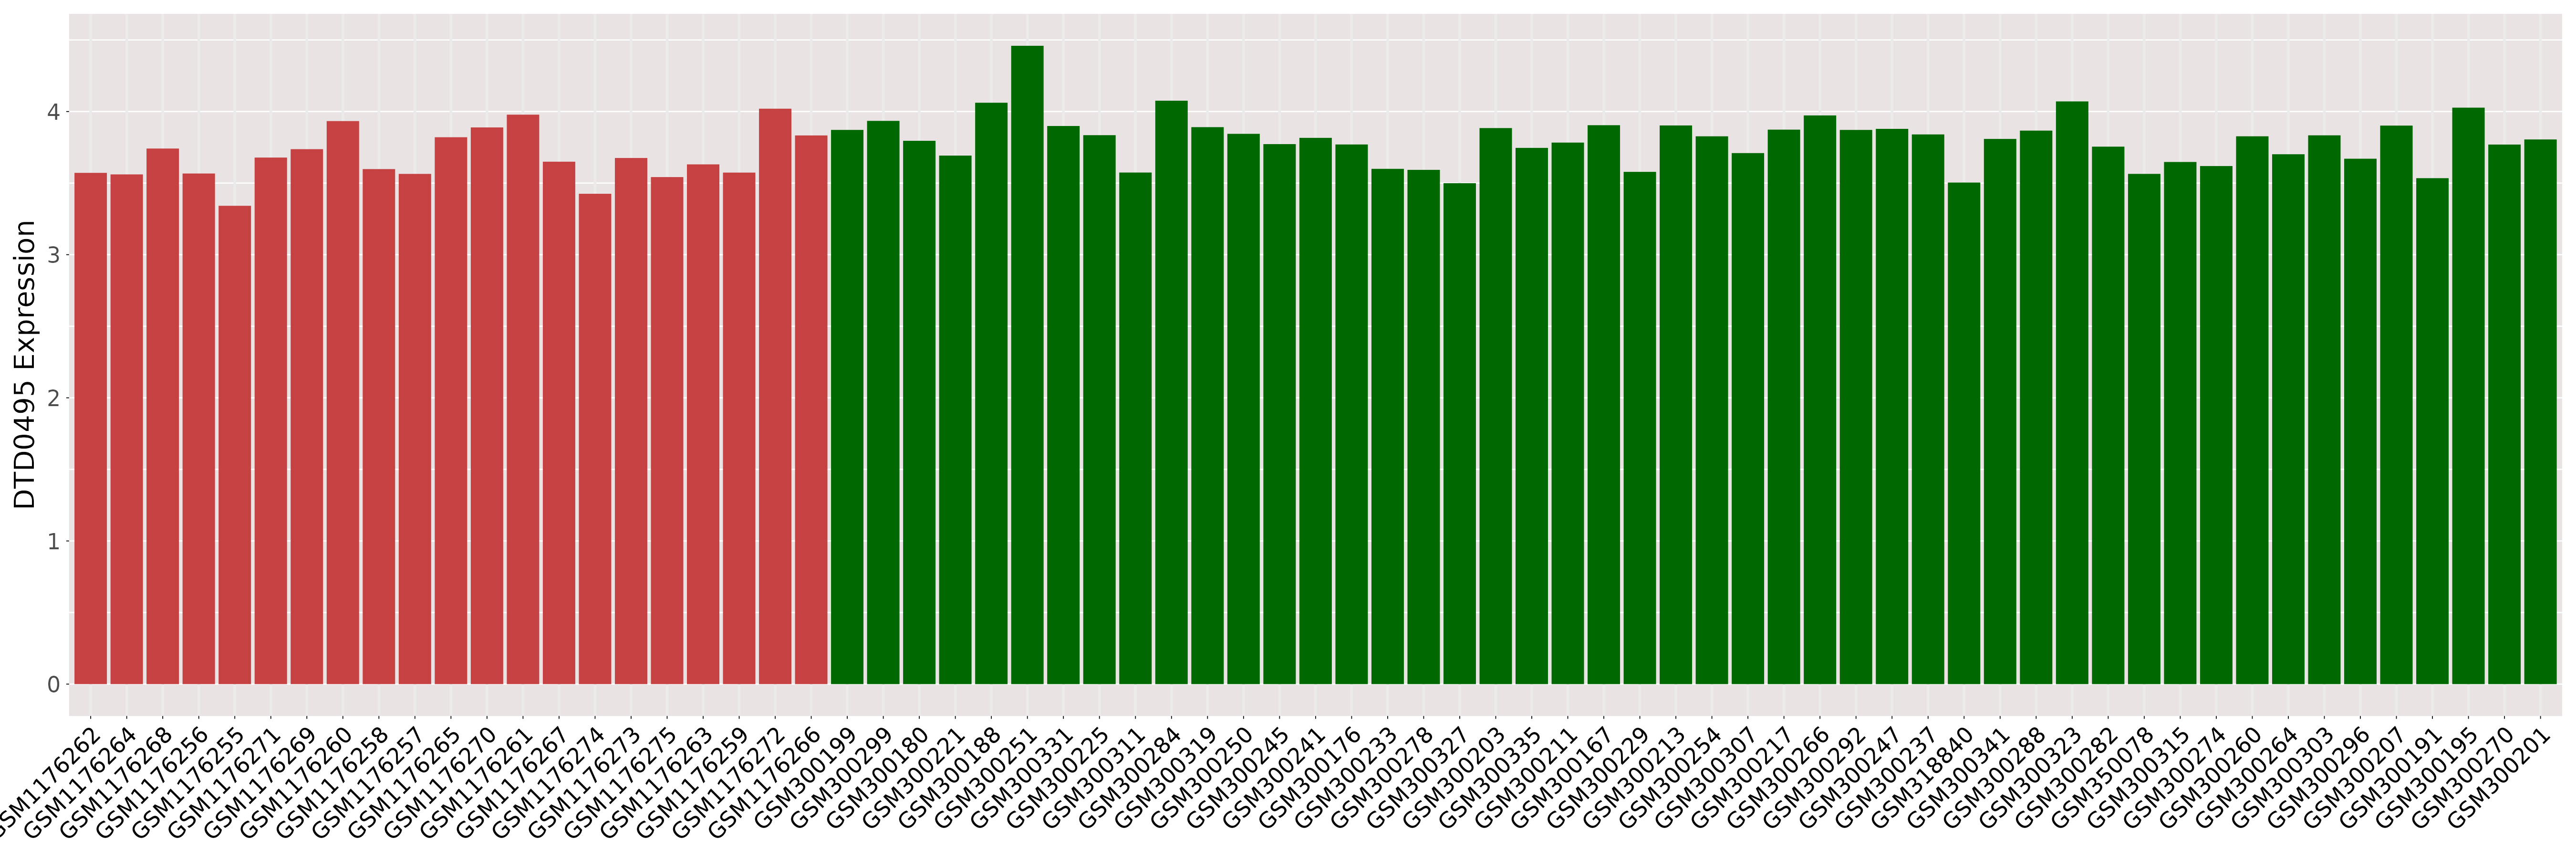
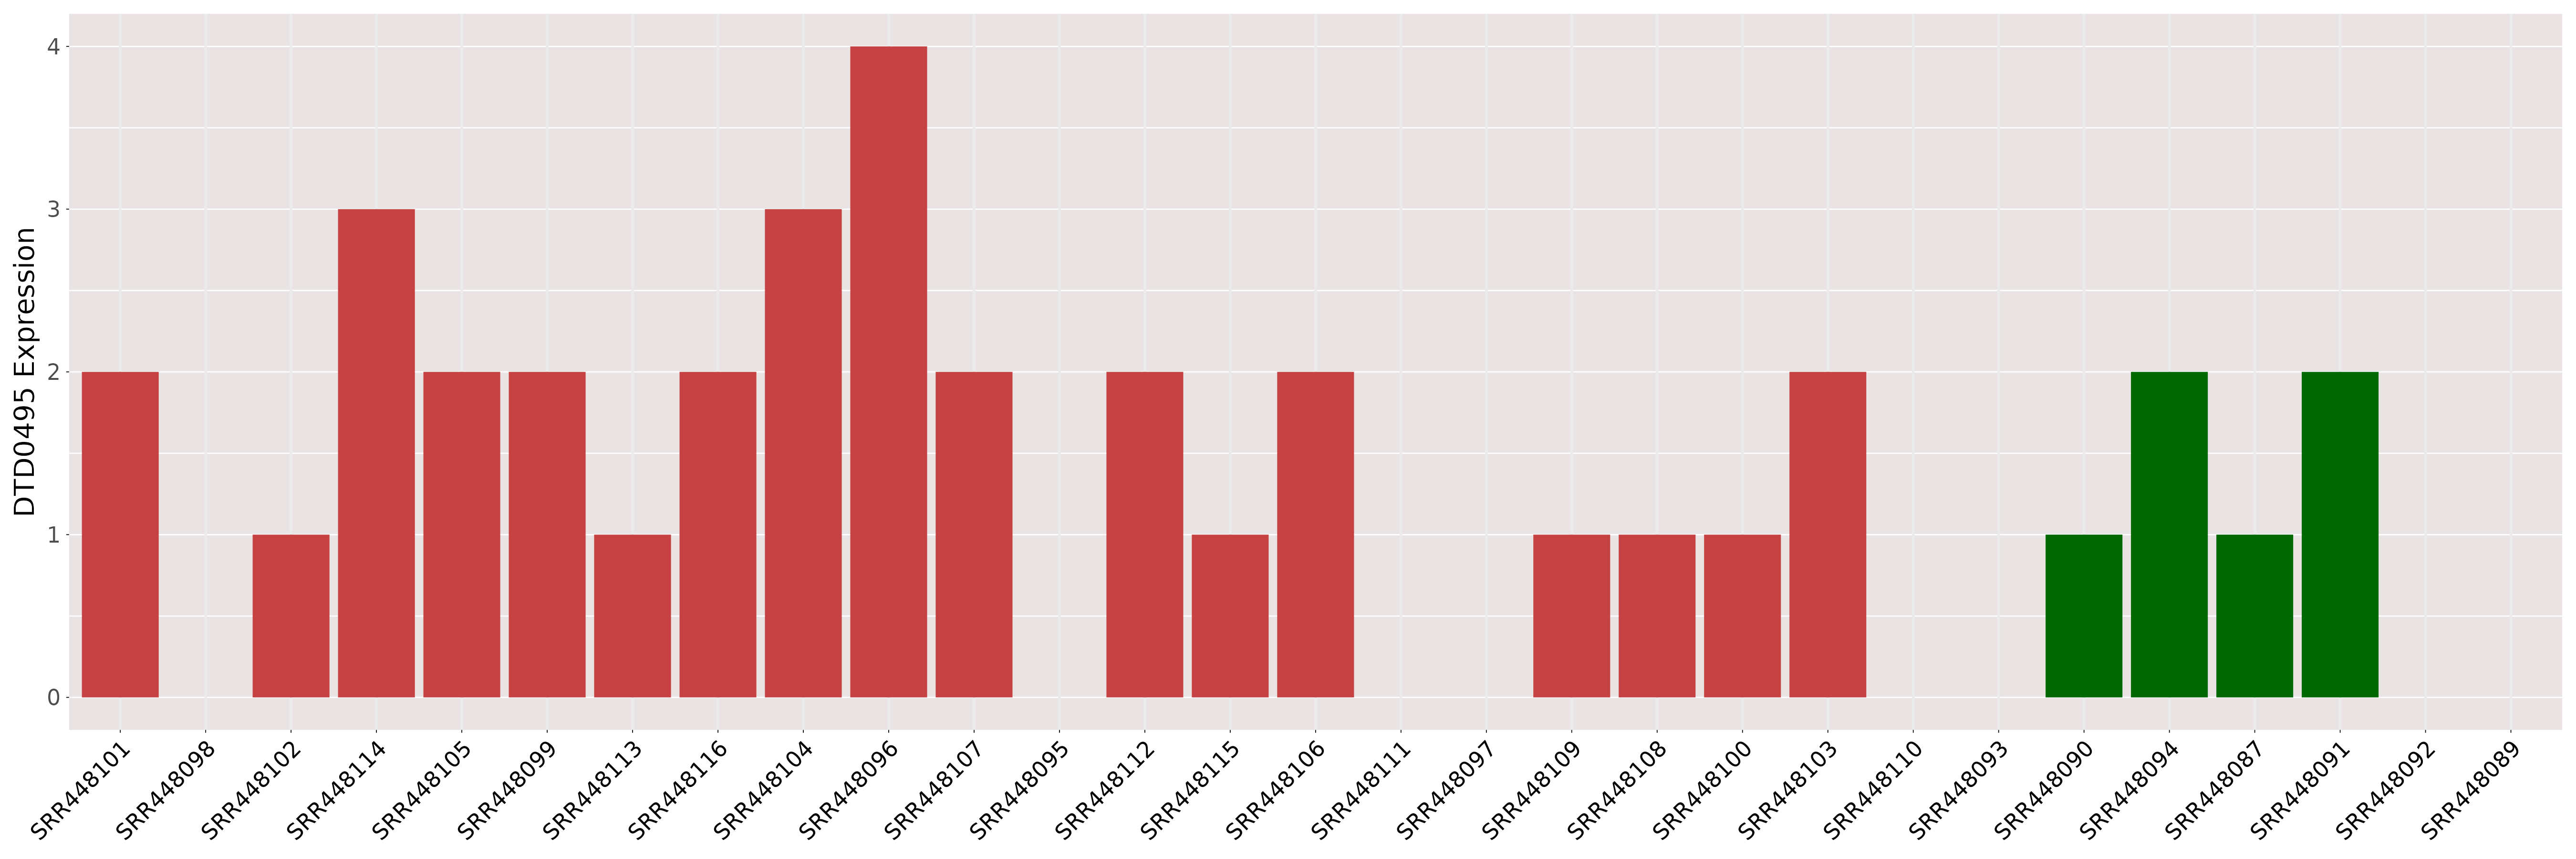
 Please Click the above Thumbnail to View/Download
the Expression Barchart for All Samples Please Click the above Thumbnail to View/Download
the Expression Barchart for All Samples
|
||||
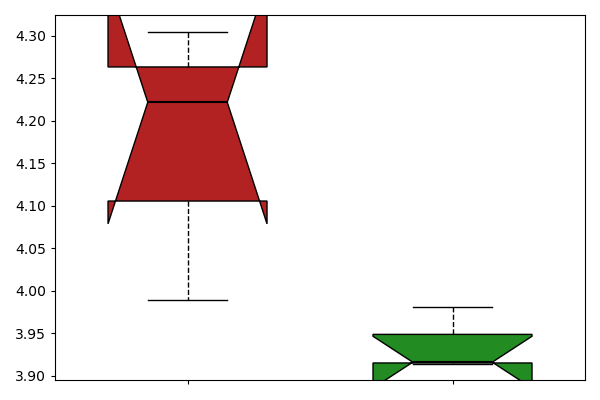
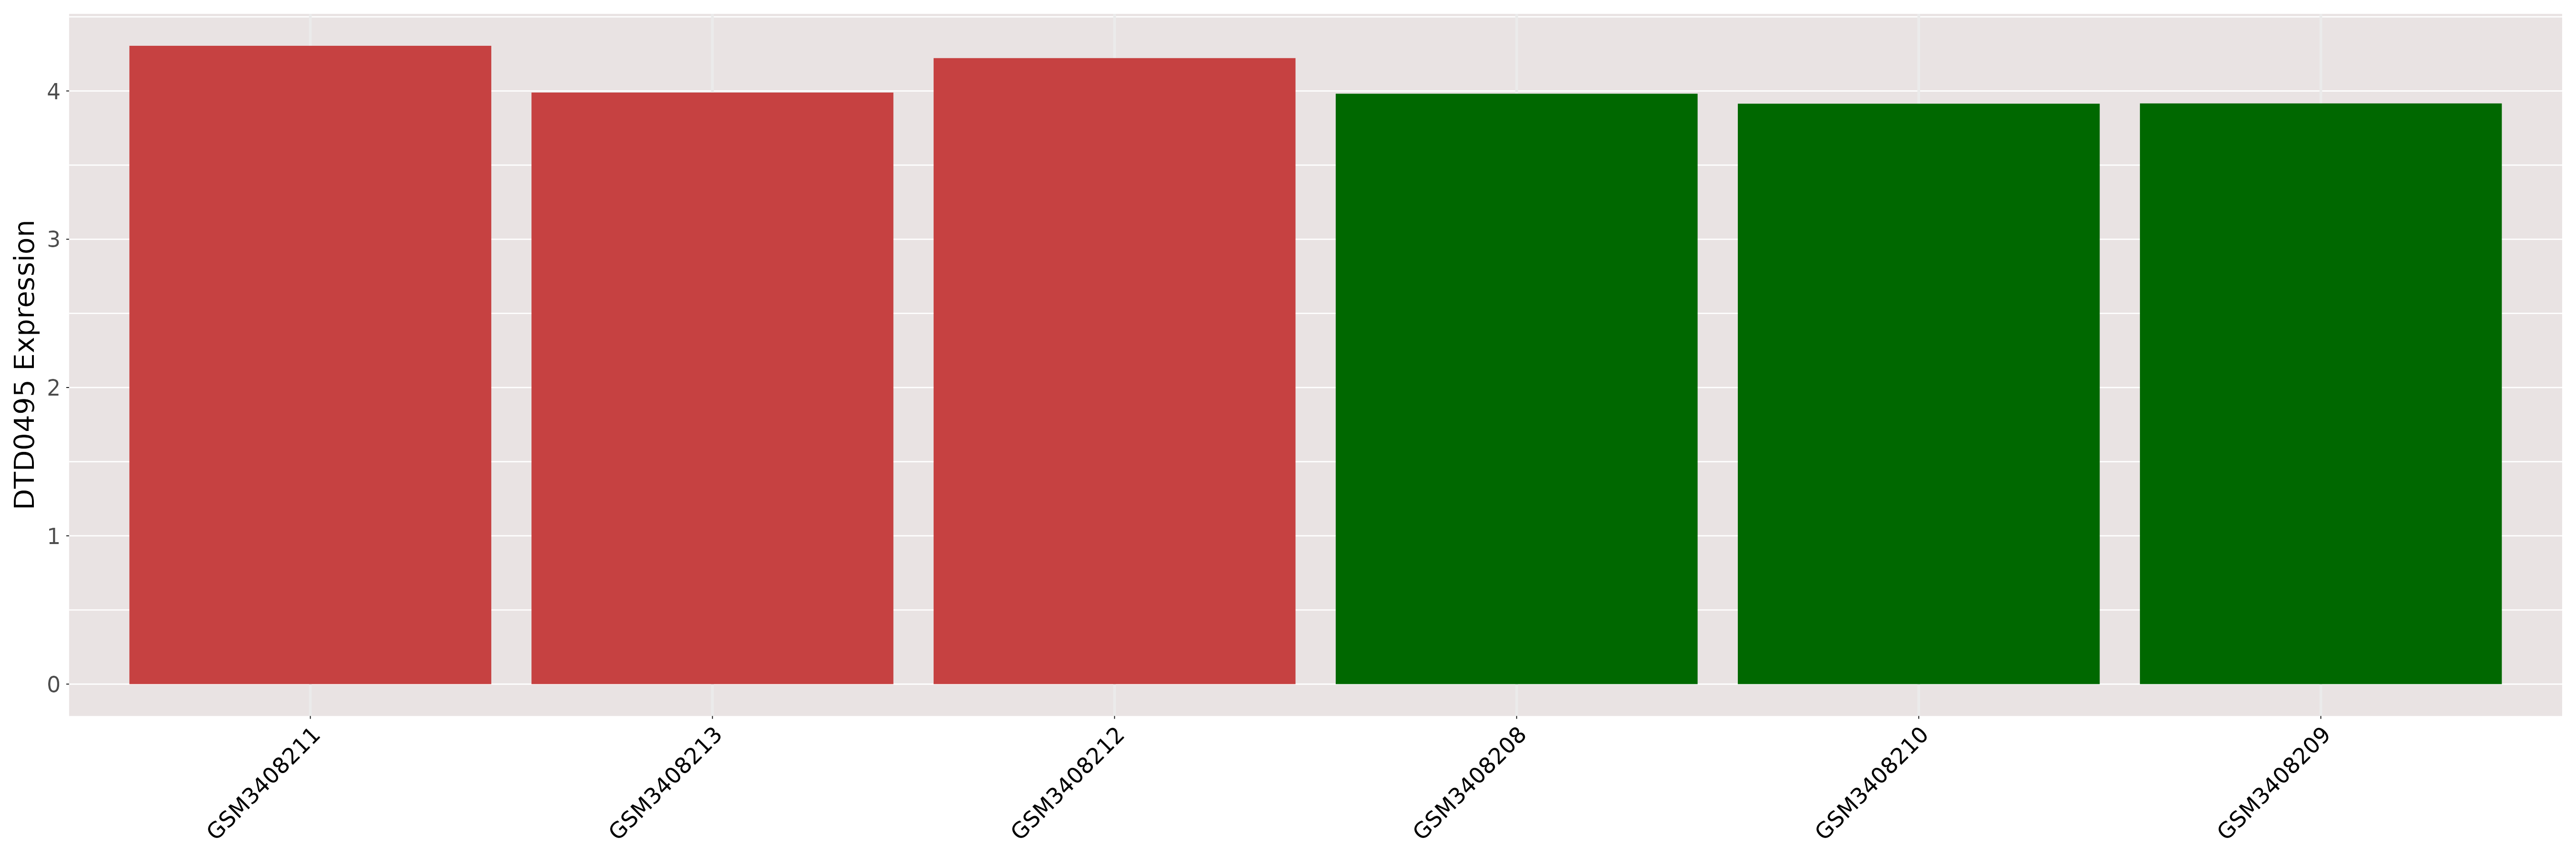
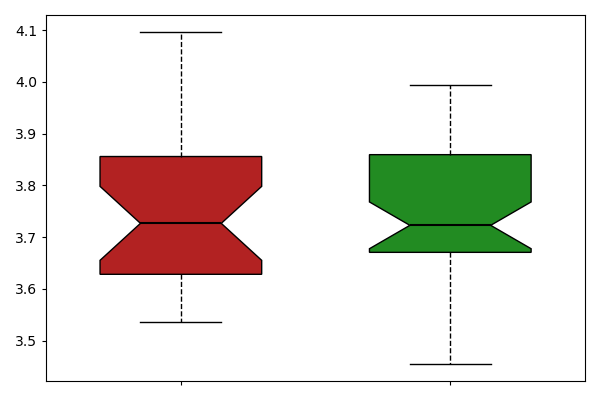
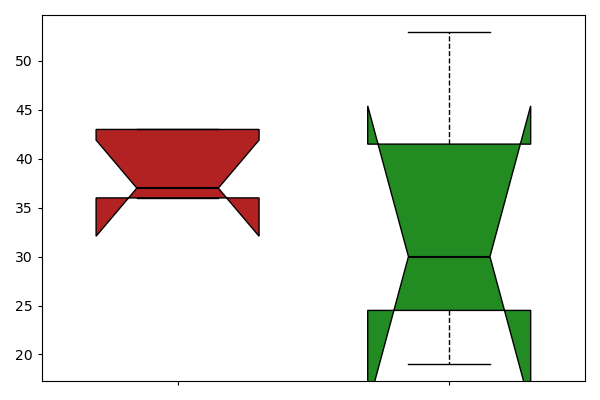
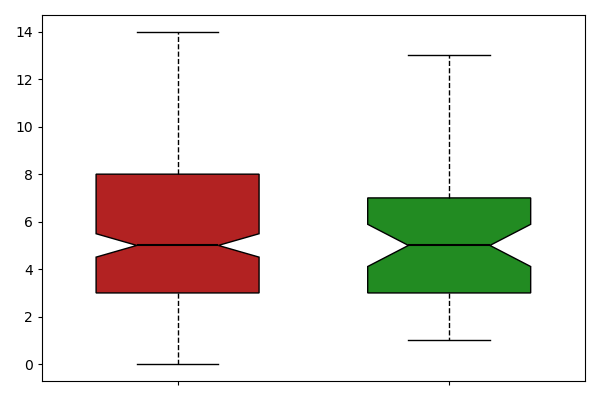
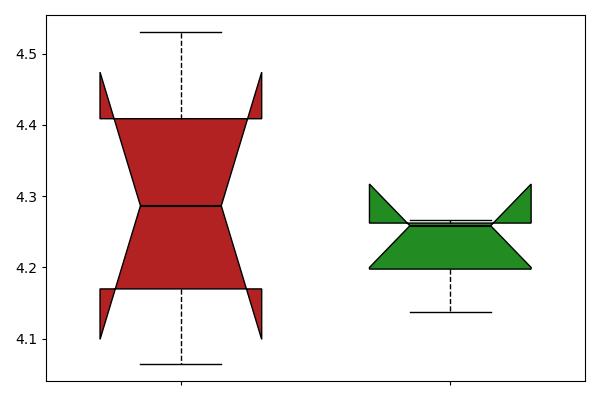
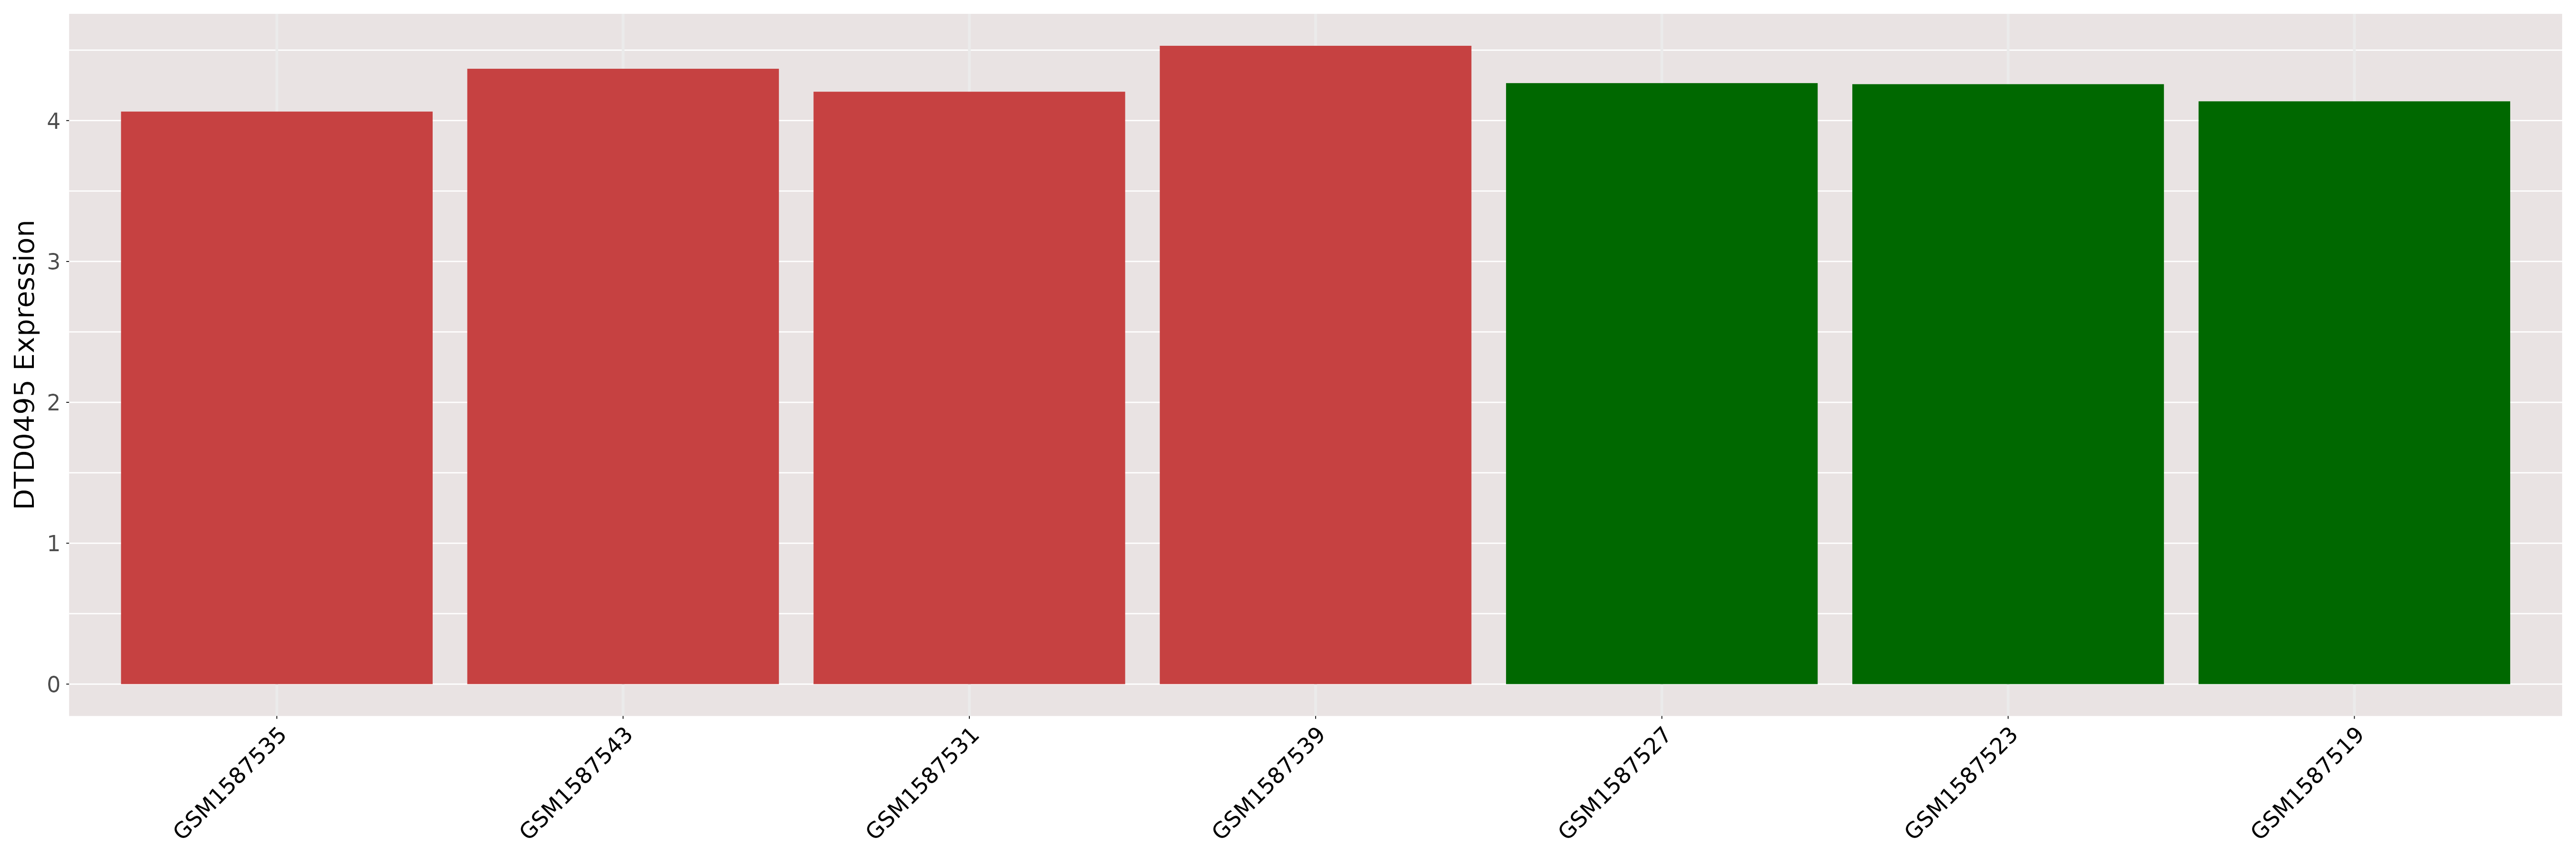
| [+] ICD-11: 2A00.10 Medulloblastoma | Click to Show/Hide the Full List | ||||
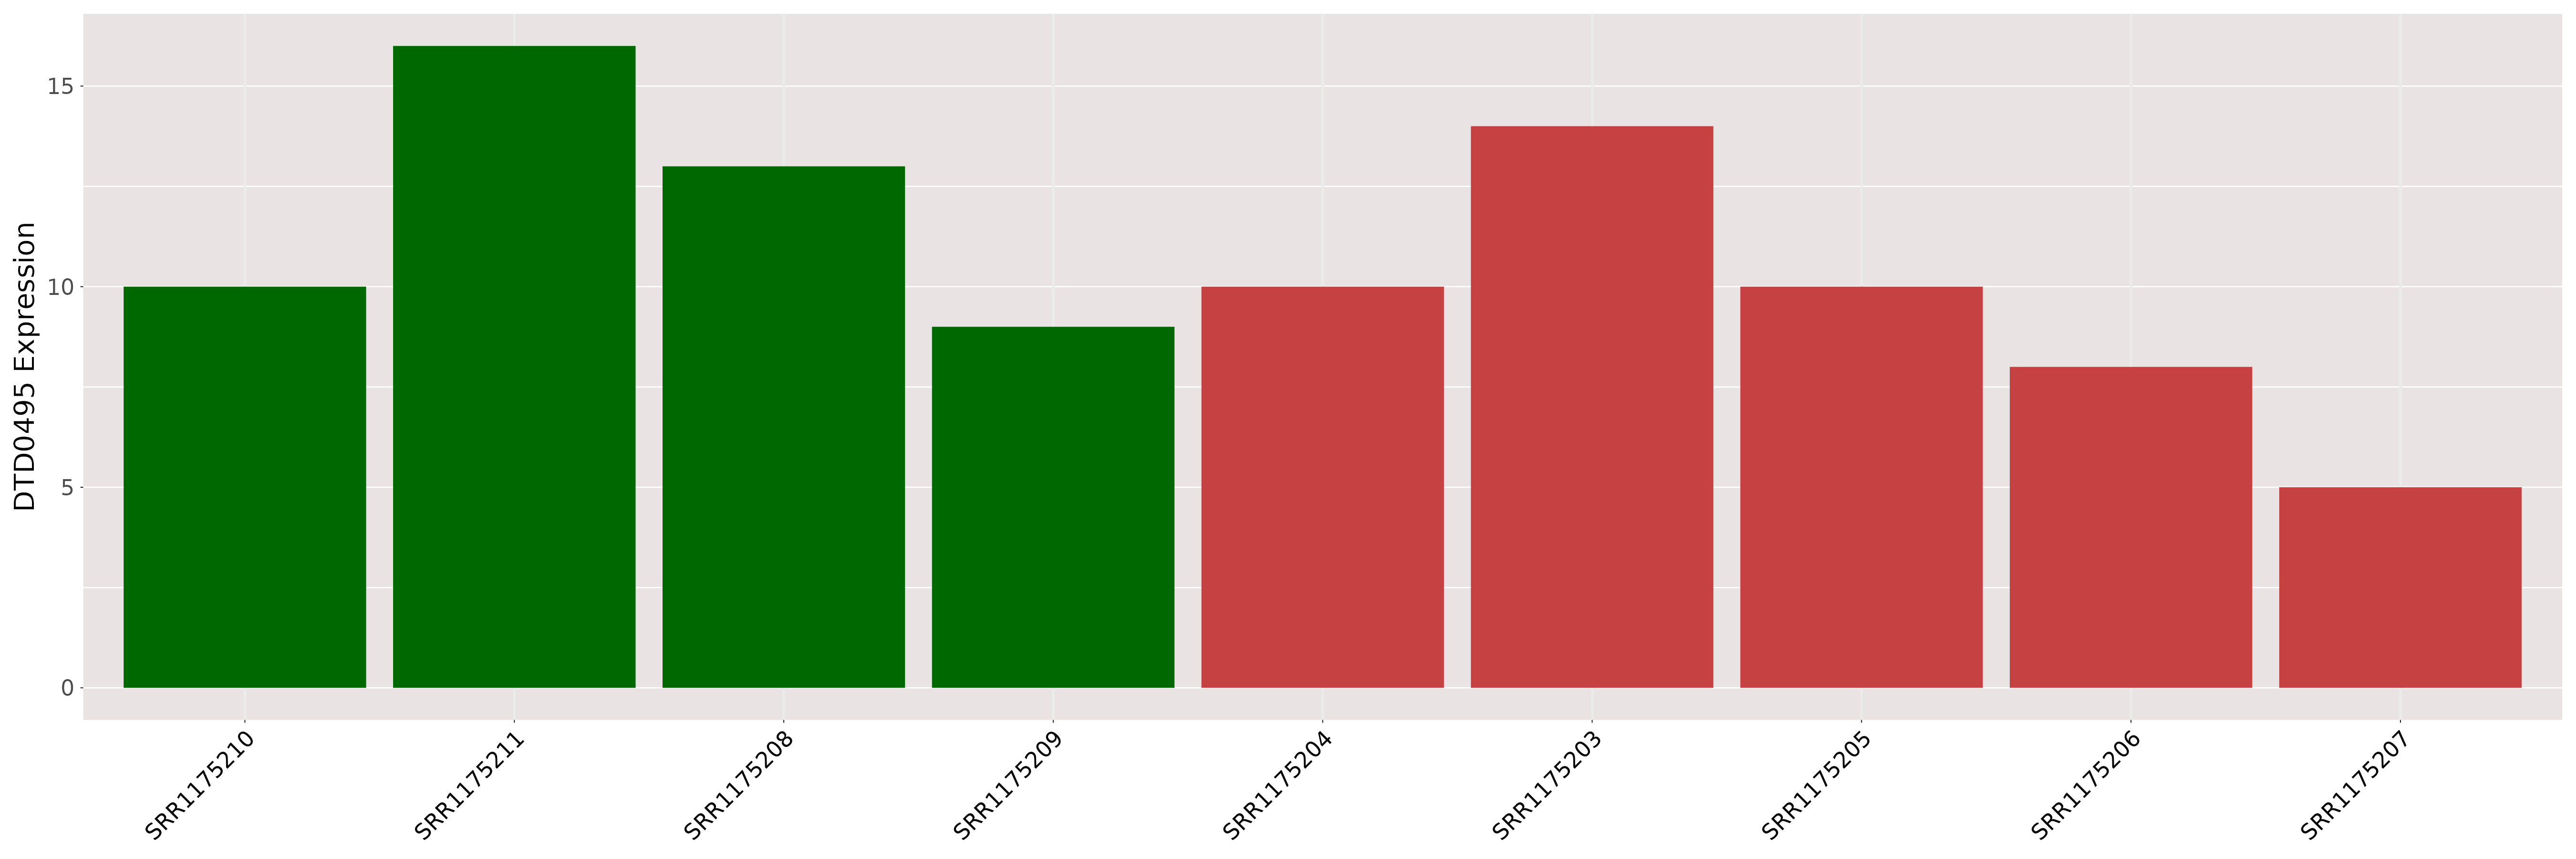
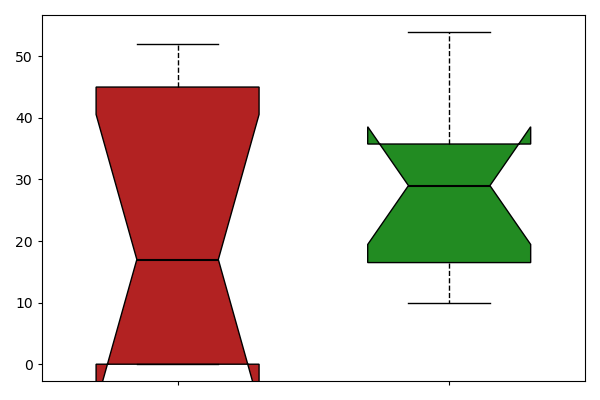
| The Studied Tissue | Brain | ||||
| The Specified Disease | Medulloblastoma [ICD-11:2A00.10] | ||||
| The Expression Level of Disease Section Compare with the Healthy Individual Tissue | p-value:0.5646626369110417; Fold-change:1.0003310295771206; Z-score:0.3944950808244787 | ||||
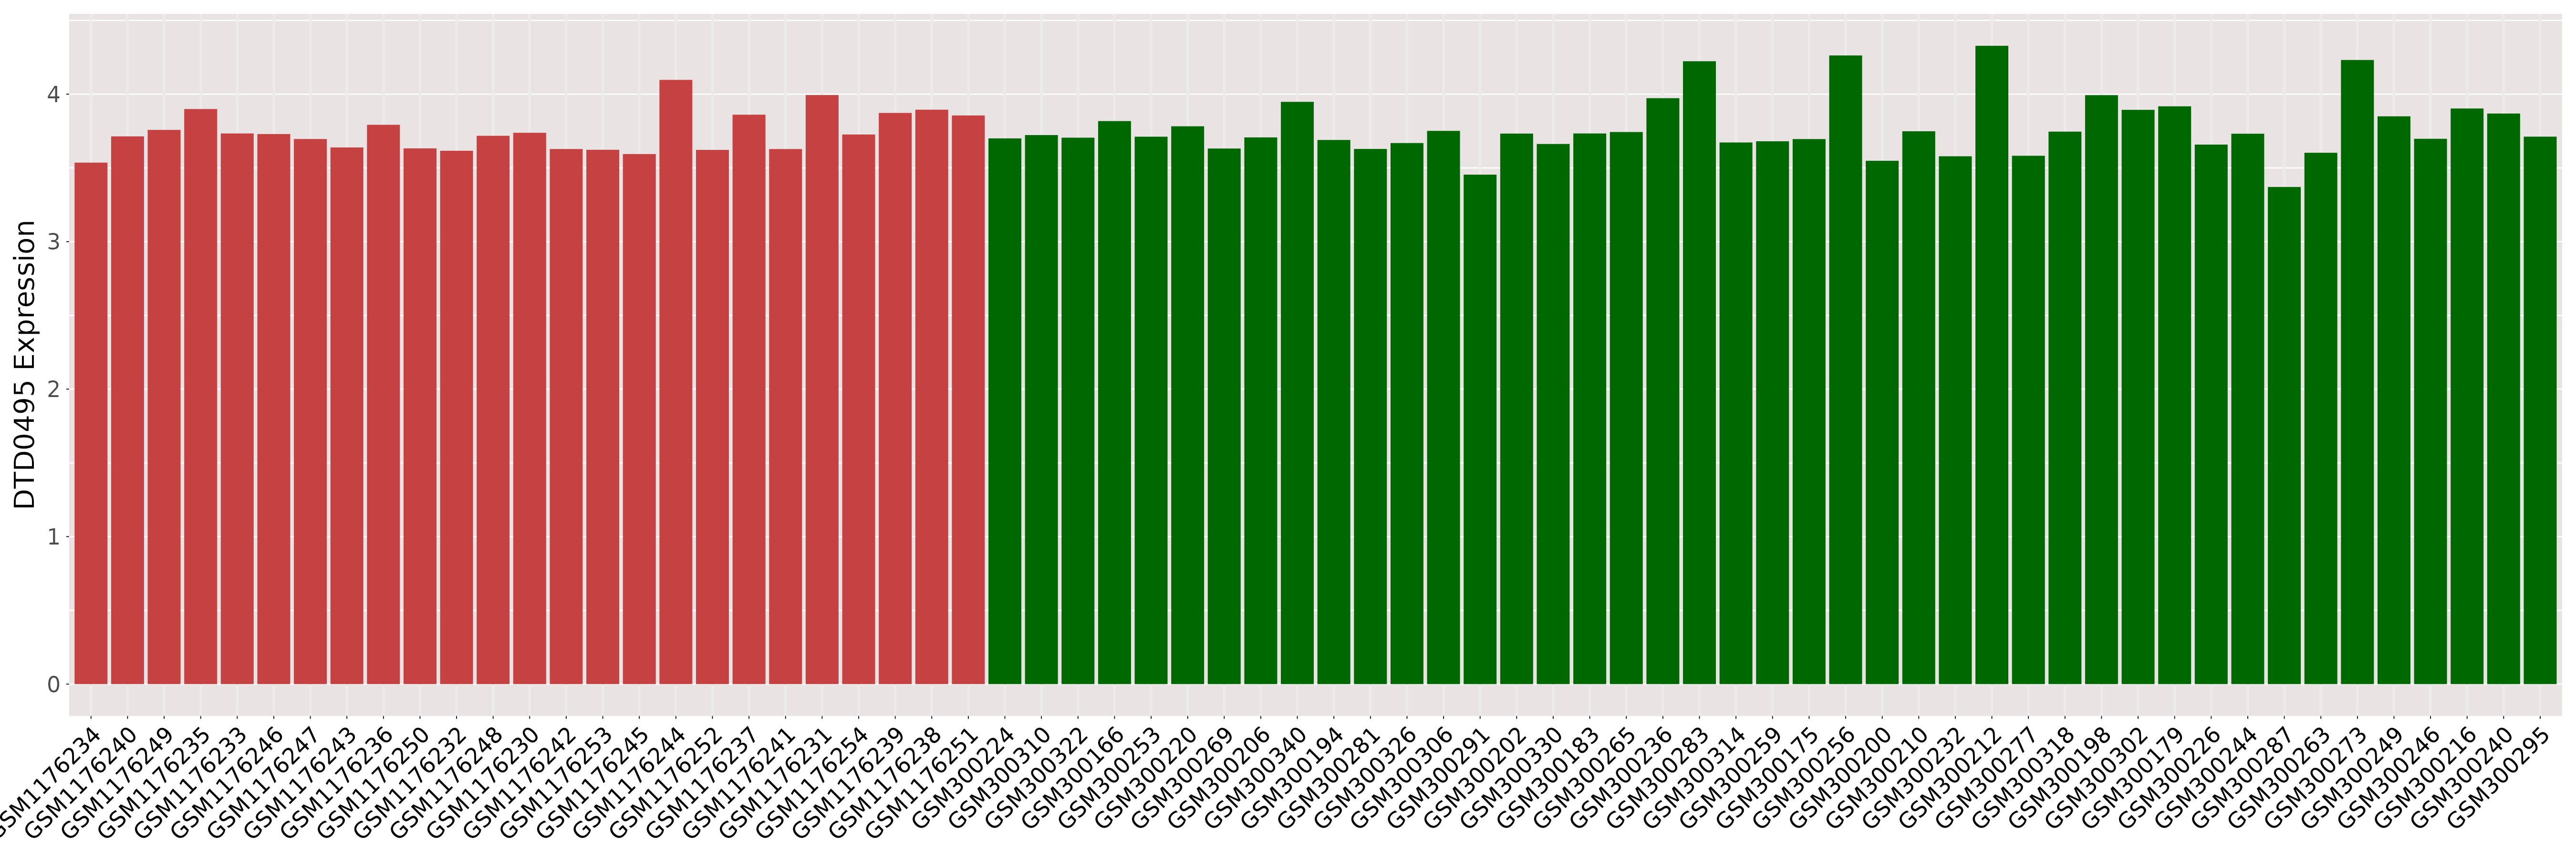
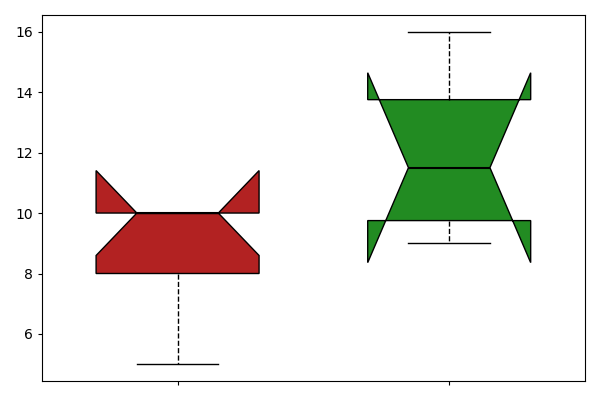
| DT expression in the diseased tissue of patients
DT expression in the normal tissue of healthy individuals
|
|||||
|
 Please Click the above Thumbnail to View/Download
the Expression Barchart for All Samples Please Click the above Thumbnail to View/Download
the Expression Barchart for All Samples
|
||||
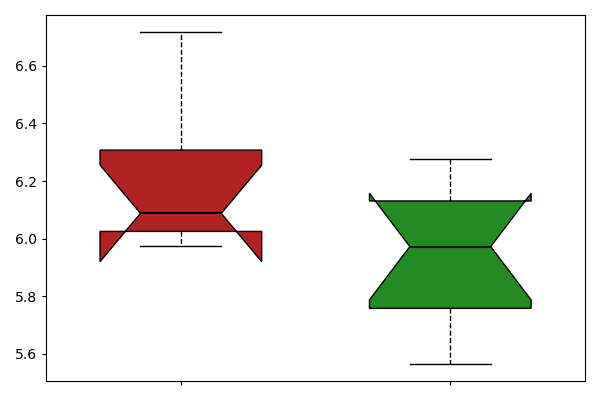
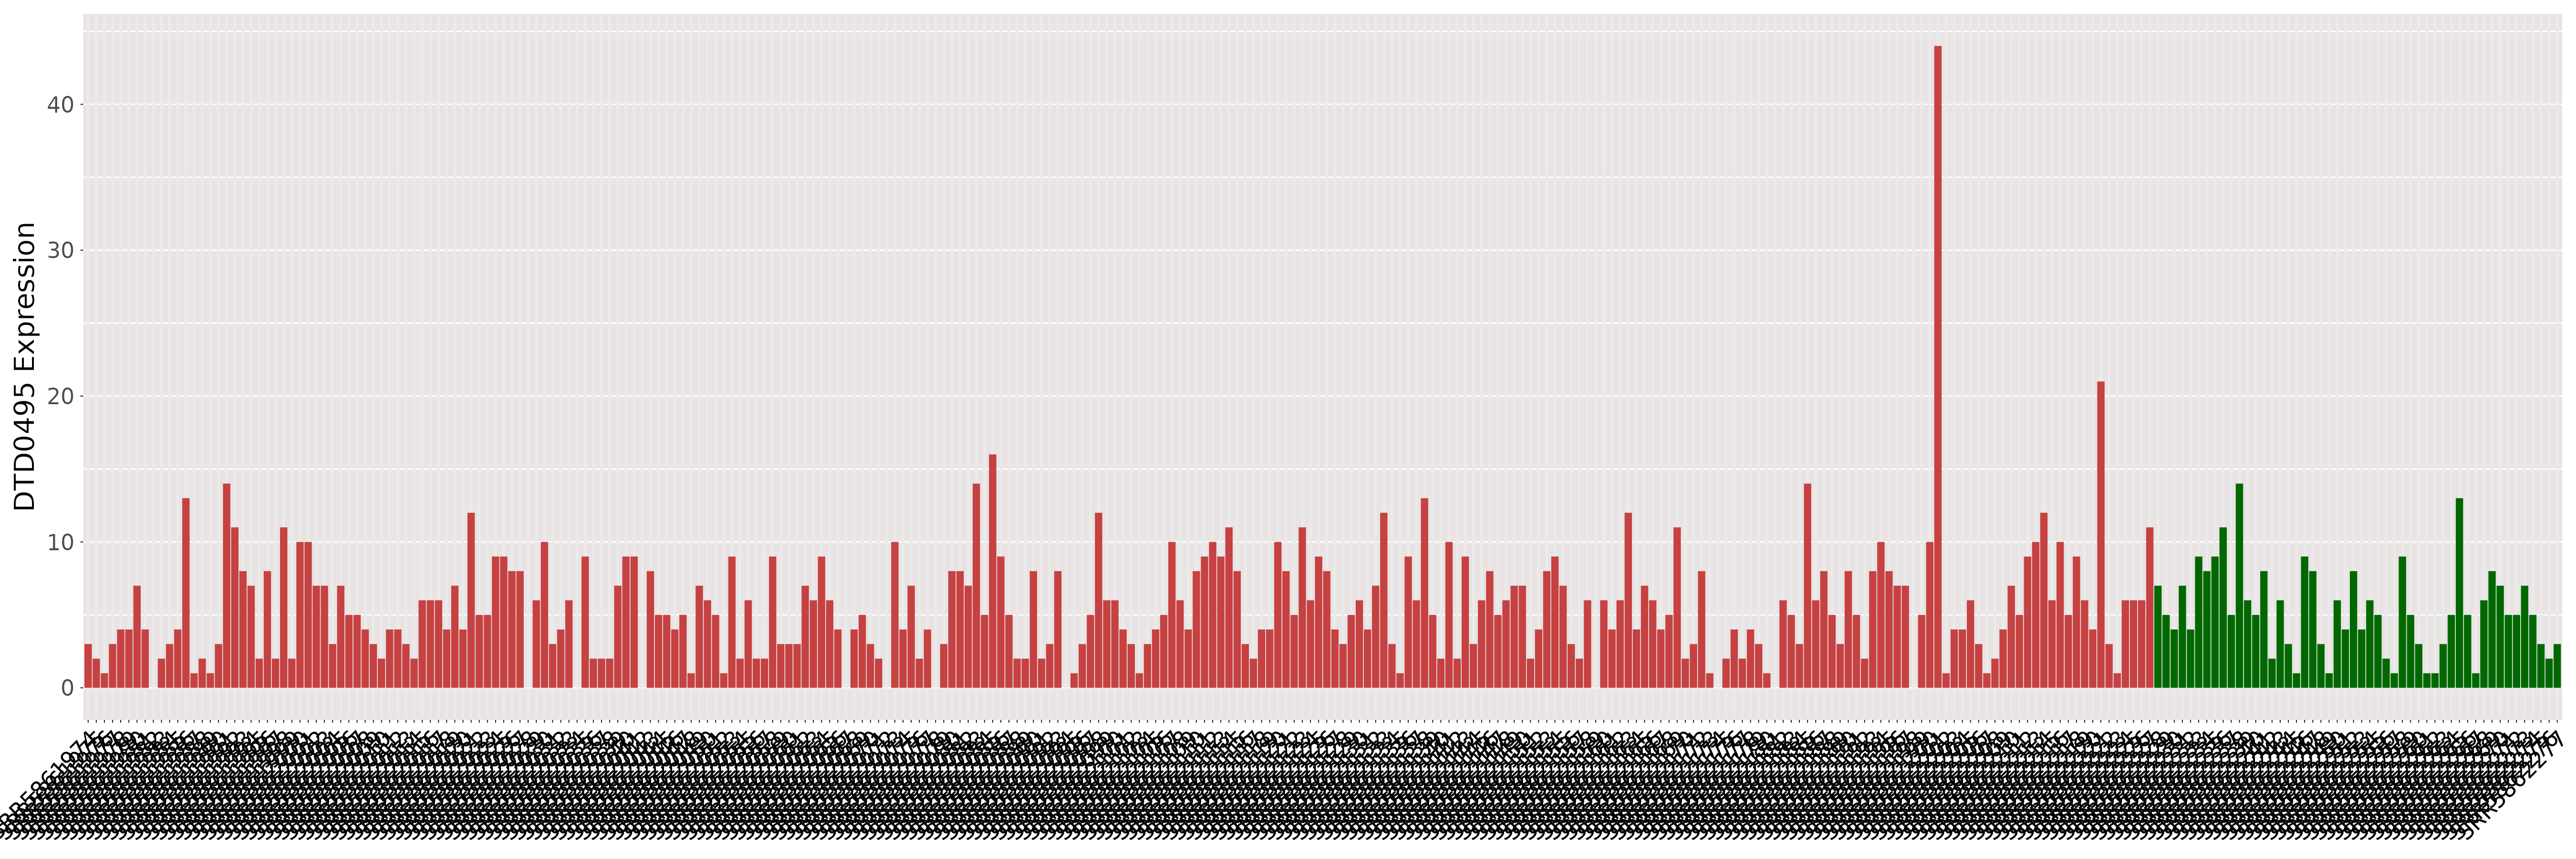
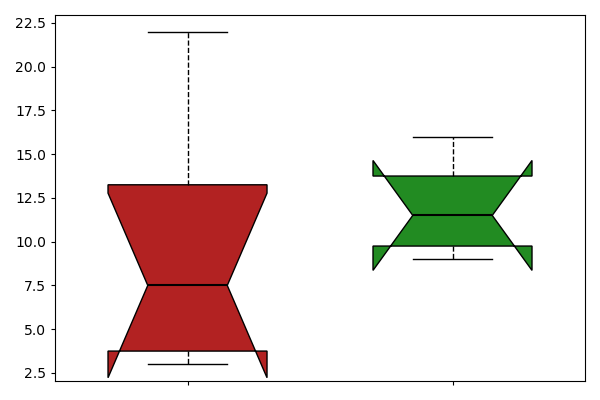
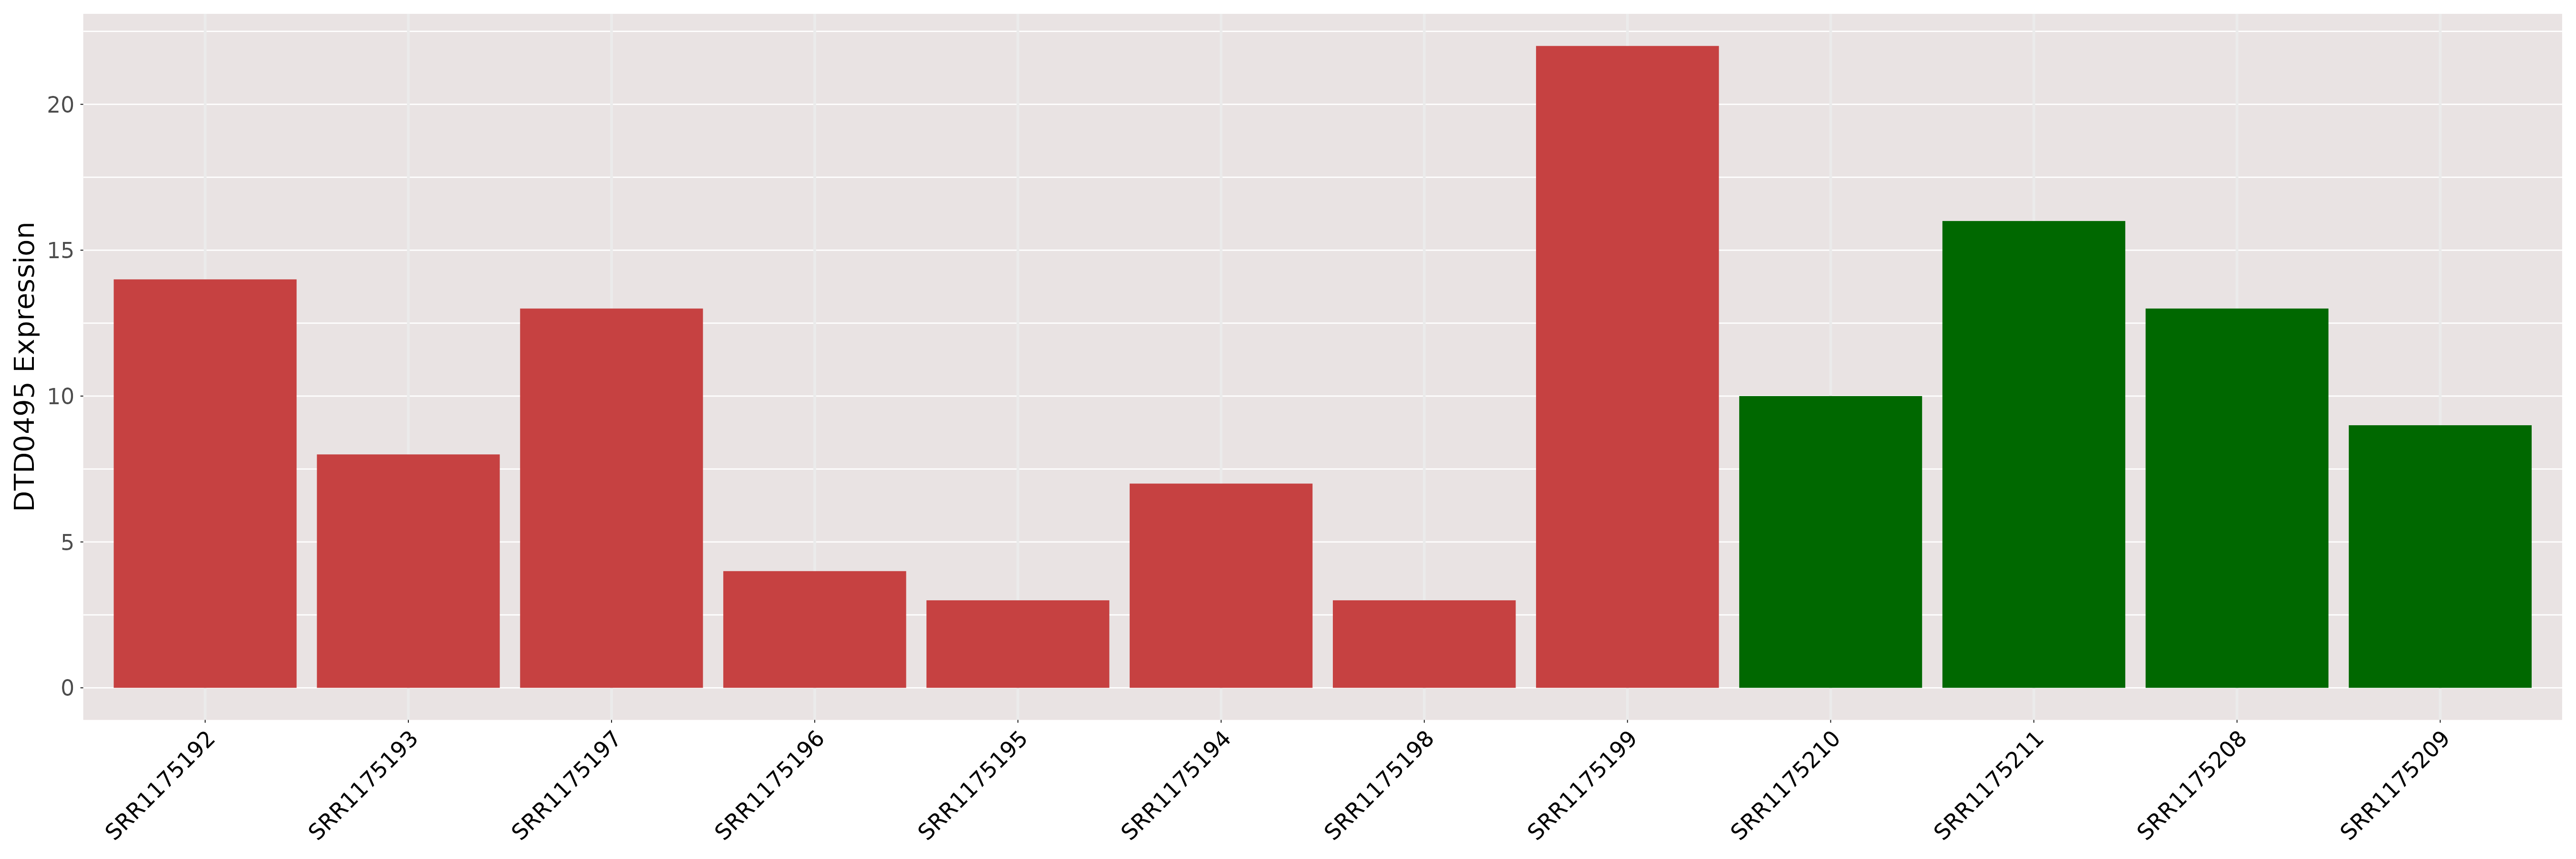
| [+] ICD-11: 2A00.1Y Glioblastoma (other specified malignant neoplasm of brain) | Click to Show/Hide the Full List | ||||
| The Studied Tissue | Brain | ||||
| The Specified Disease | Glioblastoma [ICD-11:2A00.1Y] | ||||
| The Expression Level of Disease Section Compare with the Healthy Individual Tissue | p-value:0.2391095131493743; Fold-change:0.9867174384162608; Z-score:-0.600122516 | ||||
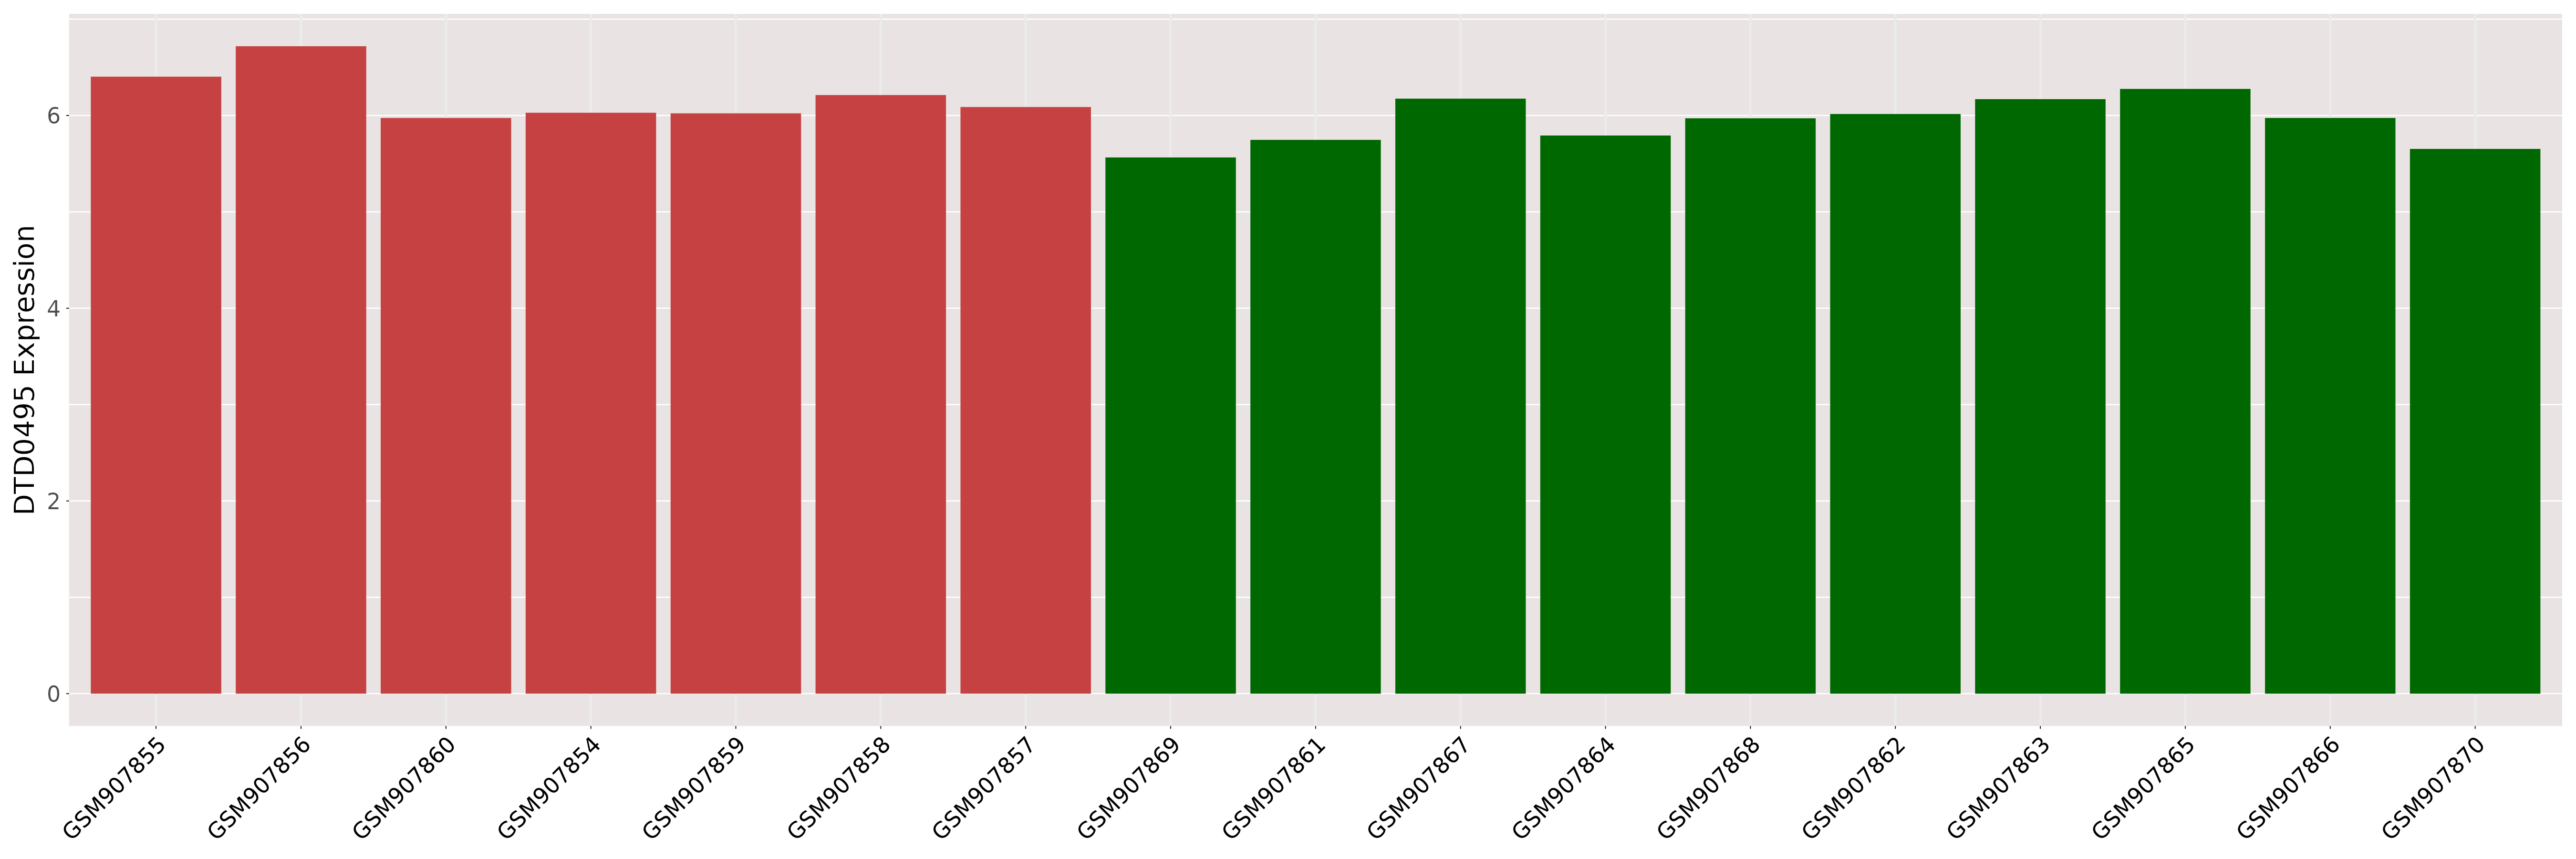
| DT expression in the diseased tissue of patients
DT expression in the normal tissue of healthy individuals
|
|||||
|
 Please Click the above Thumbnail to View/Download
the Expression Barchart for All Samples Please Click the above Thumbnail to View/Download
the Expression Barchart for All Samples
|
||||
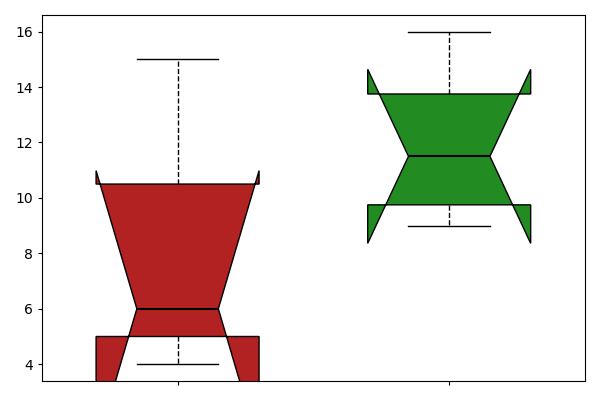
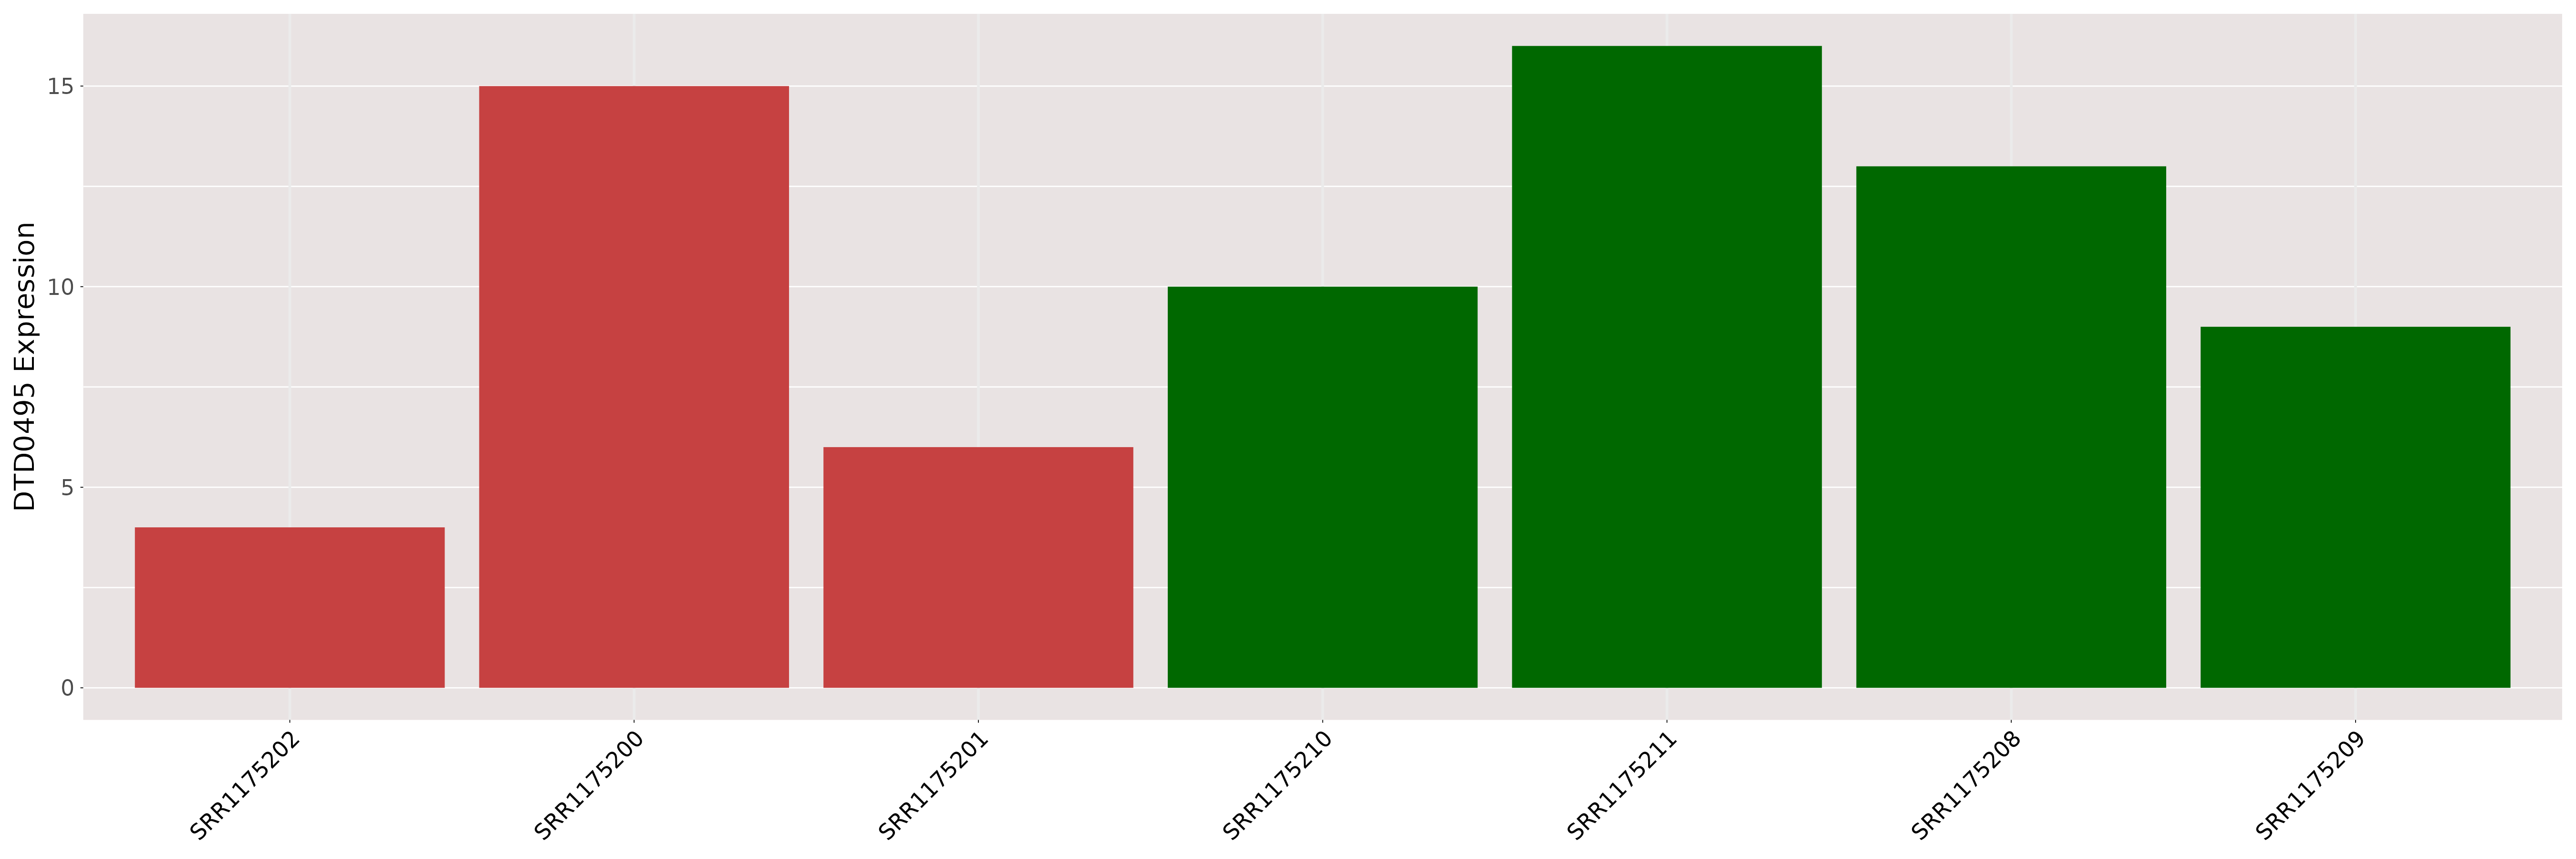
| [+] ICD-11: 2A00.1Y Large-cell medulloblastoma | Click to Show/Hide the Full List | ||||
| The Studied Tissue | Brain | ||||
| The Specified Disease | Medulloblastoma, large cell [ICD-11:2A00.10] | ||||
| The Expression Level of Disease Section Compare with the Healthy Individual Tissue | p-value:0.3693590896622077; Fold-change:1.040096401648761; Z-score:0.6669629601111078 | ||||
| DT expression in the diseased tissue of patients
DT expression in the normal tissue of healthy individuals
|
|||||
|
 Please Click the above Thumbnail to View/Download
the Expression Barchart for All Samples Please Click the above Thumbnail to View/Download
the Expression Barchart for All Samples
|
||||
| [+] ICD-11: 2A00.1Y Primitive neuroectodermal tumor (PNET) | Click to Show/Hide the Full List | ||||
| The Studied Tissue | Brain | ||||
| The Specified Disease | Primitive neuroectodermal tumor [ICD-11:2A00.Y] | ||||
| The Expression Level of Disease Section Compare with the Healthy Individual Tissue | p-value:0.6089244621914416; Fold-change:0.9730550819798598; Z-score:0.6533685185784552 | ||||
| DT expression in the diseased tissue of patients
DT expression in the normal tissue of healthy individuals
|
|||||
|
 Please Click the above Thumbnail to View/Download
the Expression Barchart for All Samples Please Click the above Thumbnail to View/Download
the Expression Barchart for All Samples
|
||||
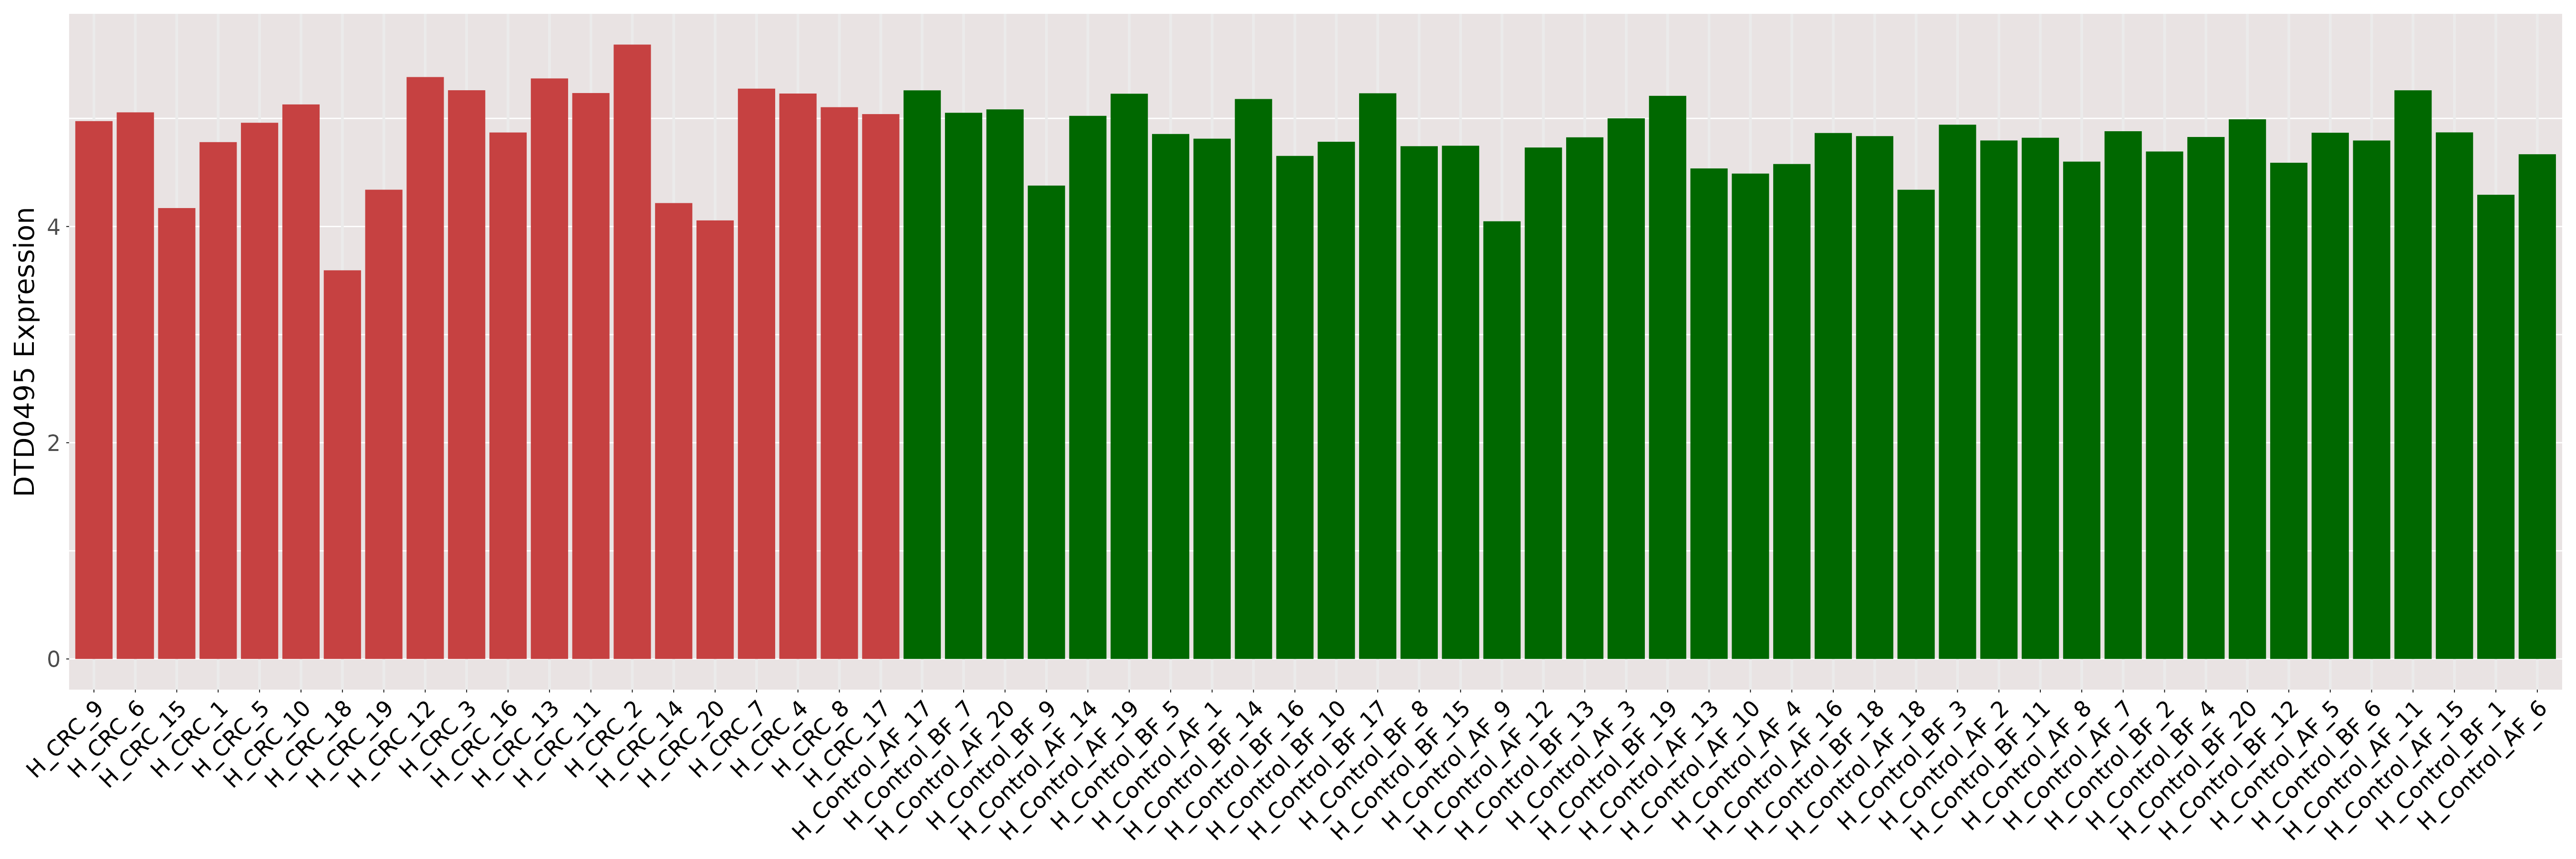
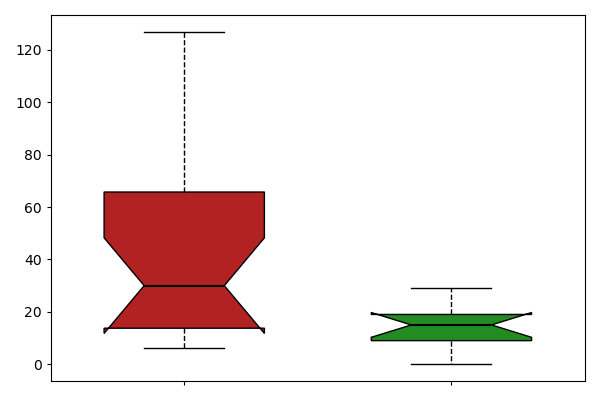
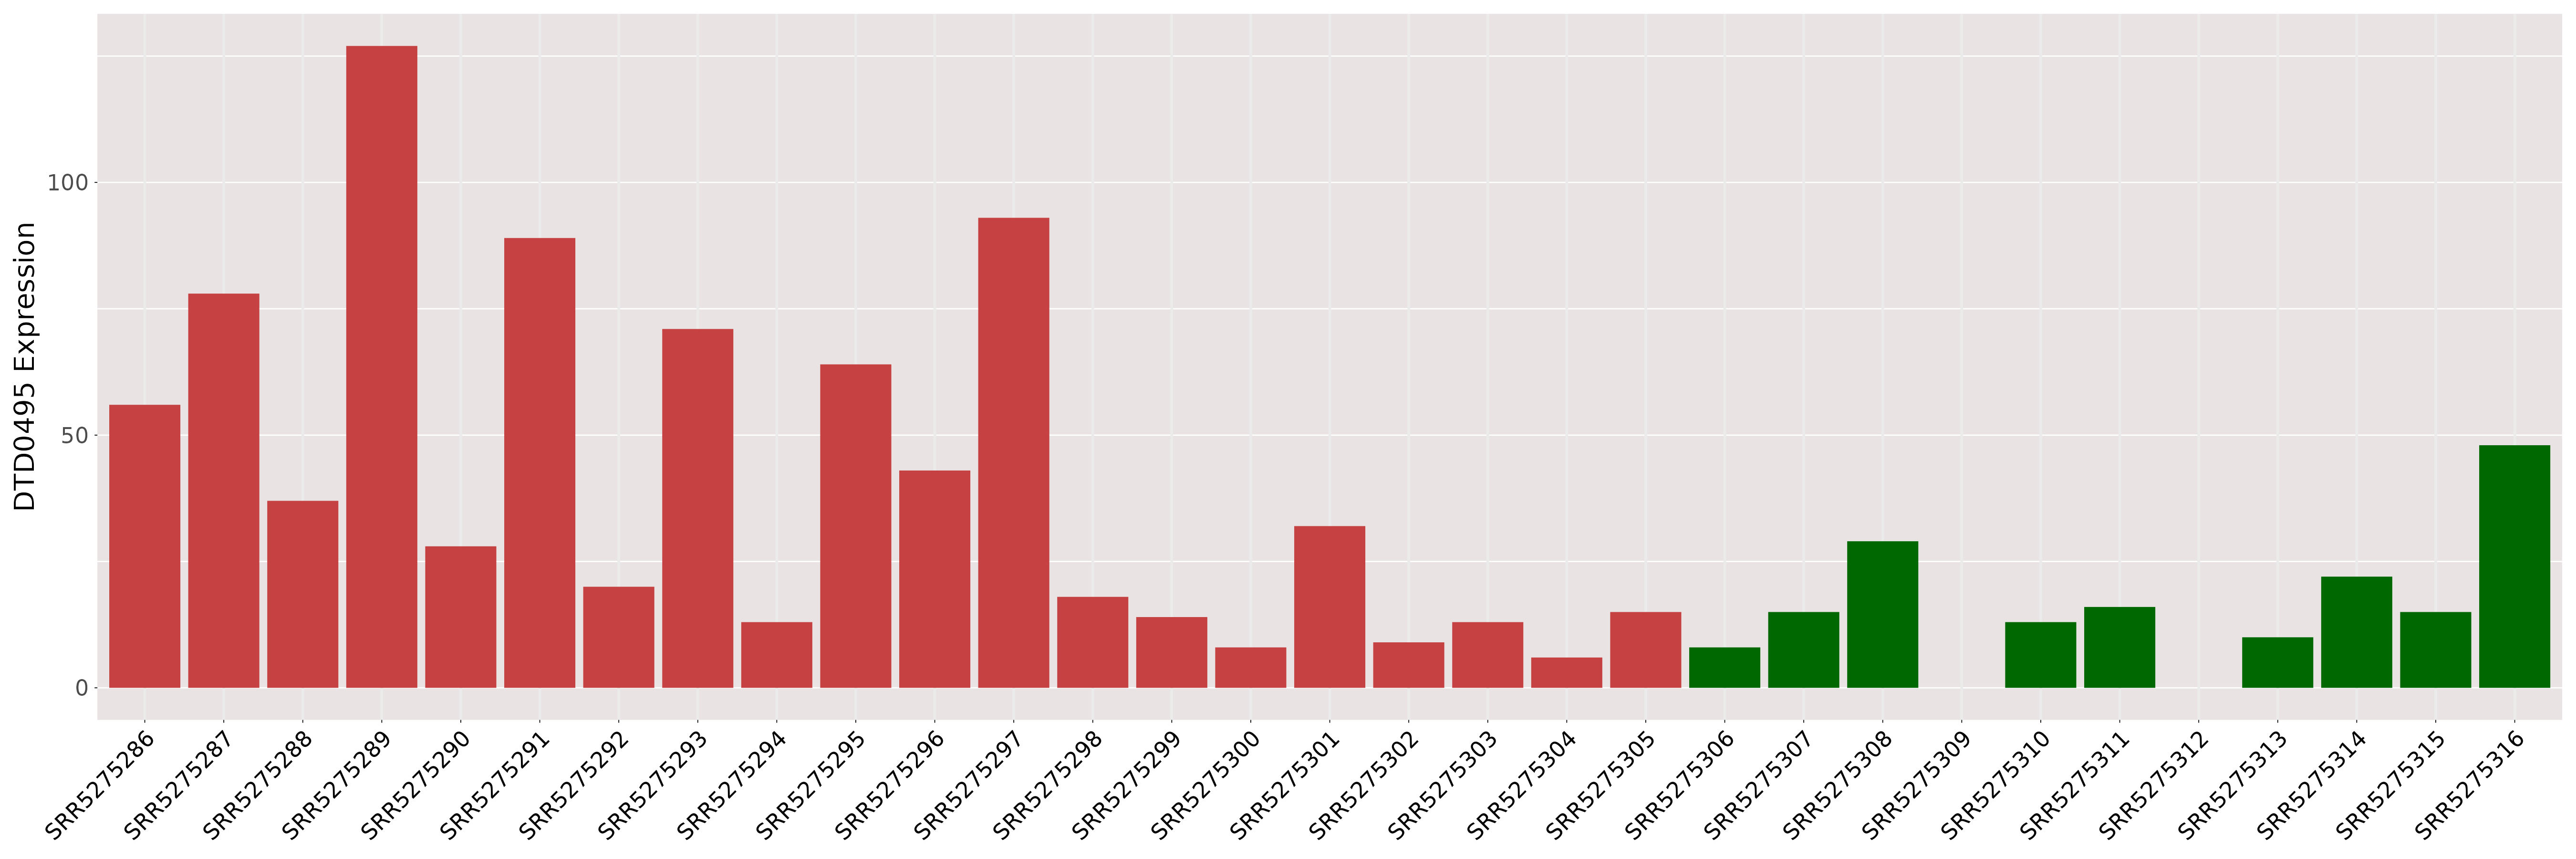
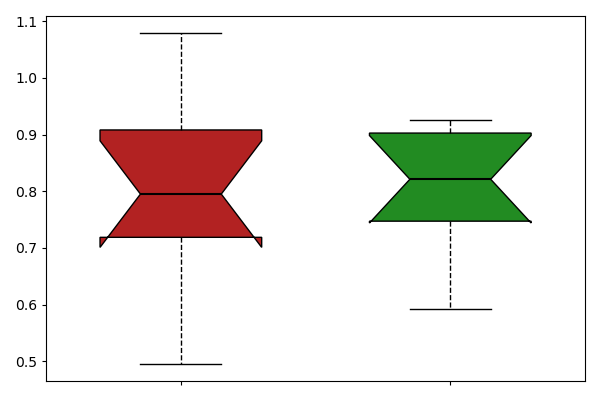
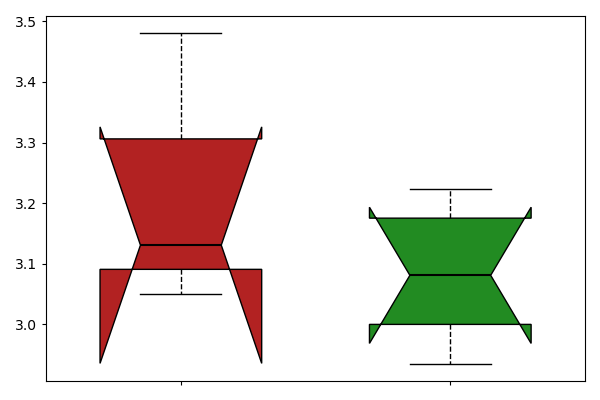
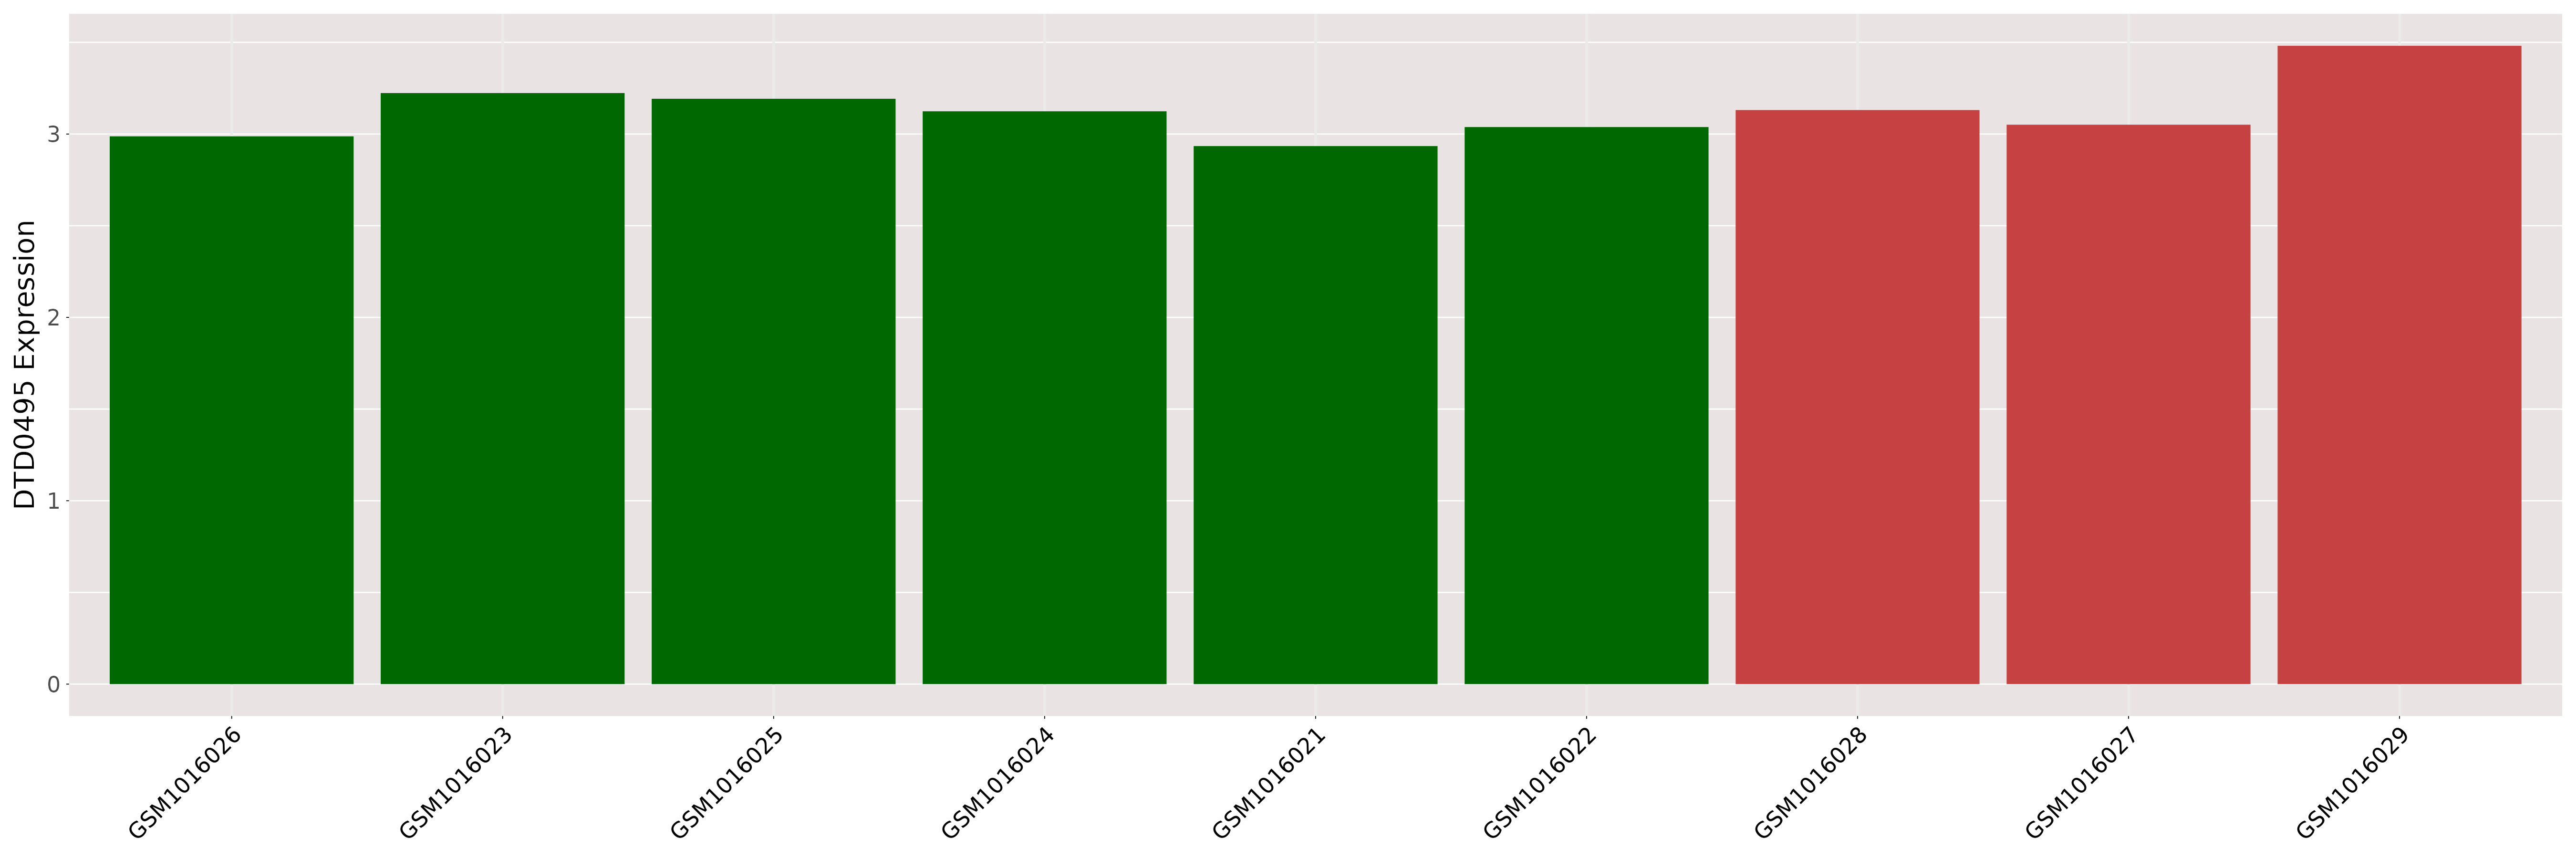
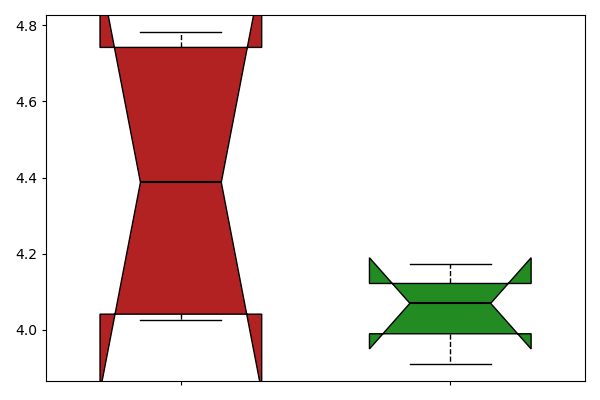
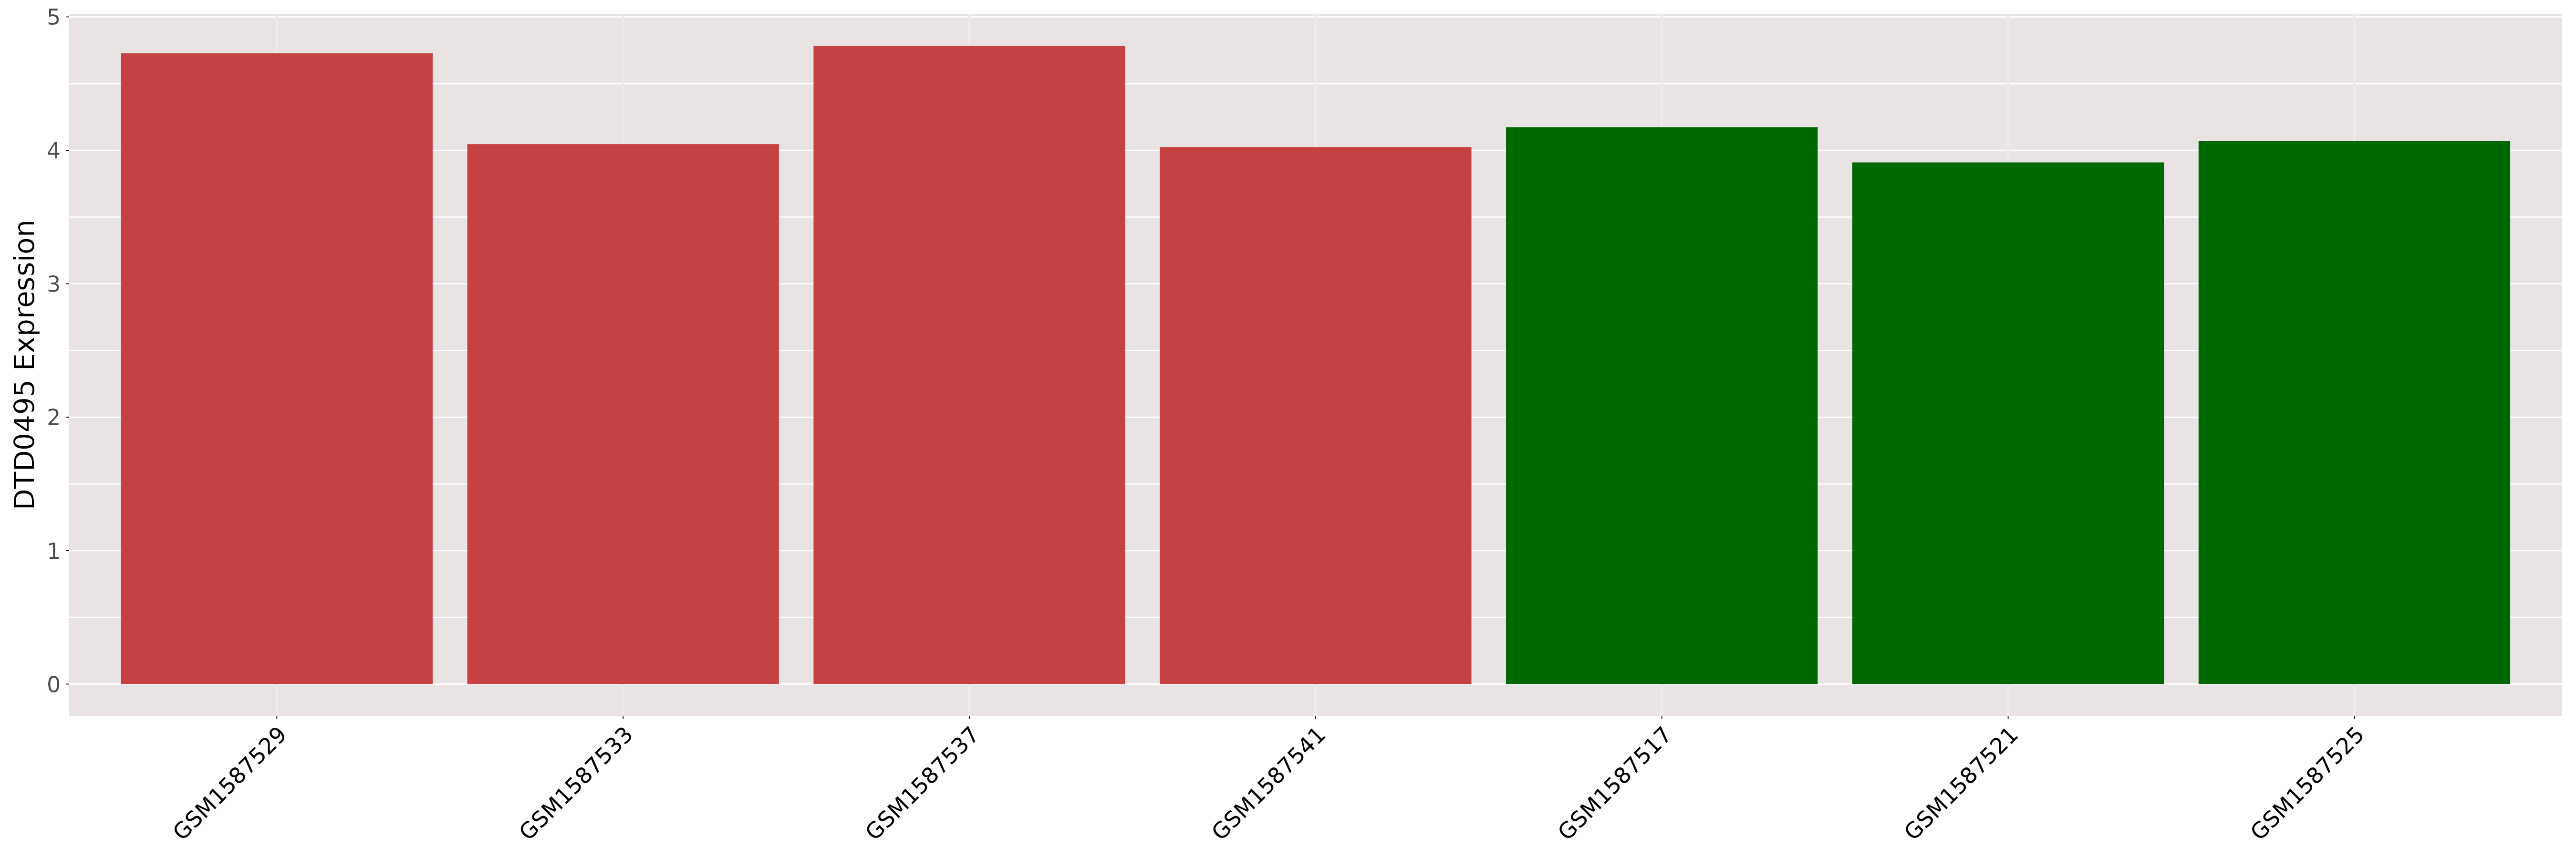
| [+] ICD-11: 2B91 Colorectal carcinoma (colorectal cancer) | Click to Show/Hide the Full List | ||||
| The Studied Tissue | Blood | ||||
| The Specified Disease | Colorectal cancer [ICD-11:2B91] | ||||
| The Expression Level of Disease Section Compare with the Healthy Individual Tissue | p-value:0.4660250188517414; Fold-change:1.046617419980184; Z-score:0.2768020087157672 | ||||
| DT expression in the diseased tissue of patients
DT expression in the normal tissue of healthy individuals
|
|||||
|
 Please Click the above Thumbnail to View/Download
the Expression Barchart for All Samples Please Click the above Thumbnail to View/Download
the Expression Barchart for All Samples
|
||||
| The Studied Tissue | Colon | ||||
| The Specified Disease | Colorectal cancer [ICD-11:2B91] | ||||
| The Expression Level of Disease Section Compare with the Healthy Individual Tissue | p-value:0.0263612045938273; Fold-change:2; Z-score:1.8884810539543968 | ||||
| DT expression in the diseased tissue of patients
DT expression in the normal tissue of healthy individuals
|
|||||
|
 Please Click the above Thumbnail to View/Download
the Expression Barchart for All Samples Please Click the above Thumbnail to View/Download
the Expression Barchart for All Samples
|
||||
| [+] ICD-11: 2C25 Malignant neoplasms of bronchus or lung | Click to Show/Hide the Full List | ||||
| The Studied Tissue | Saliva | ||||
| The Specified Disease | Lung cancer [ICD-11:2C25] | ||||
| The Expression Level of Disease Section Compare with the Healthy Individual Tissue | p-value:0.6126552004984385; Fold-change:0.9681525343504715; Z-score:-0.260676705 | ||||
| DT expression in the diseased tissue of patients
DT expression in the normal tissue of healthy individuals
|
|||||
|
 Please Click the above Thumbnail to View/Download
the Expression Barchart for All Samples Please Click the above Thumbnail to View/Download
the Expression Barchart for All Samples
|
||||
| [+] ICD-11: 2C25.0 Adenocarcinoma of bronchus or lung | Click to Show/Hide the Full List | ||||
| The Studied Tissue | Lung | ||||
| The Specified Disease | Lung adenocarcinoma [ICD-11:2C25] | ||||
| The Expression Level of Disease Section Compare with the Healthy Individual Tissue | p-value:4.741842668128437e-09; Fold-change:0.944752995772382; Z-score:-1.604311817 | ||||
| DT expression in the diseased tissue of patients
DT expression in the normal tissue of healthy individuals
|
|||||
|
 Please Click the above Thumbnail to View/Download
the Expression Barchart for All Samples Please Click the above Thumbnail to View/Download
the Expression Barchart for All Samples
|
||||
| [+] ICD-11: 2C25.0Z Non-small cell carcinoma of lung, unspecified | Click to Show/Hide the Full List | ||||
| The Studied Tissue | Lung | ||||
| The Specified Disease | Non small cell lung cancer [ICD-11:2C25] | ||||
| The Expression Level of Disease Section Compare with the Healthy Individual Tissue | p-value:0.714994314206156; Fold-change:1.003401320054298; Z-score:-0.07503923 | ||||
| DT expression in the diseased tissue of patients
DT expression in the normal tissue of healthy individuals
|
|||||
|
 Please Click the above Thumbnail to View/Download
the Expression Barchart for All Samples Please Click the above Thumbnail to View/Download
the Expression Barchart for All Samples
|
||||
| [+] ICD-11: 2C25.1 Small cell carcinoma of bronchus or lung | Click to Show/Hide the Full List | ||||
| The Studied Tissue | Lung | ||||
| The Specified Disease | Small cell lung carcinoma [ICD-11:2C25] | ||||
| The Expression Level of Disease Section Compare with the Healthy Individual Tissue | p-value:0.2575076342014094; Fold-change:2.75; Z-score:0.691352158577683 | ||||
| DT expression in the diseased tissue of patients
DT expression in the normal tissue of healthy individuals
|
|||||
|
 Please Click the above Thumbnail to View/Download
the Expression Barchart for All Samples Please Click the above Thumbnail to View/Download
the Expression Barchart for All Samples
|
||||
| [+] ICD-11: 2C31 Squamous cell carcinoma of skin | Click to Show/Hide the Full List | ||||
| The Studied Tissue | Skin | ||||
| The Specified Disease | Squamous cell carcinoma [ICD-11:2C31.Z] | ||||
| The Expression Level of Disease Section Compare with the Healthy Individual Tissue | p-value:0.0004350912792663; Fold-change:0.1308411214953271; Z-score:-2.046840279 | ||||
| DT expression in the diseased tissue of patients
DT expression in the normal tissue of healthy individuals
|
|||||

|
 Please Click the above Thumbnail to View/Download
the Expression Barchart for All Samples Please Click the above Thumbnail to View/Download
the Expression Barchart for All Samples
|
||||
| [+] ICD-11: 2C90 Malignant neoplasm of kidney, except renal pelvis (clear cell type) | Click to Show/Hide the Full List | ||||
| The Studied Tissue | Kidney | ||||
| The Specified Disease | Clear cell renal carcinomas [ICD-11:2C90] | ||||
| The Expression Level of Disease Section Compare with the Healthy Individual Tissue | p-value:0.5816471812681798; Fold-change:1.010899854354914; Z-score:0.2519494095479363 | ||||
| DT expression in the diseased tissue of patients
DT expression in the normal tissue of healthy individuals
|
|||||
|
|
|
||||
| [+] ICD-11: 2C90.0 Renal cell carcinoma of kidney, except renal pelvis (chromophobe type) | Click to Show/Hide the Full List | ||||
| The Studied Tissue | Kidney | ||||
| The Specified Disease | Chromophobe renal cell carcinoma [ICD-11:2C90.Y] | ||||
| The Expression Level of Disease Section Compare with the Healthy Individual Tissue | p-value:0.0323039835618827; Fold-change:1.0405213097969528; Z-score:5.970465015332116 | ||||
| DT expression in the diseased tissue of patients
DT expression in the normal tissue of healthy individuals
|
|||||
|
 Please Click the above Thumbnail to View/Download
the Expression Barchart for All Samples Please Click the above Thumbnail to View/Download
the Expression Barchart for All Samples
|
||||
| [+] ICD-11: 2C90.0 Renal cell carcinoma of kidney, except renal pelvis (papillary type) | Click to Show/Hide the Full List | ||||
| The Studied Tissue | Kidney | ||||
| The Specified Disease | Papillary renal cell carcinoma [ICD-11:2C90.Y] | ||||
| The Expression Level of Disease Section Compare with the Healthy Individual Tissue | p-value:0.391876045981175; Fold-change:1.0259028272421509; Z-score:3.919408235102872 | ||||
| DT expression in the diseased tissue of patients
DT expression in the normal tissue of healthy individuals
|
|||||
|
 Please Click the above Thumbnail to View/Download
the Expression Barchart for All Samples Please Click the above Thumbnail to View/Download
the Expression Barchart for All Samples
|
||||
| [+] ICD-11: 2C90.Y Nephroblastoma (Wilms tumor) | Click to Show/Hide the Full List | ||||
| The Studied Tissue | Kidney | ||||
| The Specified Disease | Nephroblastoma [ICD-11:2C90.Y] | ||||
| The Expression Level of Disease Section Compare with the Healthy Individual Tissue | p-value:0.0012920077420838; Fold-change:1.0834109801820235; Z-score:10.876725027221406 | ||||
| DT expression in the diseased tissue of patients
DT expression in the normal tissue of healthy individuals
|
|||||
|
 Please Click the above Thumbnail to View/Download
the Expression Barchart for All Samples Please Click the above Thumbnail to View/Download
the Expression Barchart for All Samples
|
||||
| [+] ICD-11: 2C94.2 Urothelial carcinoma of bladder | Click to Show/Hide the Full List | ||||
| The Studied Tissue | Bladder | ||||
| The Specified Disease | Urothelial carcinoma [ICD-11:2C94.2] | ||||
| The Expression Level of Disease Section Compare with the Healthy Individual Tissue | p-value:0.0414803514996416; Fold-change:1.0476877310059614; Z-score:1.4529866414543129 | ||||
| DT expression in the diseased tissue of patients
DT expression in the normal tissue of healthy individuals
|
|||||
|
 Please Click the above Thumbnail to View/Download
the Expression Barchart for All Samples Please Click the above Thumbnail to View/Download
the Expression Barchart for All Samples
|
||||
| [+] ICD-11: 2E86.0 Leiomyoma of uterus (uterine fibroid) | Click to Show/Hide the Full List | ||||
| The Studied Tissue | Uterus | ||||
| The Specified Disease | Uterine fibroid [ICD-11:2E86.0] | ||||
| The Expression Level of Disease Section Compare with the Healthy Individual Tissue | p-value:0.2533688919508331; Fold-change:1.0161590787696222; Z-score:1.1928353985644065 | ||||
| DT expression in the diseased tissue of patients
DT expression in the normal tissue of healthy individuals
|
|||||
|
 Please Click the above Thumbnail to View/Download
the Expression Barchart for All Samples Please Click the above Thumbnail to View/Download
the Expression Barchart for All Samples
|
||||
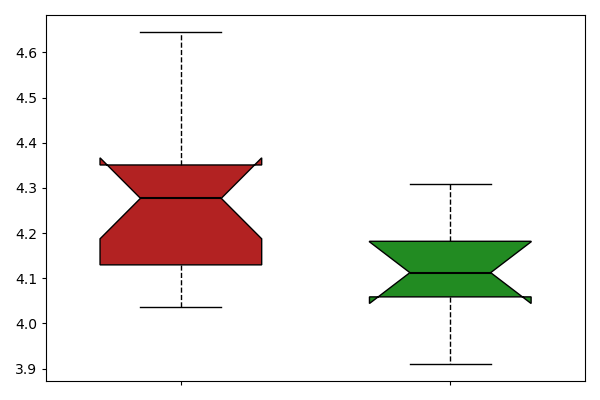
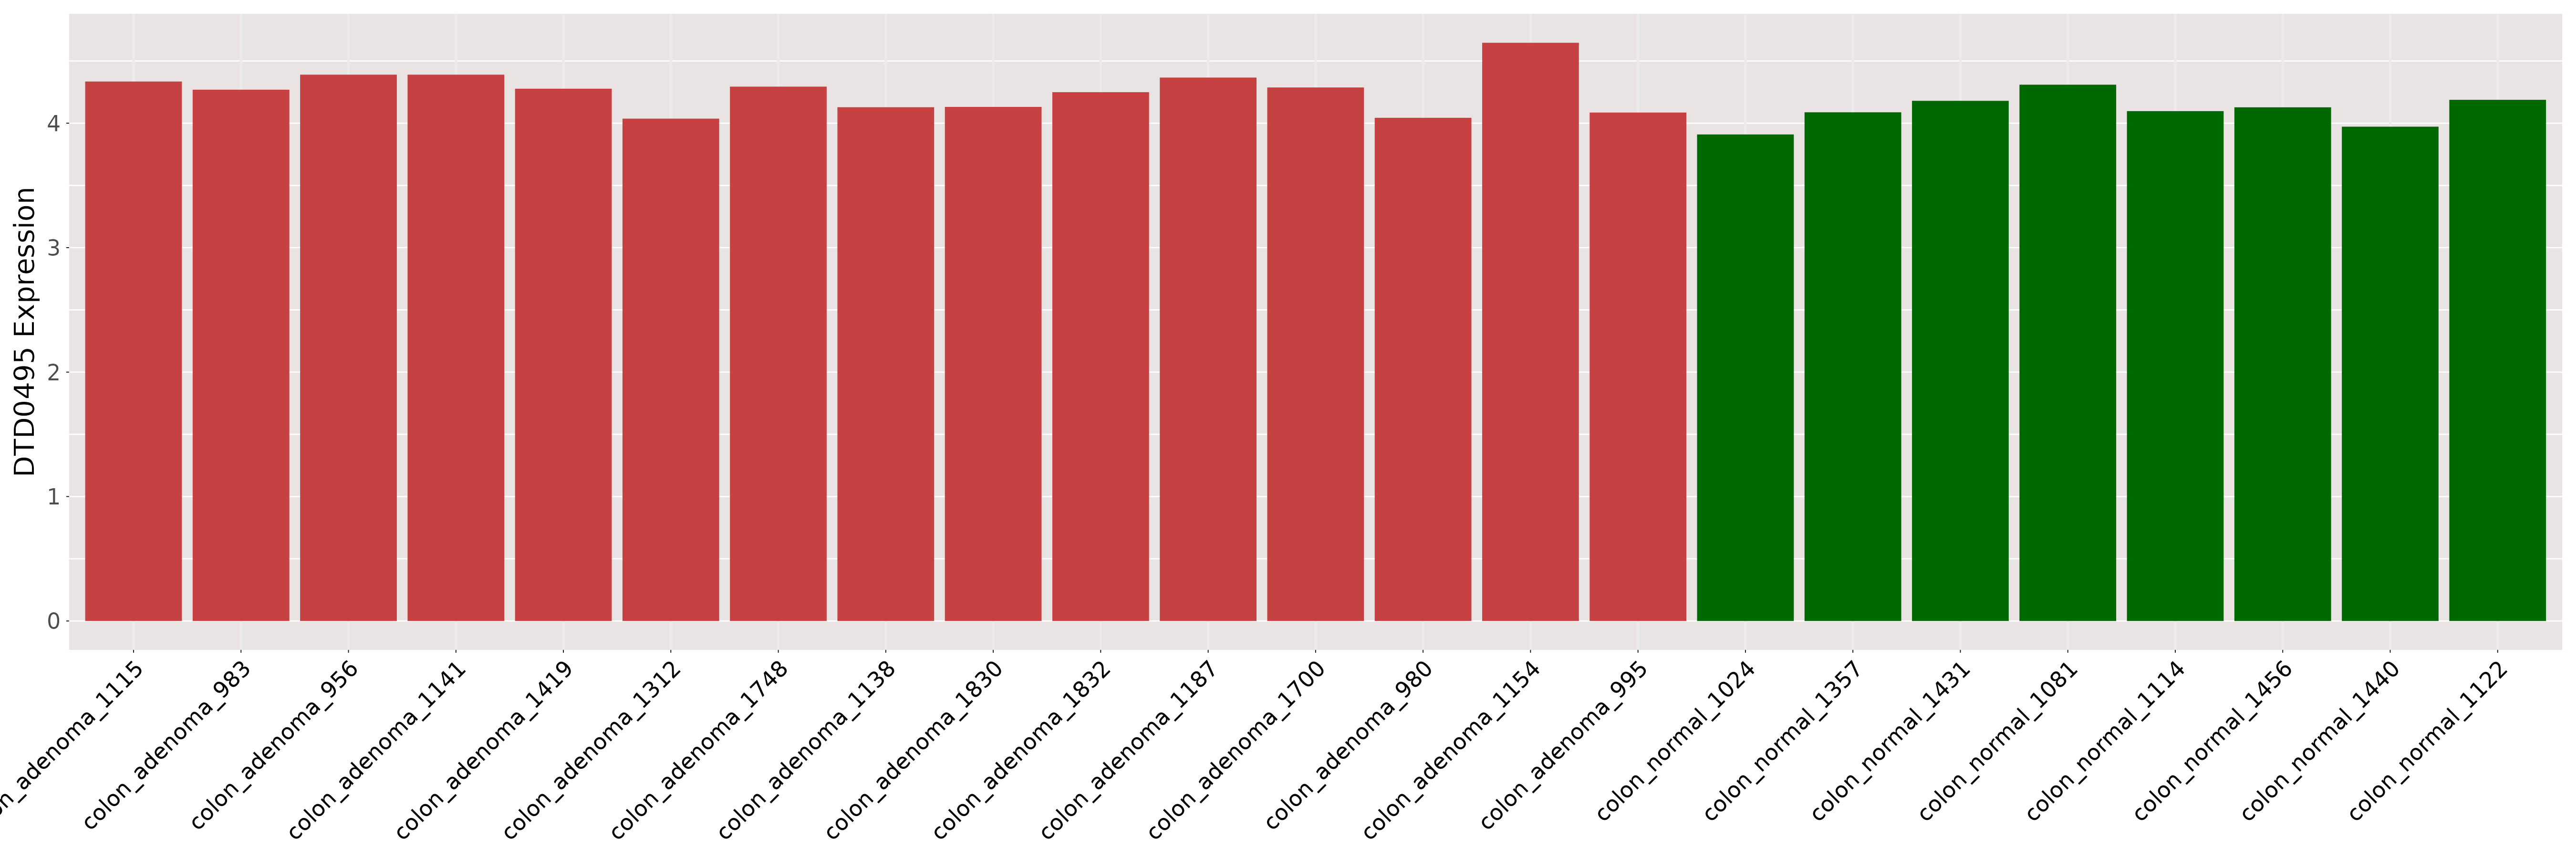
| [+] ICD-11: 2F32.0 Adenoma of colon (benign colon polyp) | Click to Show/Hide the Full List | ||||
| The Studied Tissue | Colon | ||||
| The Specified Disease | Colon adenoma [ICD-11:2F32.0] | ||||
| The Expression Level of Disease Section Compare with the Healthy Individual Tissue | p-value:0.0300740919927055; Fold-change:1.0400376665738913; Z-score:1.2164257862733374 | ||||
| DT expression in the diseased tissue of patients
DT expression in the normal tissue of healthy individuals
|
|||||
|
 Please Click the above Thumbnail to View/Download
the Expression Barchart for All Samples Please Click the above Thumbnail to View/Download
the Expression Barchart for All Samples
|
||||
| [+] ICD-11: 2F92 Benign neoplasm of kidney (renal oncocytoma) | Click to Show/Hide the Full List | ||||
| The Studied Tissue | Kidney | ||||
| The Specified Disease | Kidney oncocytoma [ICD-11:2F92] | ||||
| The Expression Level of Disease Section Compare with the Healthy Individual Tissue | p-value:0.1454052683846335; Fold-change:1.0473488745503037; Z-score:8.45604566639779 | ||||
| DT expression in the diseased tissue of patients
DT expression in the normal tissue of healthy individuals
|
|||||
|
 Please Click the above Thumbnail to View/Download
the Expression Barchart for All Samples Please Click the above Thumbnail to View/Download
the Expression Barchart for All Samples
|
||||
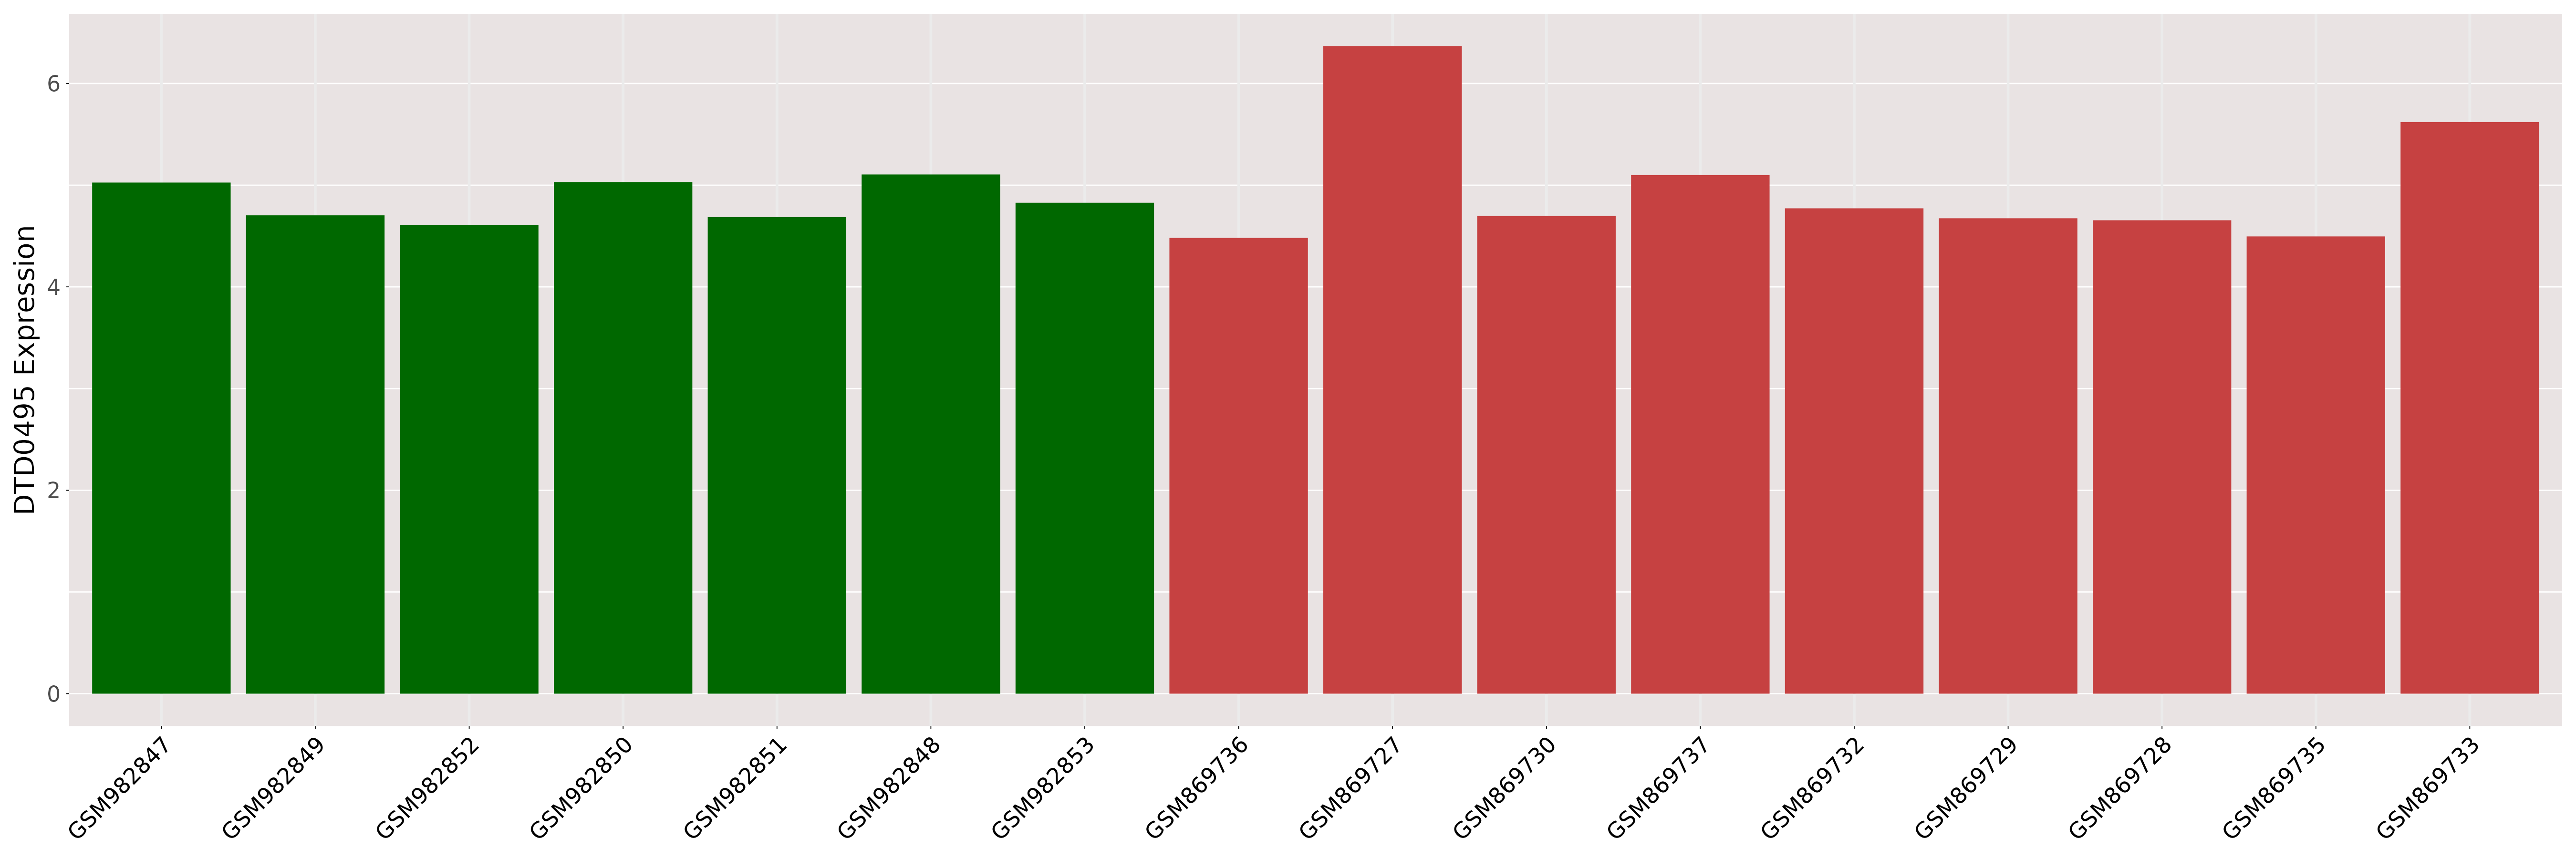
| ICD-11: 04 Disease of the immune system | |||||
| [+] ICD-11: 4B20 Sarcoidosis | Click to Show/Hide the Full List | ||||
| The Studied Tissue | Lung | ||||
| The Specified Disease | Sarcoidosis [ICD-11:4B20] | ||||
| The Expression Level of Disease Section Compare with the Healthy Individual Tissue | p-value:0.8459750573895717; Fold-change:1.0089705263891149; Z-score:-0.100856477 | ||||
| DT expression in the diseased tissue of patients
DT expression in the normal tissue of healthy individuals
|
|||||
|
 Please Click the above Thumbnail to View/Download
the Expression Barchart for All Samples Please Click the above Thumbnail to View/Download
the Expression Barchart for All Samples
|
||||
| ICD-11: 05 Endocrine, nutritional or metabolic disease | |||||
| [+] ICD-11: 5A11 Type 2 diabetes mellitus | Click to Show/Hide the Full List | ||||
| The Studied Tissue | Skeletal muscle | ||||
| The Specified Disease | Type 2 diabetes [ICD-11:5A11] | ||||
| The Expression Level of Disease Section Compare with the Healthy Individual Tissue | p-value:0.7690916879564225; Fold-change:0.9992143615556328; Z-score:-0.139363471 | ||||
| DT expression in the diseased tissue of patients
DT expression in the normal tissue of healthy individuals
|
|||||

|
 Please Click the above Thumbnail to View/Download
the Expression Barchart for All Samples Please Click the above Thumbnail to View/Download
the Expression Barchart for All Samples
|
||||
| The Studied Tissue | Islet of langerhans | ||||
| The Specified Disease | Type ii diabetes mellitus [ICD-11:5A11] | ||||
| The Expression Level of Disease Section Compare with the Healthy Individual Tissue | p-value:0.0372129433897918; Fold-change:0.74; Z-score:-4.185789452 | ||||
| DT expression in the diseased tissue of patients
DT expression in the normal tissue of healthy individuals
|
|||||

|
 Please Click the above Thumbnail to View/Download
the Expression Barchart for All Samples Please Click the above Thumbnail to View/Download
the Expression Barchart for All Samples
|
||||
| [+] ICD-11: 5A14 Diabetes mellitus, type unspecified | Click to Show/Hide the Full List | ||||
| The Studied Tissue | Skeletal muscle | ||||
| The Specified Disease | Diabetes mellitus [ICD-11:5A14] | ||||
| The Expression Level of Disease Section Compare with the Healthy Individual Tissue | p-value:0.0612055101571352; Fold-change:1.1023981783567158; Z-score:1.194541214061085 | ||||
| DT expression in the diseased tissue of patients
DT expression in the normal tissue of healthy individuals
|
|||||
|
 Please Click the above Thumbnail to View/Download
the Expression Barchart for All Samples Please Click the above Thumbnail to View/Download
the Expression Barchart for All Samples
|
||||
| [+] ICD-11: 5C50.E0 Classical organic aciduria (Methylmalonic acidemia) | Click to Show/Hide the Full List | ||||
| The Studied Tissue | Kidney | ||||
| The Specified Disease | Methylmalonic acidemia [ICD-11:5C50.E0] | ||||
| The Expression Level of Disease Section Compare with the Healthy Individual Tissue | p-value:0.0726155484853289; Fold-change:1.0780213377908638; Z-score:6.126730456157264 | ||||
| DT expression in the diseased tissue of patients
DT expression in the normal tissue of healthy individuals
|
|||||
|
 Please Click the above Thumbnail to View/Download
the Expression Barchart for All Samples Please Click the above Thumbnail to View/Download
the Expression Barchart for All Samples
|
||||
| [+] ICD-11: 5C57.1 X-linked adrenoleukodystrophy | Click to Show/Hide the Full List | ||||
| The Studied Tissue | Dermis | ||||
| The Specified Disease | X linked cerebral adrenoleukodystrophy [ICD-11:5C57.1] | ||||
| The Expression Level of Disease Section Compare with the Healthy Individual Tissue | p-value:0.3713005338298136; Fold-change:0.9585158103613386; Z-score:-0.664000254 | ||||
| DT expression in the diseased tissue of patients
DT expression in the normal tissue of healthy individuals
|
|||||
|
 Please Click the above Thumbnail to View/Download
the Expression Barchart for All Samples Please Click the above Thumbnail to View/Download
the Expression Barchart for All Samples
|
||||
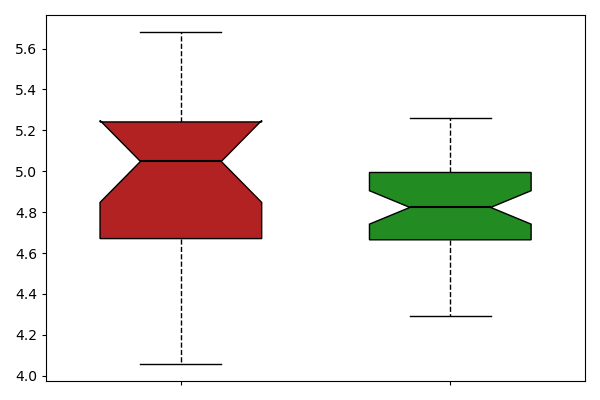
| ICD-11: 06 Mental, behavioural or neurodevelopmental disorder | |||||
| [+] ICD-11: 6A02 Autism spectrum disorder | Click to Show/Hide the Full List | ||||
| The Studied Tissue | Brain | ||||
| The Specified Disease | Autism [ICD-11:6A02] | ||||
| The Expression Level of Disease Section Compare with the Healthy Individual Tissue | p-value:0.0798868381012175; Fold-change:0.5555555555555556; Z-score:-1.703399556 | ||||
| DT expression in the diseased tissue of patients
DT expression in the normal tissue of healthy individuals
|
|||||
|
 Please Click the above Thumbnail to View/Download
the Expression Barchart for All Samples Please Click the above Thumbnail to View/Download
the Expression Barchart for All Samples
|
||||
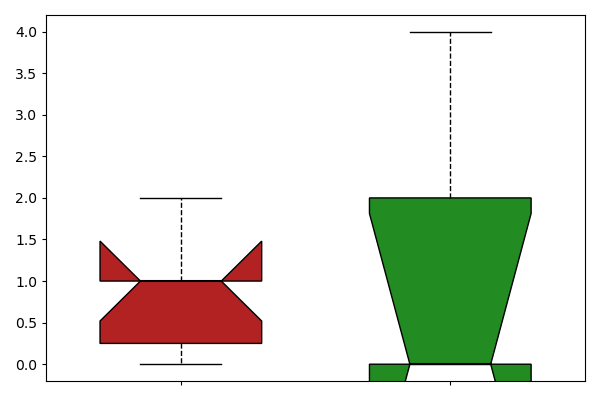
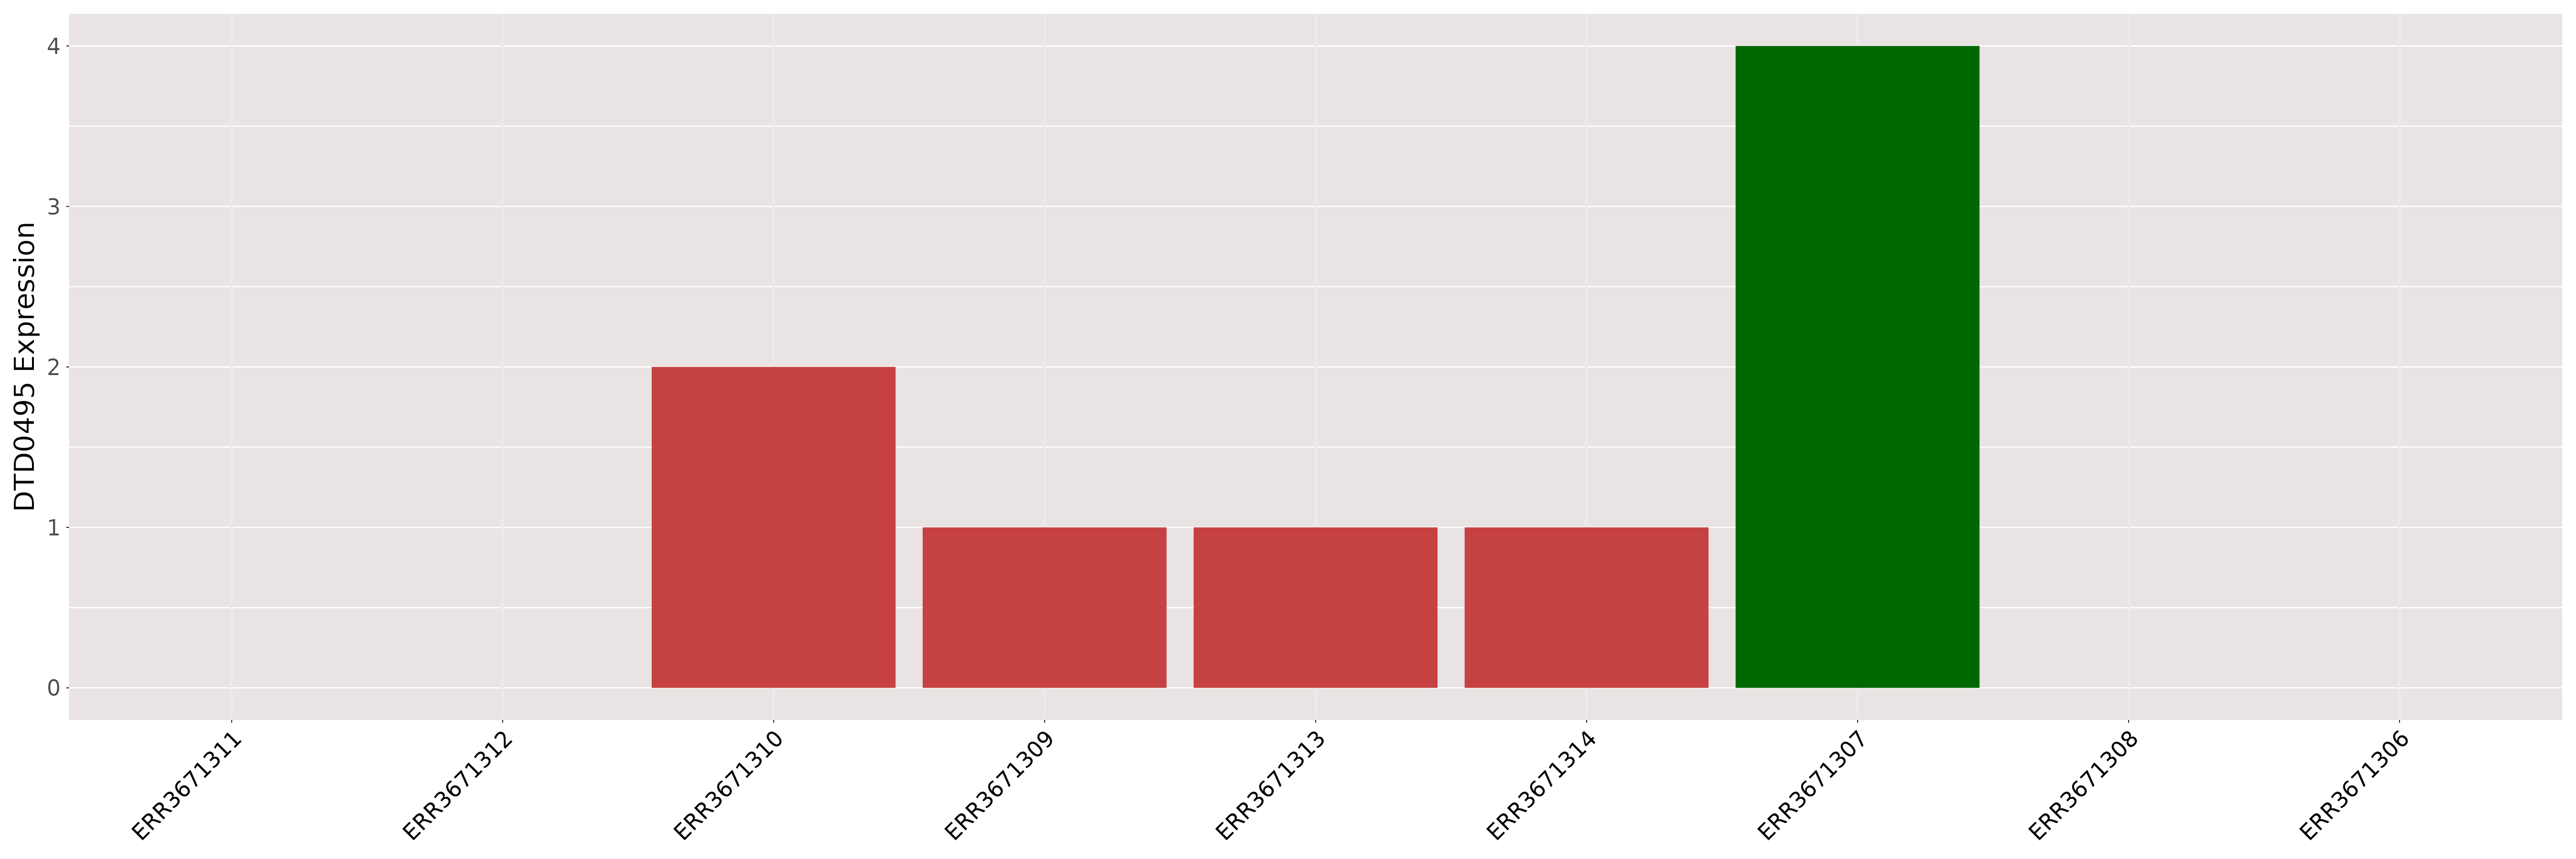
| [+] ICD-11: 6A20 Schizophrenia | Click to Show/Hide the Full List | ||||
| The Studied Tissue | Brodmann (1909) area 9 | ||||
| The Specified Disease | Schizophrenia [ICD-11:6A20] | ||||
| The Expression Level of Disease Section Compare with the Healthy Individual Tissue | p-value:0.200868560867043; Fold-change:1.5; Z-score:0.7071067811865475 | ||||
| DT expression in the diseased tissue of patients
DT expression in the normal tissue of healthy individuals
|
|||||
_area_9-1.png)
|
_area_9.png) Please Click the above Thumbnail to View/Download
the Expression Barchart for All Samples Please Click the above Thumbnail to View/Download
the Expression Barchart for All Samples
|
||||
| The Studied Tissue | Brodmann (1909) area 11 | ||||
| The Specified Disease | Schizophrenia [ICD-11:6A20] | ||||
| The Expression Level of Disease Section Compare with the Healthy Individual Tissue | p-value:0.4467486613512972; Fold-change:2; Z-score:0.3154466340720224 | ||||
| DT expression in the diseased tissue of patients
DT expression in the normal tissue of healthy individuals
|
|||||
_area_11-1.png)
|
_area_11.png) Please Click the above Thumbnail to View/Download
the Expression Barchart for All Samples Please Click the above Thumbnail to View/Download
the Expression Barchart for All Samples
|
||||
| The Studied Tissue | Brodmann (1909) area 24 | ||||
| The Specified Disease | Schizophrenia [ICD-11:6A20] | ||||
| The Expression Level of Disease Section Compare with the Healthy Individual Tissue | p-value:0.1008920870479403; Fold-change:1.75; Z-score:1.356127007241621 | ||||
| DT expression in the diseased tissue of patients
DT expression in the normal tissue of healthy individuals
|
|||||
_area_24-1.png)
|
_area_24.png) Please Click the above Thumbnail to View/Download
the Expression Barchart for All Samples Please Click the above Thumbnail to View/Download
the Expression Barchart for All Samples
|
||||
| [+] ICD-11: 6A60 Bipolar type I disorder (Bipolar disorder) | Click to Show/Hide the Full List | ||||
| The Studied Tissue | Brodmann (1909) area 9 | ||||
| The Specified Disease | Bipolar disorder [ICD-11:6A60] | ||||
| The Expression Level of Disease Section Compare with the Healthy Individual Tissue | p-value:0.7198952696616141; Fold-change:1.5; Z-score:0.202030508910442 | ||||
| DT expression in the diseased tissue of patients
DT expression in the normal tissue of healthy individuals
|
|||||
_area_9-1.png)
|
_area_9.png) Please Click the above Thumbnail to View/Download
the Expression Barchart for All Samples Please Click the above Thumbnail to View/Download
the Expression Barchart for All Samples
|
||||
| The Studied Tissue | Brodmann (1909) area 11 | ||||
| The Specified Disease | Bipolar disorder [ICD-11:6A60] | ||||
| The Expression Level of Disease Section Compare with the Healthy Individual Tissue | p-value:0.2906654432502134; Fold-change:2; Z-score:0.4301545010073033 | ||||
| DT expression in the diseased tissue of patients
DT expression in the normal tissue of healthy individuals
|
|||||
_area_11-1.png)
|
_area_11.png) Please Click the above Thumbnail to View/Download
the Expression Barchart for All Samples Please Click the above Thumbnail to View/Download
the Expression Barchart for All Samples
|
||||
| The Studied Tissue | Brodmann (1909) area 24 | ||||
| The Specified Disease | Bipolar disorder [ICD-11:6A60] | ||||
| The Expression Level of Disease Section Compare with the Healthy Individual Tissue | p-value:0.5174394863789545; Fold-change:0.5; Z-score:-0.46011452 | ||||
| DT expression in the diseased tissue of patients
DT expression in the normal tissue of healthy individuals
|
|||||
_area_24-1.png)
|
_area_24.png) Please Click the above Thumbnail to View/Download
the Expression Barchart for All Samples Please Click the above Thumbnail to View/Download
the Expression Barchart for All Samples
|
||||
| The Studied Tissue | Dorsolateral prefrontal cortex | ||||
| The Specified Disease | Bipolar disorder [ICD-11:6A60] | ||||
| The Expression Level of Disease Section Compare with the Healthy Individual Tissue | p-value:0.7608392382641901; Fold-change:0.8571428571428571; Z-score:0.0856424480807517 | ||||
| DT expression in the diseased tissue of patients
DT expression in the normal tissue of healthy individuals
|
|||||

|
 Please Click the above Thumbnail to View/Download
the Expression Barchart for All Samples Please Click the above Thumbnail to View/Download
the Expression Barchart for All Samples
|
||||
| ICD-11: 08 Disease of the nervous system | |||||
| [+] ICD-11: 8A20 Alzheimer disease | Click to Show/Hide the Full List | ||||
| The Studied Tissue | Frontal cortex | ||||
| The Specified Disease | Alzheimer's disease [ICD-11:8A20] | ||||
| The Expression Level of Disease Section Compare with the Healthy Individual Tissue | p-value:0.5555559738163869; Fold-change:1.0041279549685047; Z-score:0.2886601720441277 | ||||
| DT expression in the diseased tissue of patients
DT expression in the normal tissue of healthy individuals
|
|||||
|
 Please Click the above Thumbnail to View/Download
the Expression Barchart for All Samples Please Click the above Thumbnail to View/Download
the Expression Barchart for All Samples
|
||||
| The Studied Tissue | Hippocampus | ||||
| The Specified Disease | Alzheimer's disease [ICD-11:8A20] | ||||
| The Expression Level of Disease Section Compare with the Healthy Individual Tissue | p-value:0.0433877104780449; Fold-change:1.0193018214352467; Z-score:1.1458104314316124 | ||||
| DT expression in the diseased tissue of patients
DT expression in the normal tissue of healthy individuals
|
|||||
|
 Please Click the above Thumbnail to View/Download
the Expression Barchart for All Samples Please Click the above Thumbnail to View/Download
the Expression Barchart for All Samples
|
||||
| The Studied Tissue | Middle temporal gyrus | ||||
| The Specified Disease | Alzheimer's disease [ICD-11:8A20] | ||||
| The Expression Level of Disease Section Compare with the Healthy Individual Tissue | p-value:0.5438594695797895; Fold-change:0.9948080776428894; Z-score:-0.286967592 | ||||
| DT expression in the diseased tissue of patients
DT expression in the normal tissue of healthy individuals
|
|||||
|
 Please Click the above Thumbnail to View/Download
the Expression Barchart for All Samples Please Click the above Thumbnail to View/Download
the Expression Barchart for All Samples
|
||||
| The Studied Tissue | Postcentral gyrus | ||||
| The Specified Disease | Alzheimer's disease [ICD-11:8A20] | ||||
| The Expression Level of Disease Section Compare with the Healthy Individual Tissue | p-value:0.5178802504856747; Fold-change:1.0010275907423996; Z-score:-0.146425955 | ||||
| DT expression in the diseased tissue of patients
DT expression in the normal tissue of healthy individuals
|
|||||
|
 Please Click the above Thumbnail to View/Download
the Expression Barchart for All Samples Please Click the above Thumbnail to View/Download
the Expression Barchart for All Samples
|
||||
| The Studied Tissue | Posterior cingulate cortex | ||||
| The Specified Disease | Alzheimer's disease [ICD-11:8A20] | ||||
| The Expression Level of Disease Section Compare with the Healthy Individual Tissue | p-value:0.0606582983964111; Fold-change:1.058655892730949; Z-score:1.0015027939977894 | ||||
| DT expression in the diseased tissue of patients
DT expression in the normal tissue of healthy individuals
|
|||||

|
 Please Click the above Thumbnail to View/Download
the Expression Barchart for All Samples Please Click the above Thumbnail to View/Download
the Expression Barchart for All Samples
|
||||
| The Studied Tissue | Primary visual cortex | ||||
| The Specified Disease | Alzheimer's disease [ICD-11:8A20] | ||||
| The Expression Level of Disease Section Compare with the Healthy Individual Tissue | p-value:0.1599958108748876; Fold-change:1.0556079062686543; Z-score:0.540524488620755 | ||||
| DT expression in the diseased tissue of patients
DT expression in the normal tissue of healthy individuals
|
|||||
|
 Please Click the above Thumbnail to View/Download
the Expression Barchart for All Samples Please Click the above Thumbnail to View/Download
the Expression Barchart for All Samples
|
||||
| The Studied Tissue | Superior frontal gyrus | ||||
| The Specified Disease | Alzheimer's disease [ICD-11:8A20] | ||||
| The Expression Level of Disease Section Compare with the Healthy Individual Tissue | p-value:0.0094192950601562; Fold-change:0.9550042006779113; Z-score:-0.703203561 | ||||
| DT expression in the diseased tissue of patients
DT expression in the normal tissue of healthy individuals
|
|||||
|
 Please Click the above Thumbnail to View/Download
the Expression Barchart for All Samples Please Click the above Thumbnail to View/Download
the Expression Barchart for All Samples
|
||||
| The Studied Tissue | Temporal cortex | ||||
| The Specified Disease | Alzheimer's disease [ICD-11:8A20] | ||||
| The Expression Level of Disease Section Compare with the Healthy Individual Tissue | p-value:0.3681073137816031; Fold-change:1.0194900778741216; Z-score:0.3449438872047369 | ||||
| DT expression in the diseased tissue of patients
DT expression in the normal tissue of healthy individuals
|
|||||
|
 Please Click the above Thumbnail to View/Download
the Expression Barchart for All Samples Please Click the above Thumbnail to View/Download
the Expression Barchart for All Samples
|
||||
| [+] ICD-11: 8C70.3 Facioscapulohumeral muscular dystrophy | Click to Show/Hide the Full List | ||||
| The Studied Tissue | Muscle | ||||
| The Specified Disease | Facioscapulohumeral dystrophy [ICD-11:8C70.3] | ||||
| The Expression Level of Disease Section Compare with the Healthy Individual Tissue | p-value:0.8789677228498258; Fold-change:1; Z-score:0.063277199716833 | ||||
| DT expression in the diseased tissue of patients
DT expression in the normal tissue of healthy individuals
|
|||||
|
 Please Click the above Thumbnail to View/Download
the Expression Barchart for All Samples Please Click the above Thumbnail to View/Download
the Expression Barchart for All Samples
|
||||
| The Studied Tissue | Myoblast | ||||
| The Specified Disease | Facioscapulohumeral dystrophy [ICD-11:8C70.3] | ||||
| The Expression Level of Disease Section Compare with the Healthy Individual Tissue | p-value:0.6086097624160389; Fold-change:1.0288461538461535; Z-score:2.062394778460764 | ||||
| DT expression in the diseased tissue of patients
DT expression in the normal tissue of healthy individuals
|
|||||
|
 Please Click the above Thumbnail to View/Download
the Expression Barchart for All Samples Please Click the above Thumbnail to View/Download
the Expression Barchart for All Samples
|
||||
| The Studied Tissue | Myotube | ||||
| The Specified Disease | Facioscapulohumeral dystrophy [ICD-11:8C70.3] | ||||
| The Expression Level of Disease Section Compare with the Healthy Individual Tissue | p-value:0.5153194119090547; Fold-change:1.2333333333333334; Z-score:0.6686128845369127 | ||||
| DT expression in the diseased tissue of patients
DT expression in the normal tissue of healthy individuals
|
|||||
|
 Please Click the above Thumbnail to View/Download
the Expression Barchart for All Samples Please Click the above Thumbnail to View/Download
the Expression Barchart for All Samples
|
||||
| [+] ICD-11: 8C71.0 Myotonic dystrophy | Click to Show/Hide the Full List | ||||
| The Studied Tissue | Heart left ventricle | ||||
| The Specified Disease | Myotonic dystrophy [ICD-11:8C71.0] | ||||
| The Expression Level of Disease Section Compare with the Healthy Individual Tissue | p-value:0.3314104823046506; Fold-change:1.2307692307692308; Z-score:3.214550253664319 | ||||
| DT expression in the diseased tissue of patients
DT expression in the normal tissue of healthy individuals
|
|||||
|
 Please Click the above Thumbnail to View/Download
the Expression Barchart for All Samples Please Click the above Thumbnail to View/Download
the Expression Barchart for All Samples
|
||||
| ICD-11: 11 Disease of the circulatory system | |||||
| [+] ICD-11: BD10 Congestive heart failure | Click to Show/Hide the Full List | ||||
| The Studied Tissue | Skeletal muscle tissue | ||||
| The Specified Disease | Heart failure [ICD-11:BD10] | ||||
| The Expression Level of Disease Section Compare with the Healthy Individual Tissue | p-value:0.62628326604861; Fold-change:inf; Z-score:-0.216506351 | ||||
| DT expression in the diseased tissue of patients
DT expression in the normal tissue of healthy individuals
|
|||||
|
 Please Click the above Thumbnail to View/Download
the Expression Barchart for All Samples Please Click the above Thumbnail to View/Download
the Expression Barchart for All Samples
|
||||
| [+] ICD-11: BD10 Congestive heart failure (post-ischemic) | Click to Show/Hide the Full List | ||||
| The Studied Tissue | Left ventricle | ||||
| The Specified Disease | Post ischemic heart failure [ICD-11:BD10] | ||||
| The Expression Level of Disease Section Compare with the Healthy Individual Tissue | p-value:0.0072726479429669; Fold-change:1.1014053956954086; Z-score:3.724323464044436 | ||||
| DT expression in the diseased tissue of patients
DT expression in the normal tissue of healthy individuals
|
|||||
|
 Please Click the above Thumbnail to View/Download
the Expression Barchart for All Samples Please Click the above Thumbnail to View/Download
the Expression Barchart for All Samples
|
||||
| ICD-11: 13 Disease of the digestive system | |||||
| [+] ICD-11: DB91 Acute or subacute hepatic failure | Click to Show/Hide the Full List | ||||
| The Studied Tissue | Liver | ||||
| The Specified Disease | Acute liver failure [ICD-11:DB91.Z] | ||||
| The Expression Level of Disease Section Compare with the Healthy Individual Tissue | p-value:0.0007564544250627; Fold-change:0.944367537691254; Z-score:-1.605336746 | ||||
| DT expression in the diseased tissue of patients
DT expression in the normal tissue of healthy individuals
|
|||||
|
 Please Click the above Thumbnail to View/Download
the Expression Barchart for All Samples Please Click the above Thumbnail to View/Download
the Expression Barchart for All Samples
|
||||
| [+] ICD-11: DB92.1 Non-alcoholic steatohepatitis | Click to Show/Hide the Full List | ||||
| The Studied Tissue | Liver | ||||
| The Specified Disease | Non alcoholic steatohepatitis [ICD-11:DB92.1] | ||||
| The Expression Level of Disease Section Compare with the Healthy Individual Tissue | p-value:0.1770275351158502; Fold-change:1.028490443707762; Z-score:0.7422693535593421 | ||||
| DT expression in the diseased tissue of patients
DT expression in the normal tissue of healthy individuals
|
|||||
|
 Please Click the above Thumbnail to View/Download
the Expression Barchart for All Samples Please Click the above Thumbnail to View/Download
the Expression Barchart for All Samples
|
||||
| [+] ICD-11: DD70 Crohn disease | Click to Show/Hide the Full List | ||||
| The Studied Tissue | Ileum | ||||
| The Specified Disease | Crohn's disease [ICD-11:DD70.Z] | ||||
| The Expression Level of Disease Section Compare with the Healthy Individual Tissue | p-value:0.7202674439631054; Fold-change:1; Z-score:0.0730331443897023 | ||||
| DT expression in the diseased tissue of patients
DT expression in the normal tissue of healthy individuals
|
|||||
|
 Please Click the above Thumbnail to View/Download
the Expression Barchart for All Samples Please Click the above Thumbnail to View/Download
the Expression Barchart for All Samples
|
||||
| The Studied Tissue | Colonic mucosa | ||||
| The Specified Disease | Crohn's disease [ICD-11:DD70.Z] | ||||
| The Expression Level of Disease Section Compare with the Healthy Individual Tissue | p-value:0.0137869603103027; Fold-change:0.9605949164796111; Z-score:-1.433927864 | ||||
| DT expression in the diseased tissue of patients
DT expression in the normal tissue of healthy individuals
|
|||||
|
 Please Click the above Thumbnail to View/Download
the Expression Barchart for All Samples Please Click the above Thumbnail to View/Download
the Expression Barchart for All Samples
|
||||
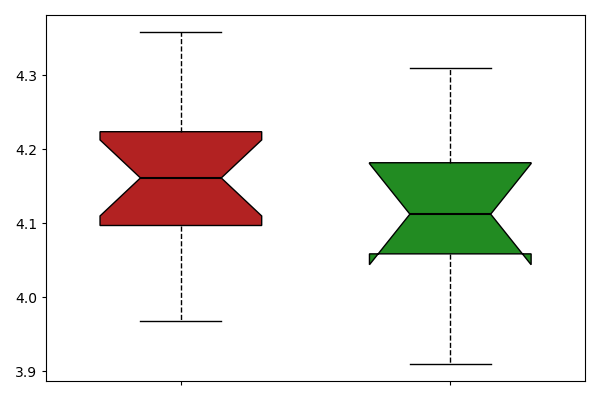
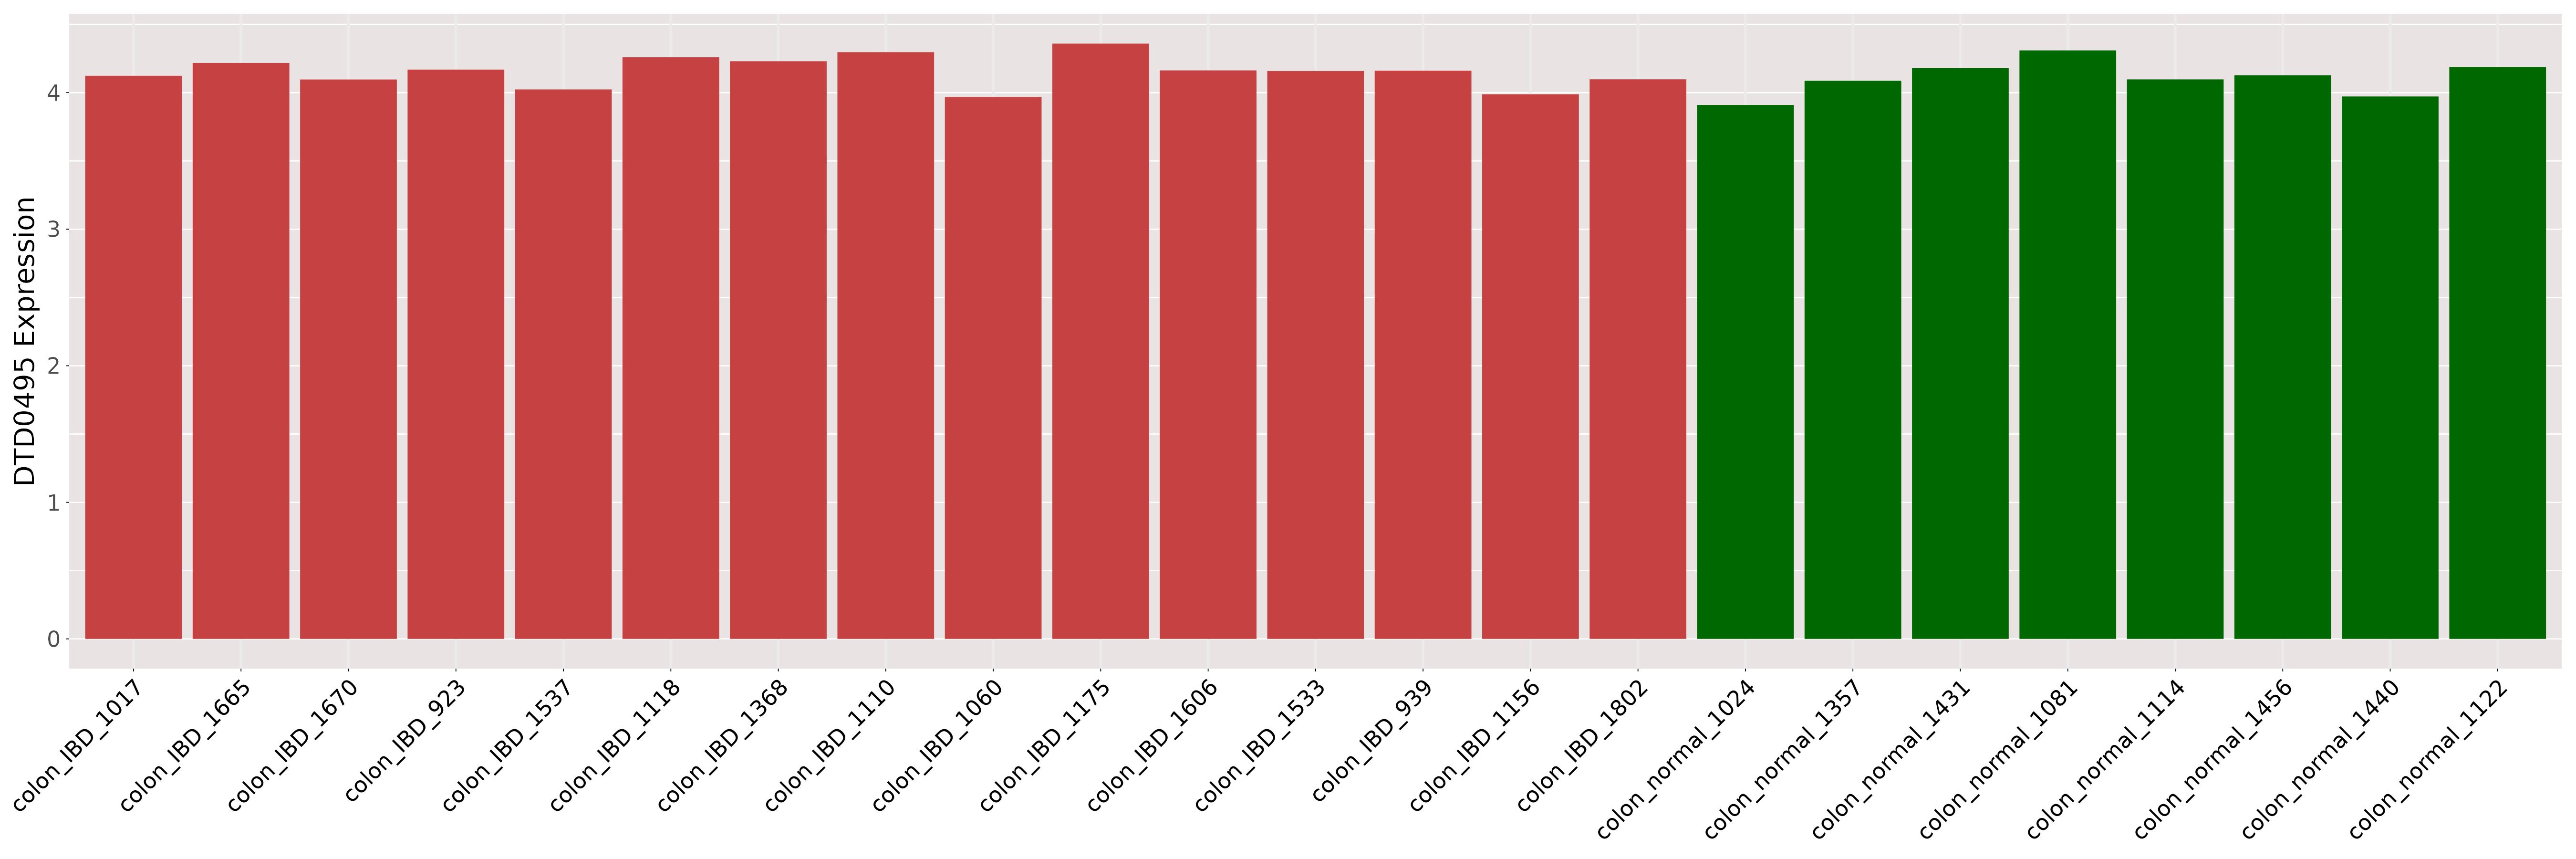
| [+] ICD-11: DD71 Ulcerative colitis | Click to Show/Hide the Full List | ||||
| The Studied Tissue | Caecum | ||||
| The Specified Disease | Active ulcerative colitis [ICD-11:DD71.Z] | ||||
| The Expression Level of Disease Section Compare with the Healthy Individual Tissue | p-value:0.2338556181081386; Fold-change:1.0781413225750265; Z-score:2.588841152183828 | ||||
| DT expression in the diseased tissue of patients
DT expression in the normal tissue of healthy individuals
|
|||||
|
 Please Click the above Thumbnail to View/Download
the Expression Barchart for All Samples Please Click the above Thumbnail to View/Download
the Expression Barchart for All Samples
|
||||
| The Studied Tissue | Left colon | ||||
| The Specified Disease | Active ulcerative colitis [ICD-11:DD71.Z] | ||||
| The Expression Level of Disease Section Compare with the Healthy Individual Tissue | p-value:0.5053249437278883; Fold-change:1.0382992062909506; Z-score:1.0104865652080637 | ||||
| DT expression in the diseased tissue of patients
DT expression in the normal tissue of healthy individuals
|
|||||
|
 Please Click the above Thumbnail to View/Download
the Expression Barchart for All Samples Please Click the above Thumbnail to View/Download
the Expression Barchart for All Samples
|
||||
| The Studied Tissue | Rectum | ||||
| The Specified Disease | Active ulcerative colitis [ICD-11:DD71.Z] | ||||
| The Expression Level of Disease Section Compare with the Healthy Individual Tissue | p-value:0.5901450213093498; Fold-change:1.0065850826710518; Z-score:0.987516463898701 | ||||
| DT expression in the diseased tissue of patients
DT expression in the normal tissue of healthy individuals
|
|||||
|
 Please Click the above Thumbnail to View/Download
the Expression Barchart for All Samples Please Click the above Thumbnail to View/Download
the Expression Barchart for All Samples
|
||||
| The Studied Tissue | Transverse colon | ||||
| The Specified Disease | Active ulcerative colitis [ICD-11:DD71.Z] | ||||
| The Expression Level of Disease Section Compare with the Healthy Individual Tissue | p-value:0.0983571923789592; Fold-change:1.092369997448051; Z-score:2.677609781205545 | ||||
| DT expression in the diseased tissue of patients
DT expression in the normal tissue of healthy individuals
|
|||||
|
|
|
||||
| [+] ICD-11: DD7Z Inflammatory bowel disease, unspecified | Click to Show/Hide the Full List | ||||
| The Studied Tissue | Colon | ||||
| The Specified Disease | Inflammatory bowel disease [ICD-11:DD7Z] | ||||
| The Expression Level of Disease Section Compare with the Healthy Individual Tissue | p-value:0.3813669808051125; Fold-change:1.0119003783333491; Z-score:0.3596247974407683 | ||||
| DT expression in the diseased tissue of patients
DT expression in the normal tissue of healthy individuals
|
|||||
|
 Please Click the above Thumbnail to View/Download
the Expression Barchart for All Samples Please Click the above Thumbnail to View/Download
the Expression Barchart for All Samples
|
||||
| The Studied Tissue | Sigmoid colon | ||||
| The Specified Disease | Inflammatory bowel disease [ICD-11:DD7Z] | ||||
| The Expression Level of Disease Section Compare with the Healthy Individual Tissue | p-value:0.720041573659278; Fold-change:1.0010954303957105; Z-score:0.0575422630603008 | ||||
| DT expression in the diseased tissue of patients
DT expression in the normal tissue of healthy individuals
|
|||||
|
 Please Click the above Thumbnail to View/Download
the Expression Barchart for All Samples Please Click the above Thumbnail to View/Download
the Expression Barchart for All Samples
|
||||
| ICD-11: 14 Disease of the skin | |||||
| [+] ICD-11: EA80 Atopic dermatitis | Click to Show/Hide the Full List | ||||
| The Studied Tissue | Skin | ||||
| The Specified Disease | Atopic eczema [ICD-11:EA80] | ||||
| The Expression Level of Disease Section Compare with the Healthy Individual Tissue | p-value:0.3870581702550254; Fold-change:0.9924111419047652; Z-score:-0.376831583 | ||||
| DT expression in the diseased tissue of patients
DT expression in the normal tissue of healthy individuals
|
|||||
|
 Please Click the above Thumbnail to View/Download
the Expression Barchart for All Samples Please Click the above Thumbnail to View/Download
the Expression Barchart for All Samples
|
||||
| [+] ICD-11: EA91 Lichen planus (oral mucosal involvement) | Click to Show/Hide the Full List | ||||
| The Studied Tissue | Mouth mucosa | ||||
| The Specified Disease | Oral lichen planus [ICD-11:EA91.42] | ||||
| The Expression Level of Disease Section Compare with the Healthy Individual Tissue | p-value:0.6323437977217276; Fold-change:0.9928787854290748; Z-score:-0.212440645 | ||||
| DT expression in the diseased tissue of patients
DT expression in the normal tissue of healthy individuals
|
|||||
|
 Please Click the above Thumbnail to View/Download
the Expression Barchart for All Samples Please Click the above Thumbnail to View/Download
the Expression Barchart for All Samples
|
||||
| [+] ICD-11: ED90.0 Rosacea | Click to Show/Hide the Full List | ||||
| The Studied Tissue | Skin | ||||
| The Specified Disease | Rosacea [ICD-11:ED90.0] | ||||
| The Expression Level of Disease Section Compare with the Healthy Individual Tissue | p-value:0.5861182718396738; Fold-change:1.022212334369997; Z-score:0.1274721160529582 | ||||
| DT expression in the diseased tissue of patients
DT expression in the normal tissue of healthy individuals
|
|||||
|
 Please Click the above Thumbnail to View/Download
the Expression Barchart for All Samples Please Click the above Thumbnail to View/Download
the Expression Barchart for All Samples
|
||||
| [+] ICD-11: EK90.0 Actinic keratosis | Click to Show/Hide the Full List | ||||
| The Studied Tissue | Skin | ||||
| The Specified Disease | Actinic keratosis [ICD-11:EK90.0] | ||||
| The Expression Level of Disease Section Compare with the Healthy Individual Tissue | p-value:4.217813764037735e-06; Fold-change:0.1308411214953271; Z-score:-2.075844088 | ||||
| DT expression in the diseased tissue of patients
DT expression in the normal tissue of healthy individuals
|
|||||
|
 Please Click the above Thumbnail to View/Download
the Expression Barchart for All Samples Please Click the above Thumbnail to View/Download
the Expression Barchart for All Samples
|
||||
| ICD-11: 15 Disease of the musculoskeletal system/connective tissue | |||||
| [+] ICD-11: FA0Z Osteoarthritis, unspecified site | Click to Show/Hide the Full List | ||||
| The Studied Tissue | Bone | ||||
| The Specified Disease | Osteoarthritis [ICD-11:FA0Z] | ||||
| The Expression Level of Disease Section Compare with the Healthy Individual Tissue | p-value:0.0129836452779574; Fold-change:1.0259847402581104; Z-score:0.9056777670907864 | ||||
| DT expression in the diseased tissue of patients
DT expression in the normal tissue of healthy individuals
|
|||||
|
 Please Click the above Thumbnail to View/Download
the Expression Barchart for All Samples Please Click the above Thumbnail to View/Download
the Expression Barchart for All Samples
|
||||
| ICD-11: 20 Developmental anomaly | |||||
| [+] ICD-11: LA88.2 Tetralogy of Fallot | Click to Show/Hide the Full List | ||||
| The Studied Tissue | Heart ventricle | ||||
| The Specified Disease | Tetralogy of fallot [ICD-11:LA88.2] | ||||
| The Expression Level of Disease Section Compare with the Healthy Individual Tissue | p-value:0.2048308720328532; Fold-change:1.5; Z-score:0.663975864685863 | ||||
| DT expression in the diseased tissue of patients
DT expression in the normal tissue of healthy individuals
|
|||||
|
 Please Click the above Thumbnail to View/Download
the Expression Barchart for All Samples Please Click the above Thumbnail to View/Download
the Expression Barchart for All Samples
|
||||
| [+] ICD-11: LB70.00 Unicoronal craniosynostosis | Click to Show/Hide the Full List | ||||
| The Studied Tissue | Skull | ||||
| The Specified Disease | Coronal craniosynostosis [ICD-11:LB70.00] | ||||
| The Expression Level of Disease Section Compare with the Healthy Individual Tissue | p-value:0.4599763818057447; Fold-change:0.6521739130434783; Z-score:-0.869626357 | ||||
| DT expression in the diseased tissue of patients
DT expression in the normal tissue of healthy individuals
|
|||||
|
 Please Click the above Thumbnail to View/Download
the Expression Barchart for All Samples Please Click the above Thumbnail to View/Download
the Expression Barchart for All Samples
|
||||
| [+] ICD-11: LB70.02 Lambdoid craniosynostosis | Click to Show/Hide the Full List | ||||
| The Studied Tissue | Skull | ||||
| The Specified Disease | Lambdoid craniosynostosis [ICD-11:LB70.3] | ||||
| The Expression Level of Disease Section Compare with the Healthy Individual Tissue | p-value:0.3291699581693566; Fold-change:0.5217391304347826; Z-score:-1.159501809 | ||||
| DT expression in the diseased tissue of patients
DT expression in the normal tissue of healthy individuals
|
|||||
|
 Please Click the above Thumbnail to View/Download
the Expression Barchart for All Samples Please Click the above Thumbnail to View/Download
the Expression Barchart for All Samples
|
||||
| [+] ICD-11: LB70.03 Metopic craniosynostosis | Click to Show/Hide the Full List | ||||
| The Studied Tissue | Skull | ||||
| The Specified Disease | Metopic craniosynostosis [ICD-11:LB70.2] | ||||
| The Expression Level of Disease Section Compare with the Healthy Individual Tissue | p-value:0.2459610035561342; Fold-change:0.5217391304347826; Z-score:-1.40043725 | ||||
| DT expression in the diseased tissue of patients
DT expression in the normal tissue of healthy individuals
|
|||||
|
 Please Click the above Thumbnail to View/Download
the Expression Barchart for All Samples Please Click the above Thumbnail to View/Download
the Expression Barchart for All Samples
|
||||
| [+] ICD-11: LB70.0Y Sagittal craniosynostosis | Click to Show/Hide the Full List | ||||
| The Studied Tissue | Skull | ||||
| The Specified Disease | Sagittal craniosynostosis [ICD-11:LB70.1] | ||||
| The Expression Level of Disease Section Compare with the Healthy Individual Tissue | p-value:0.2696962156237513; Fold-change:0.8695652173913043; Z-score:-0.822192192 | ||||
| DT expression in the diseased tissue of patients
DT expression in the normal tissue of healthy individuals
|
|||||
|
 Please Click the above Thumbnail to View/Download
the Expression Barchart for All Samples Please Click the above Thumbnail to View/Download
the Expression Barchart for All Samples
|
||||
| [+] ICD-11: LC02 Sebaceous naevus (nevus sebaceus of Jadassohn) | Click to Show/Hide the Full List | ||||
| The Studied Tissue | Skin | ||||
| The Specified Disease | Sebaceous of jadassohn nevus [ICD-11:LD2D.Y] | ||||
| The Expression Level of Disease Section Compare with the Healthy Individual Tissue | p-value:0.0004350912792663; Fold-change:0.1308411214953271; Z-score:-2.046840279 | ||||
| DT expression in the diseased tissue of patients
DT expression in the normal tissue of healthy individuals
|
|||||
|
 Please Click the above Thumbnail to View/Download
the Expression Barchart for All Samples Please Click the above Thumbnail to View/Download
the Expression Barchart for All Samples
|
||||
| ICD-11: 25 Codes for special purposes | |||||
| [+] ICD-11: RA01 COVID-19 | Click to Show/Hide the Full List | ||||
| The Studied Tissue | Lung | ||||
| The Specified Disease | Covid [ICD-11:RA01.0] | ||||
| The Expression Level of Disease Section Compare with the Healthy Individual Tissue | p-value:0.000202835272674; Fold-change:0.1956521739130435; Z-score:-1.64543763 | ||||
| DT expression in the diseased tissue of patients
DT expression in the normal tissue of healthy individuals
|
|||||
|
 Please Click the above Thumbnail to View/Download
the Expression Barchart for All Samples Please Click the above Thumbnail to View/Download
the Expression Barchart for All Samples
|
||||
| The Studied Tissue | Colon | ||||
| The Specified Disease | Covid [ICD-11:RA01.0] | ||||
| The Expression Level of Disease Section Compare with the Healthy Individual Tissue | p-value:0.3809704857158964; Fold-change:0.5862068965517241; Z-score:-0.514553364 | ||||
| DT expression in the diseased tissue of patients
DT expression in the normal tissue of healthy individuals
|
|||||
|
 Please Click the above Thumbnail to View/Download
the Expression Barchart for All Samples Please Click the above Thumbnail to View/Download
the Expression Barchart for All Samples
|
||||
| ICD-11: 28 Extension Codes | |||||
| [+] ICD-11: XH12D2 Pilocytic astrocytoma | Click to Show/Hide the Full List | ||||
| The Studied Tissue | Brain | ||||
| The Specified Disease | Astrocytoma, pilocytic [ICD-11:XH12D2] | ||||
| The Expression Level of Disease Section Compare with the Healthy Individual Tissue | p-value:0.95275103650514; Fold-change:0.9741700804969514; Z-score:0.02538873029478 | ||||
| DT expression in the diseased tissue of patients
DT expression in the normal tissue of healthy individuals
|
|||||
|
 Please Click the above Thumbnail to View/Download
the Expression Barchart for All Samples Please Click the above Thumbnail to View/Download
the Expression Barchart for All Samples
|
||||
| [+] ICD-11: XH1L48 Subependymal giant cell astrocytoma | Click to Show/Hide the Full List | ||||
| The Studied Tissue | Brain | ||||
| The Specified Disease | Subependymal giant cell astrocytoma [ICD-11:XH1L48] | ||||
| The Expression Level of Disease Section Compare with the Healthy Individual Tissue | p-value:0.5427842848949427; Fold-change:1.0031047041060612; Z-score:-0.872482674 | ||||
| DT expression in the diseased tissue of patients
DT expression in the normal tissue of healthy individuals
|
|||||
|
 Please Click the above Thumbnail to View/Download
the Expression Barchart for All Samples Please Click the above Thumbnail to View/Download
the Expression Barchart for All Samples
|
||||
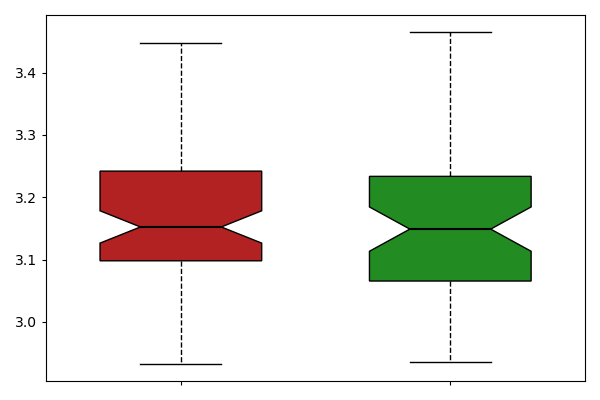
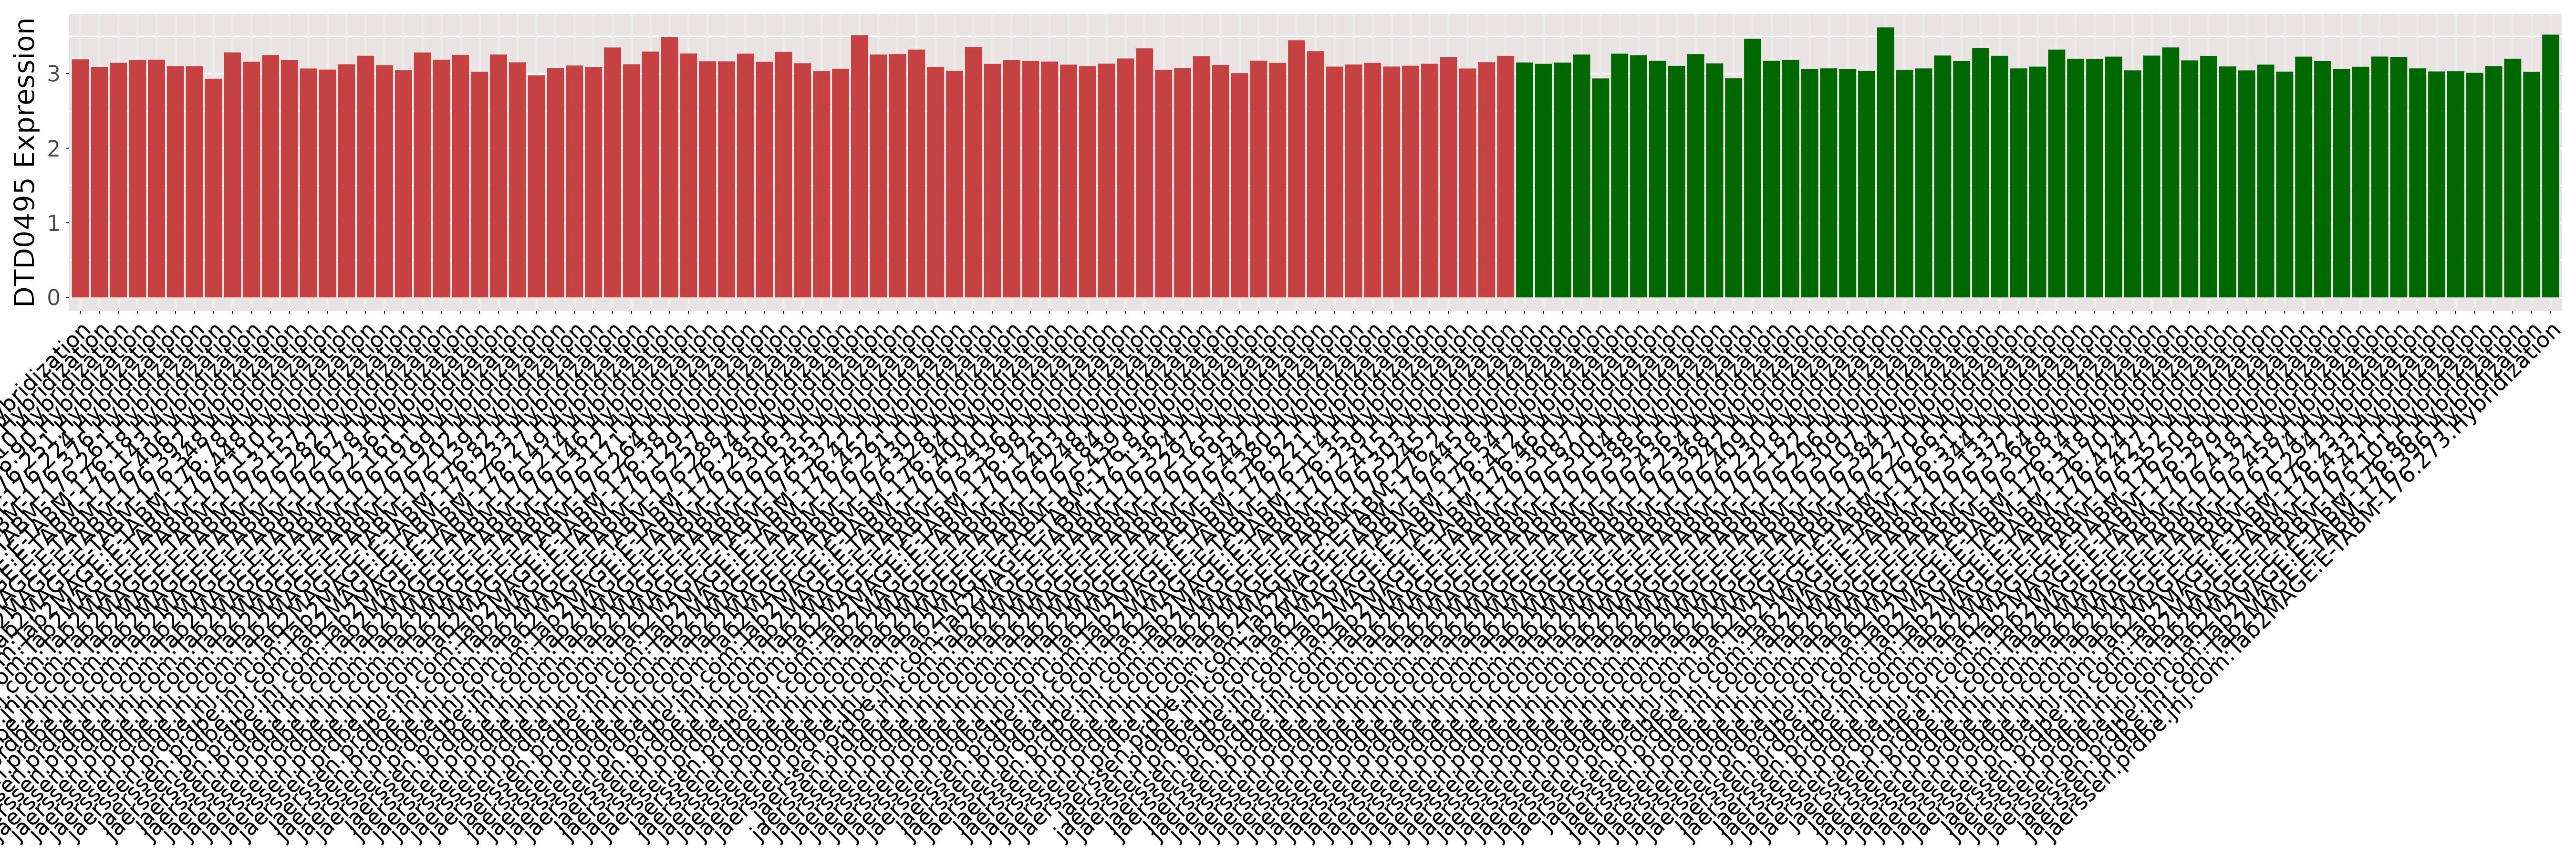
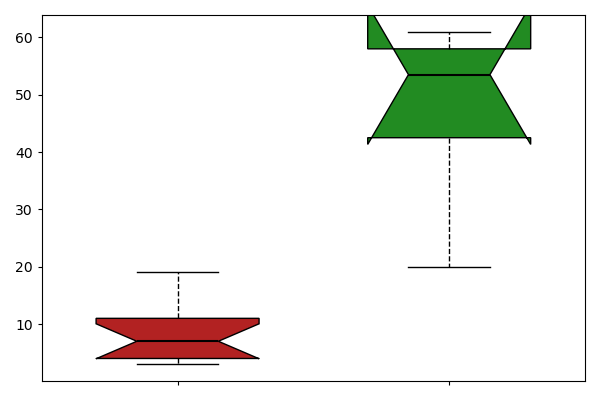
| [+] ICD-11: XH77N6 Clear cell sarcoma, NOS (soft tissue) | Click to Show/Hide the Full List | ||||
| The Studied Tissue | Kidney | ||||
| The Specified Disease | Clear cell sarcoma [ICD-11:XH77N6] | ||||
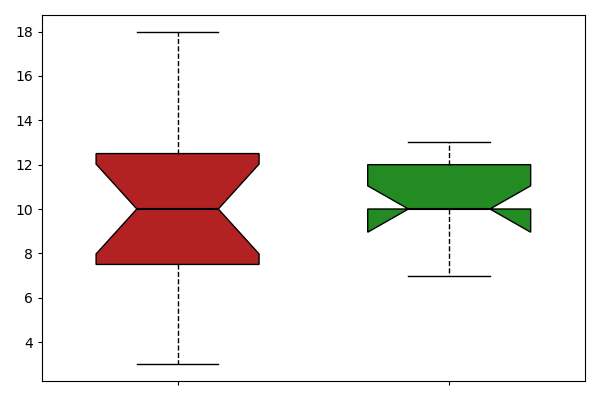
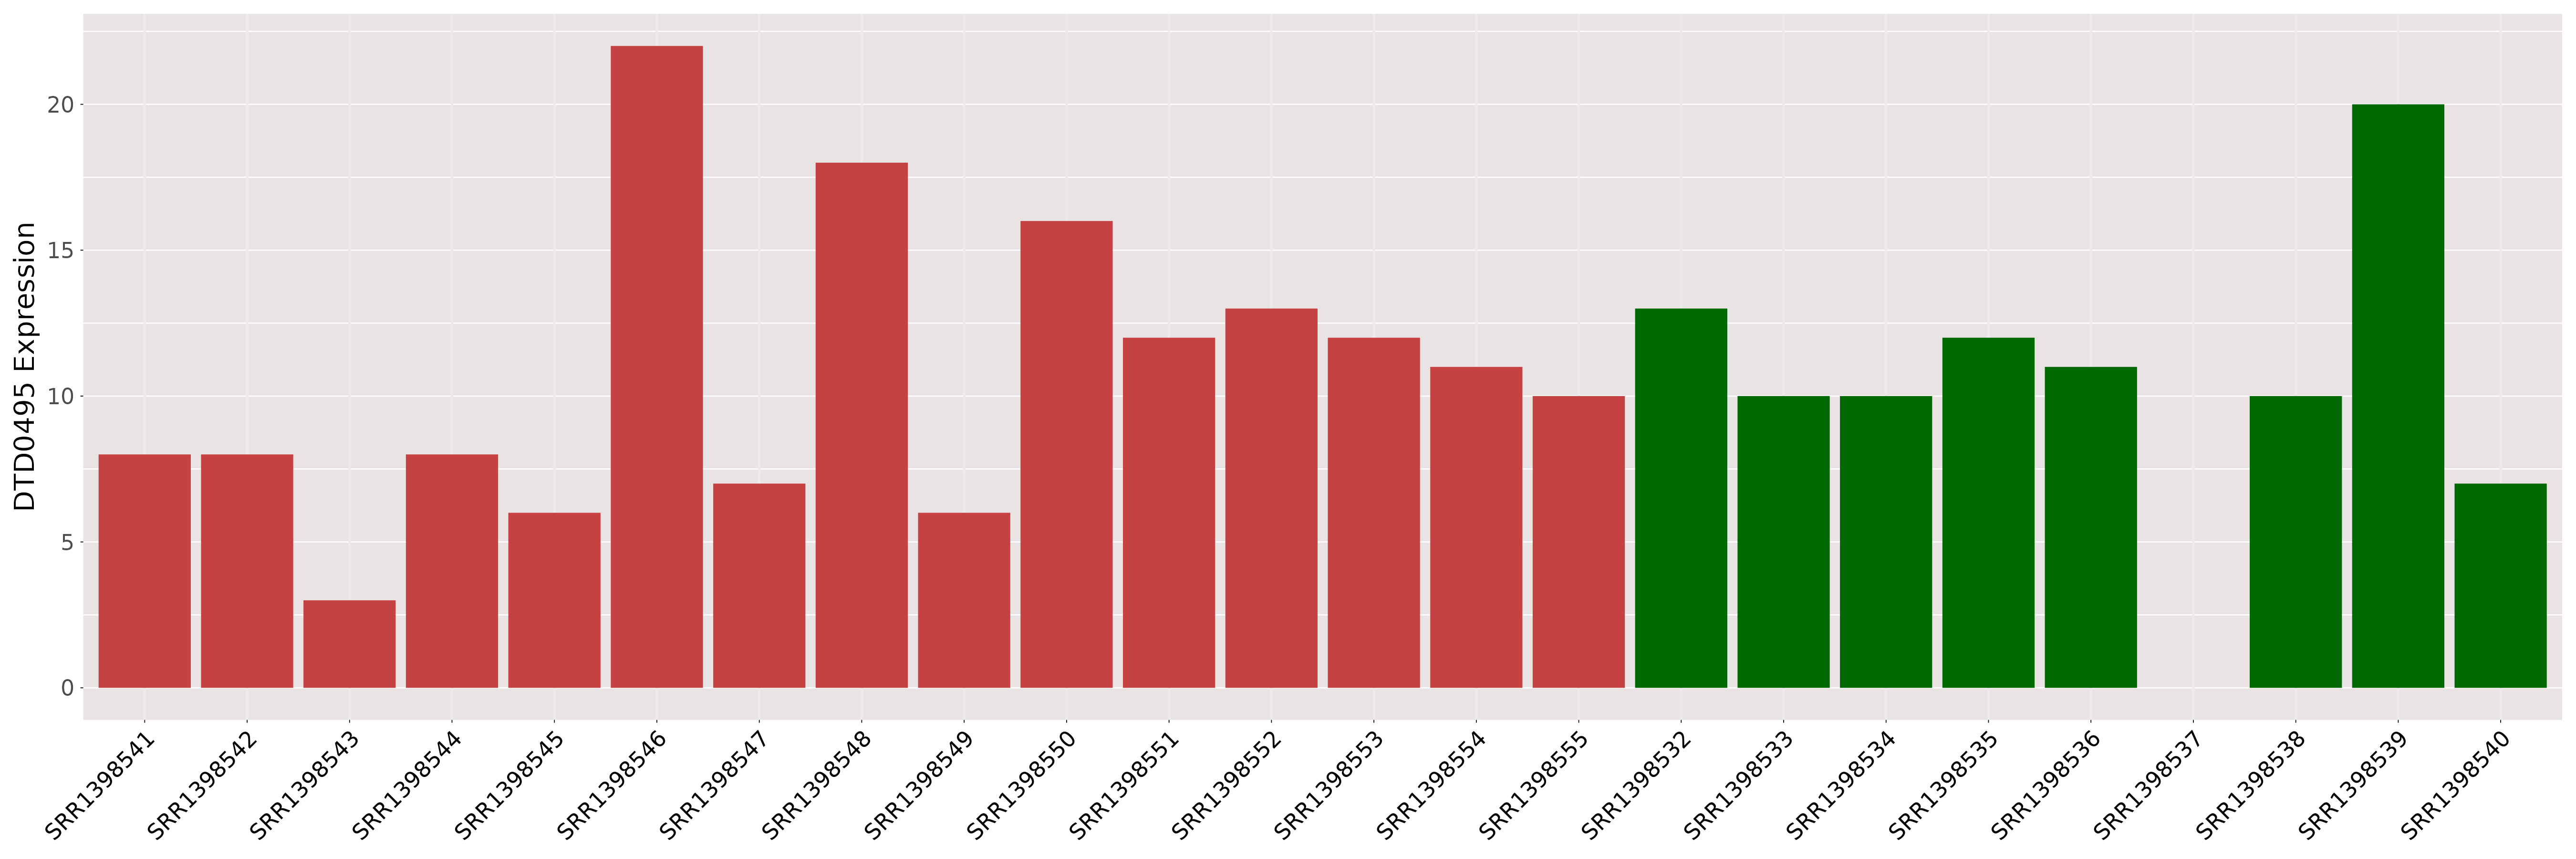
| The Expression Level of Disease Section Compare with the Healthy Individual Tissue | p-value:0.1486819538192592; Fold-change:1.034810208625956; Z-score:7.003676772779458 | ||||
| DT expression in the diseased tissue of patients
DT expression in the normal tissue of healthy individuals
|
|||||
|
|
|
||||
| [+] ICD-11: XH7ZQ4 Atypical teratoid/rhabdoid tumour | Click to Show/Hide the Full List | ||||
| The Studied Tissue | Brain | ||||
| The Specified Disease | Atypical teratoid rhabdoid tumor [ICD-11:XH7ZQ4] | ||||
| The Expression Level of Disease Section Compare with the Healthy Individual Tissue | p-value:0.0414695363658175; Fold-change:0.9605610450215132; Z-score:-1.013838019 | ||||
| DT expression in the diseased tissue of patients
DT expression in the normal tissue of healthy individuals
|
|||||
|
 Please Click the above Thumbnail to View/Download
the Expression Barchart for All Samples Please Click the above Thumbnail to View/Download
the Expression Barchart for All Samples
|
||||
If you find any error in data or bug in web service, please kindly report it to Dr. Li and Dr. Fu.