
Detail Information of Disease-specific Protein Abundances
| General Information of Drug Transporter (DT) | |||||
|---|---|---|---|---|---|
| DT ID | DTD0104 Transporter Info | ||||
| Gene Name | SLC16A13 | ||||
| Protien Name | Monocarboxylate transporter 13 | ||||
| Gene ID | |||||
| UniProt ID | |||||
| Disease-specific Protein Abundances of DT (DPAD) | |||||
|---|---|---|---|---|---|
| ICD-11: 02 Neoplasm | |||||
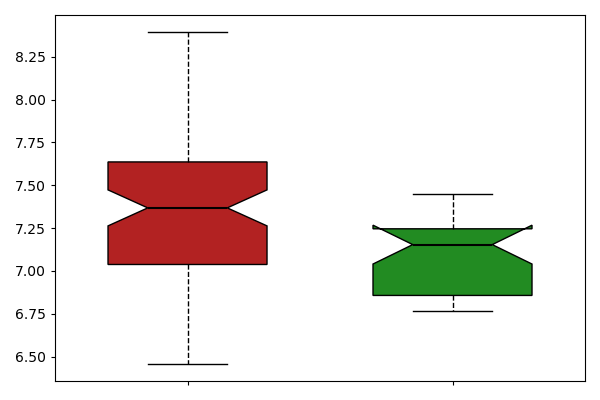
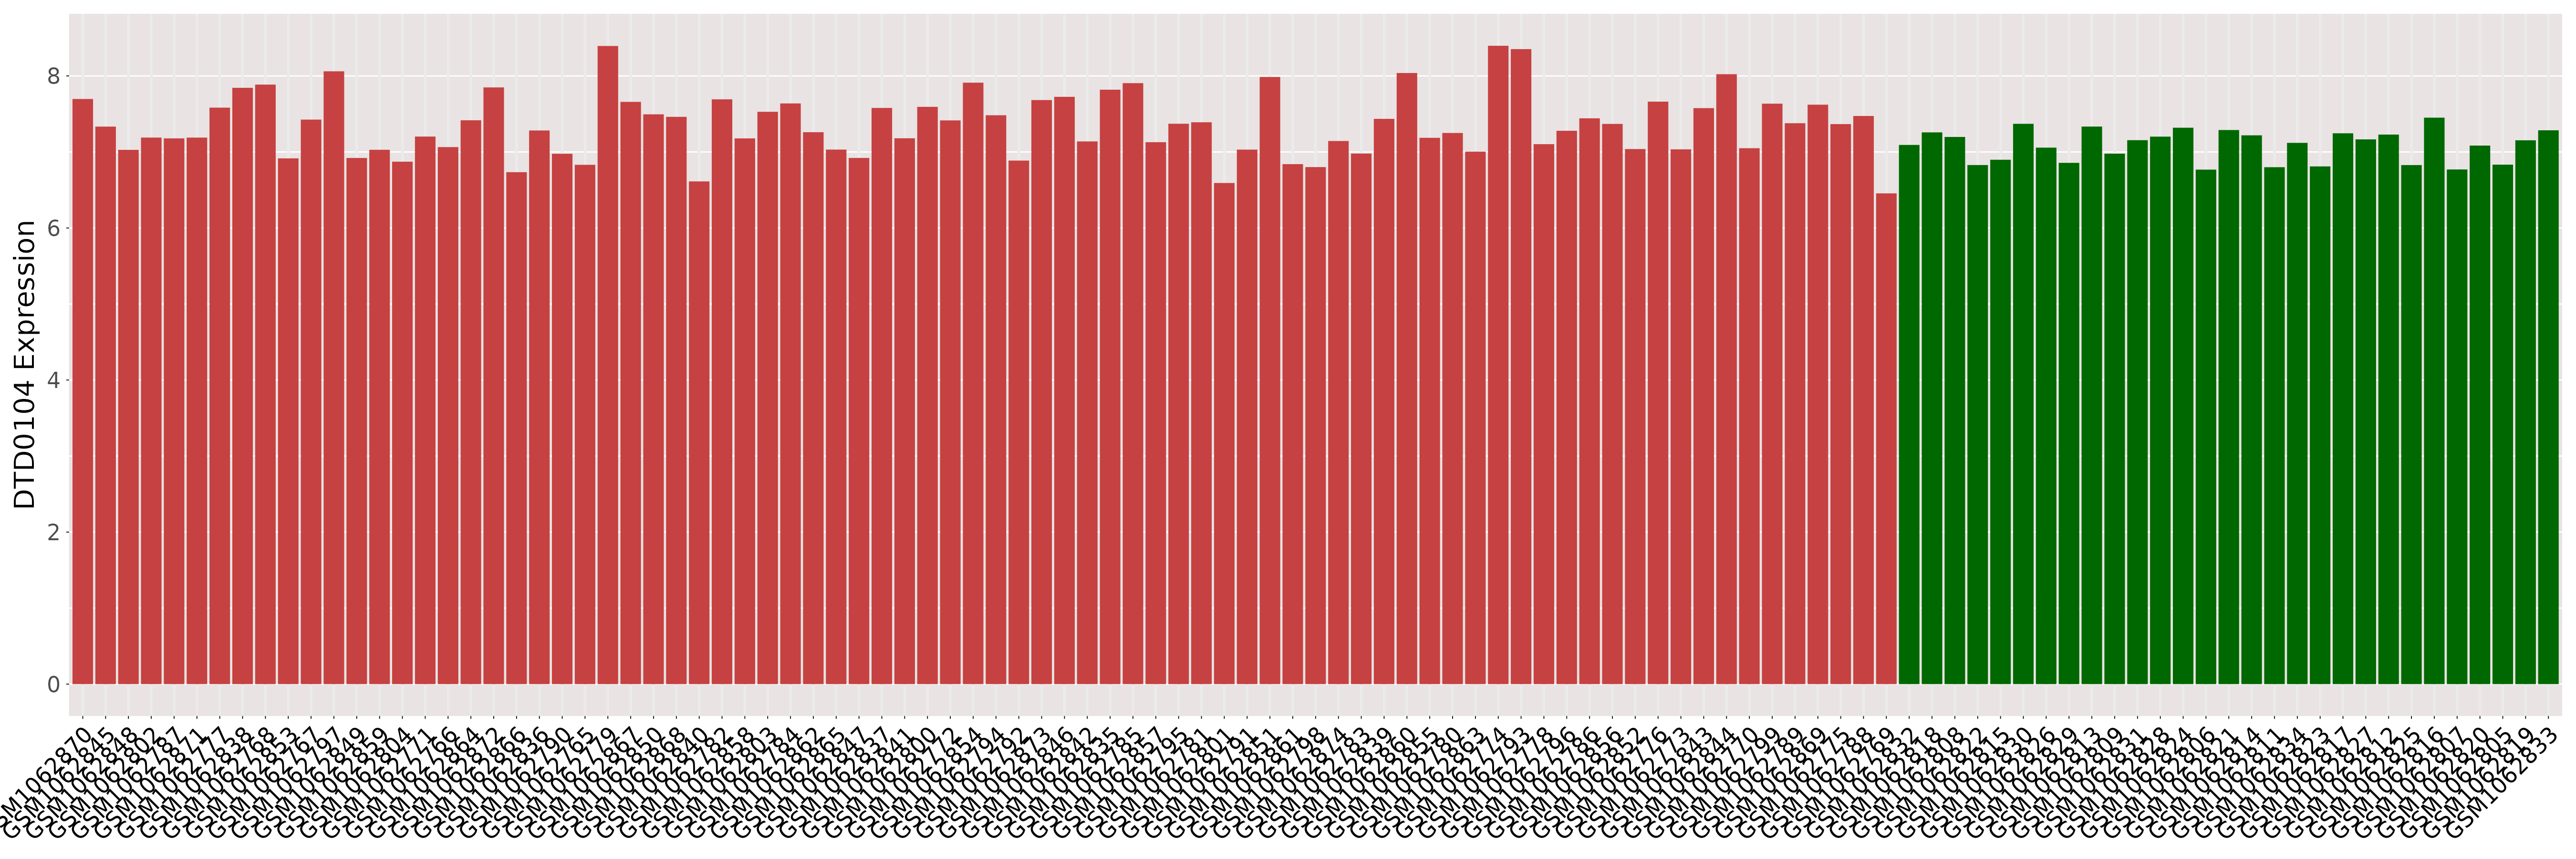
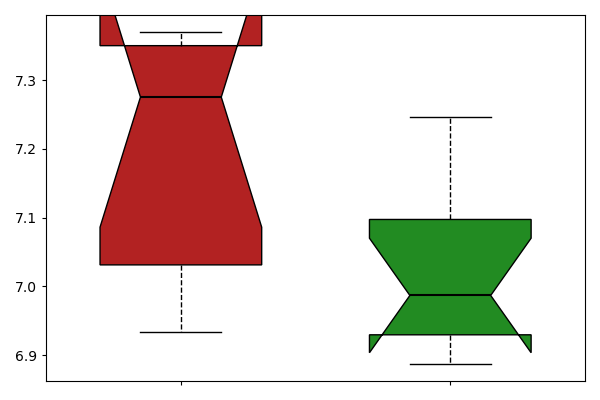
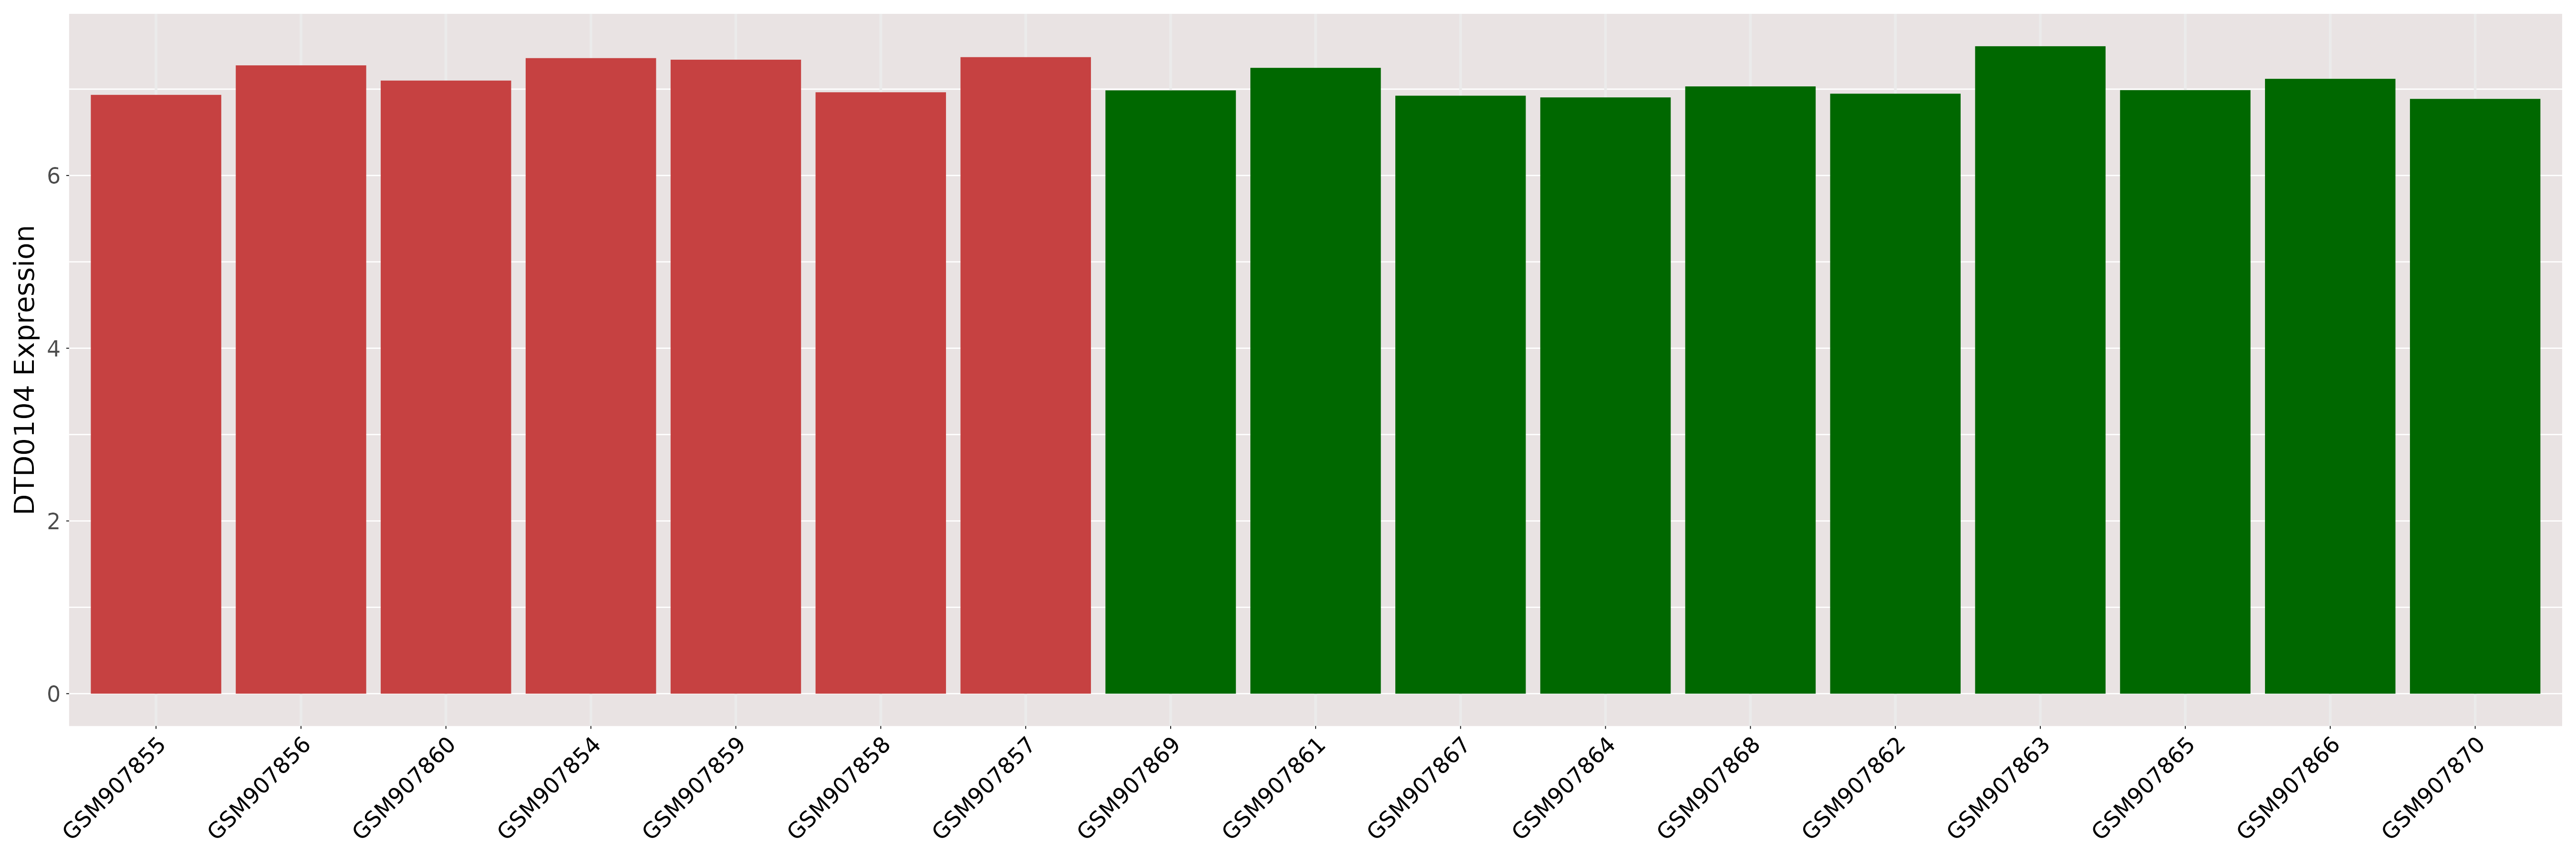
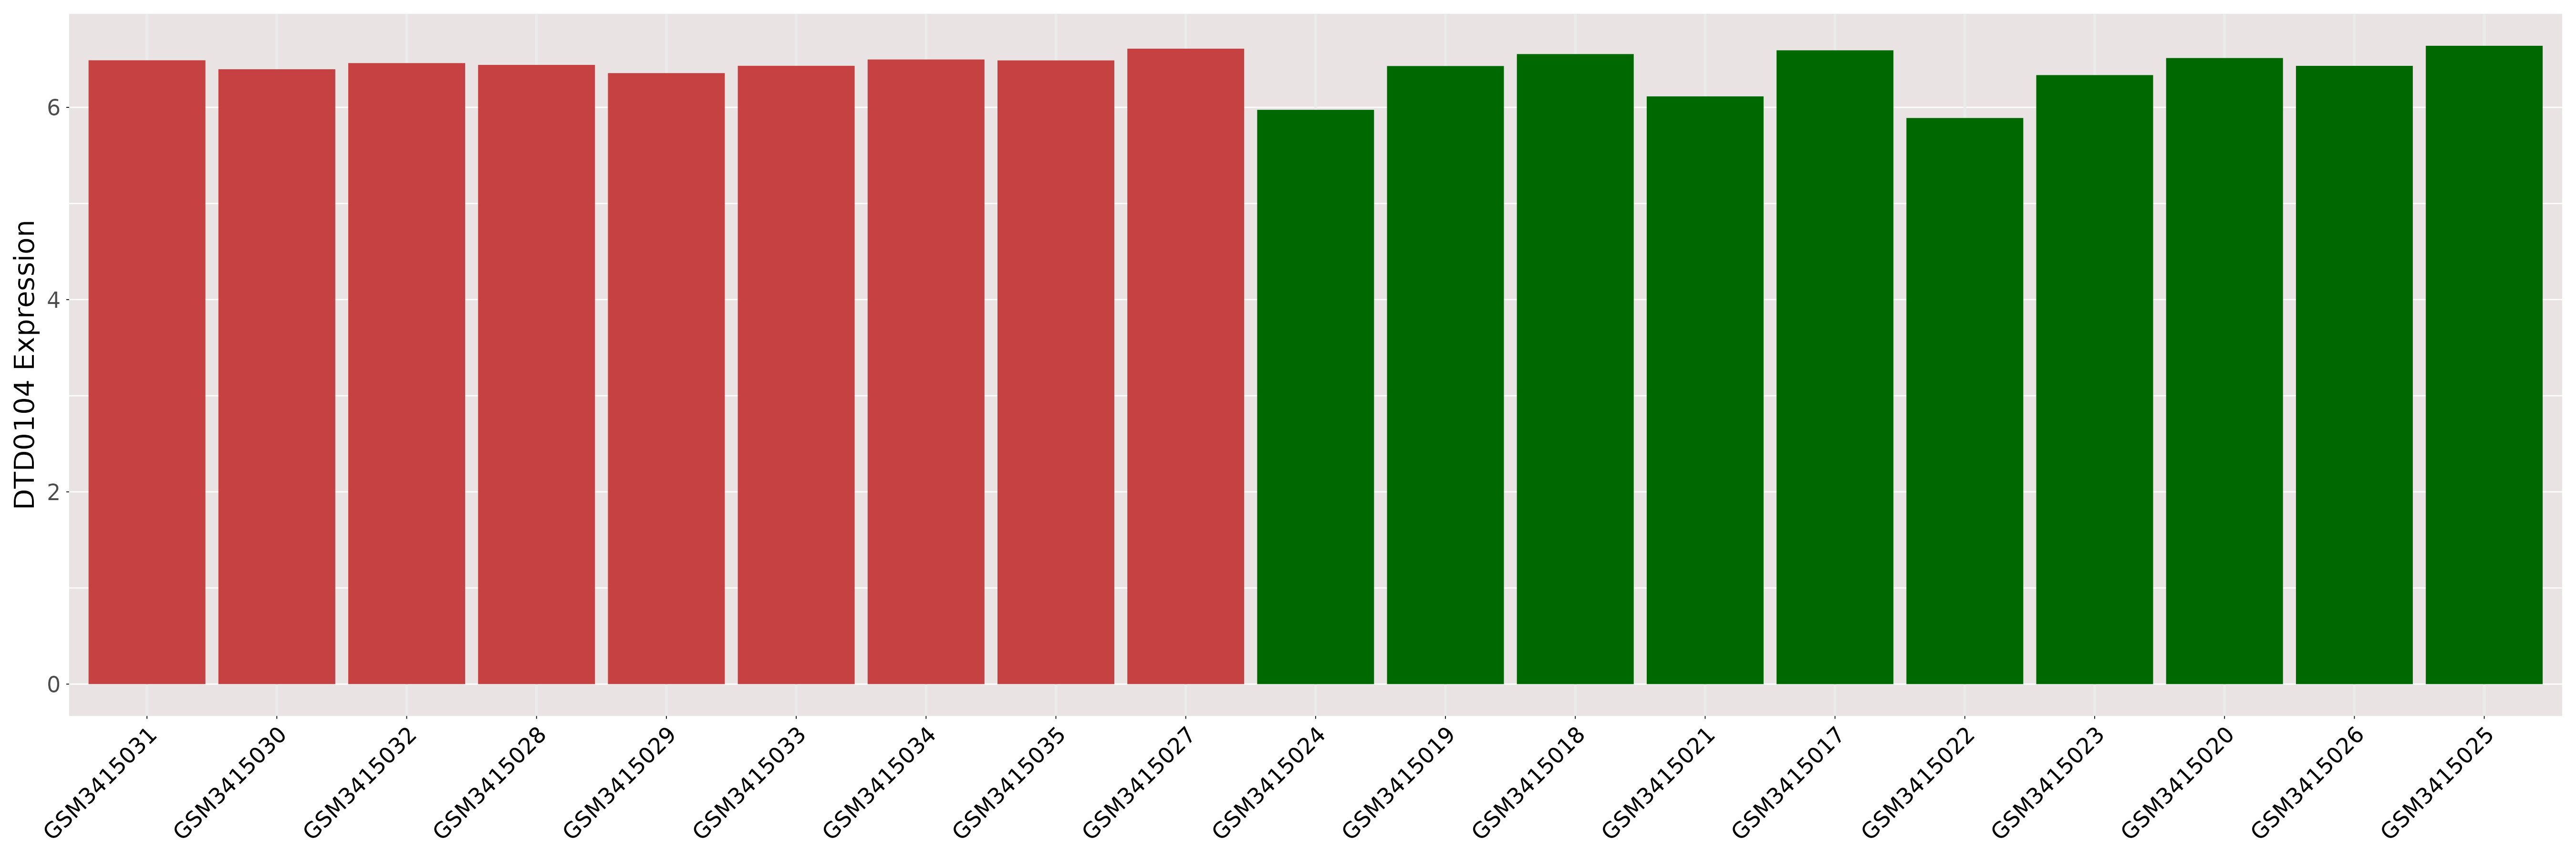
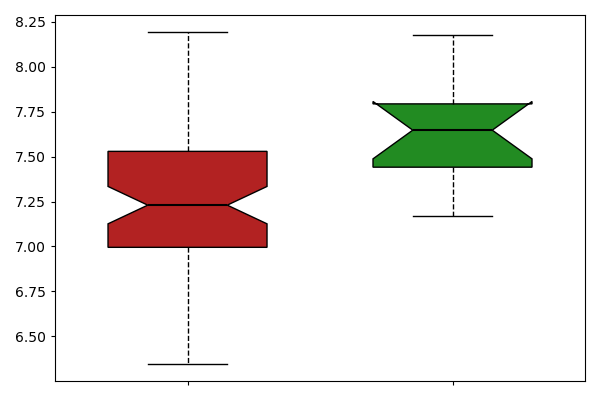
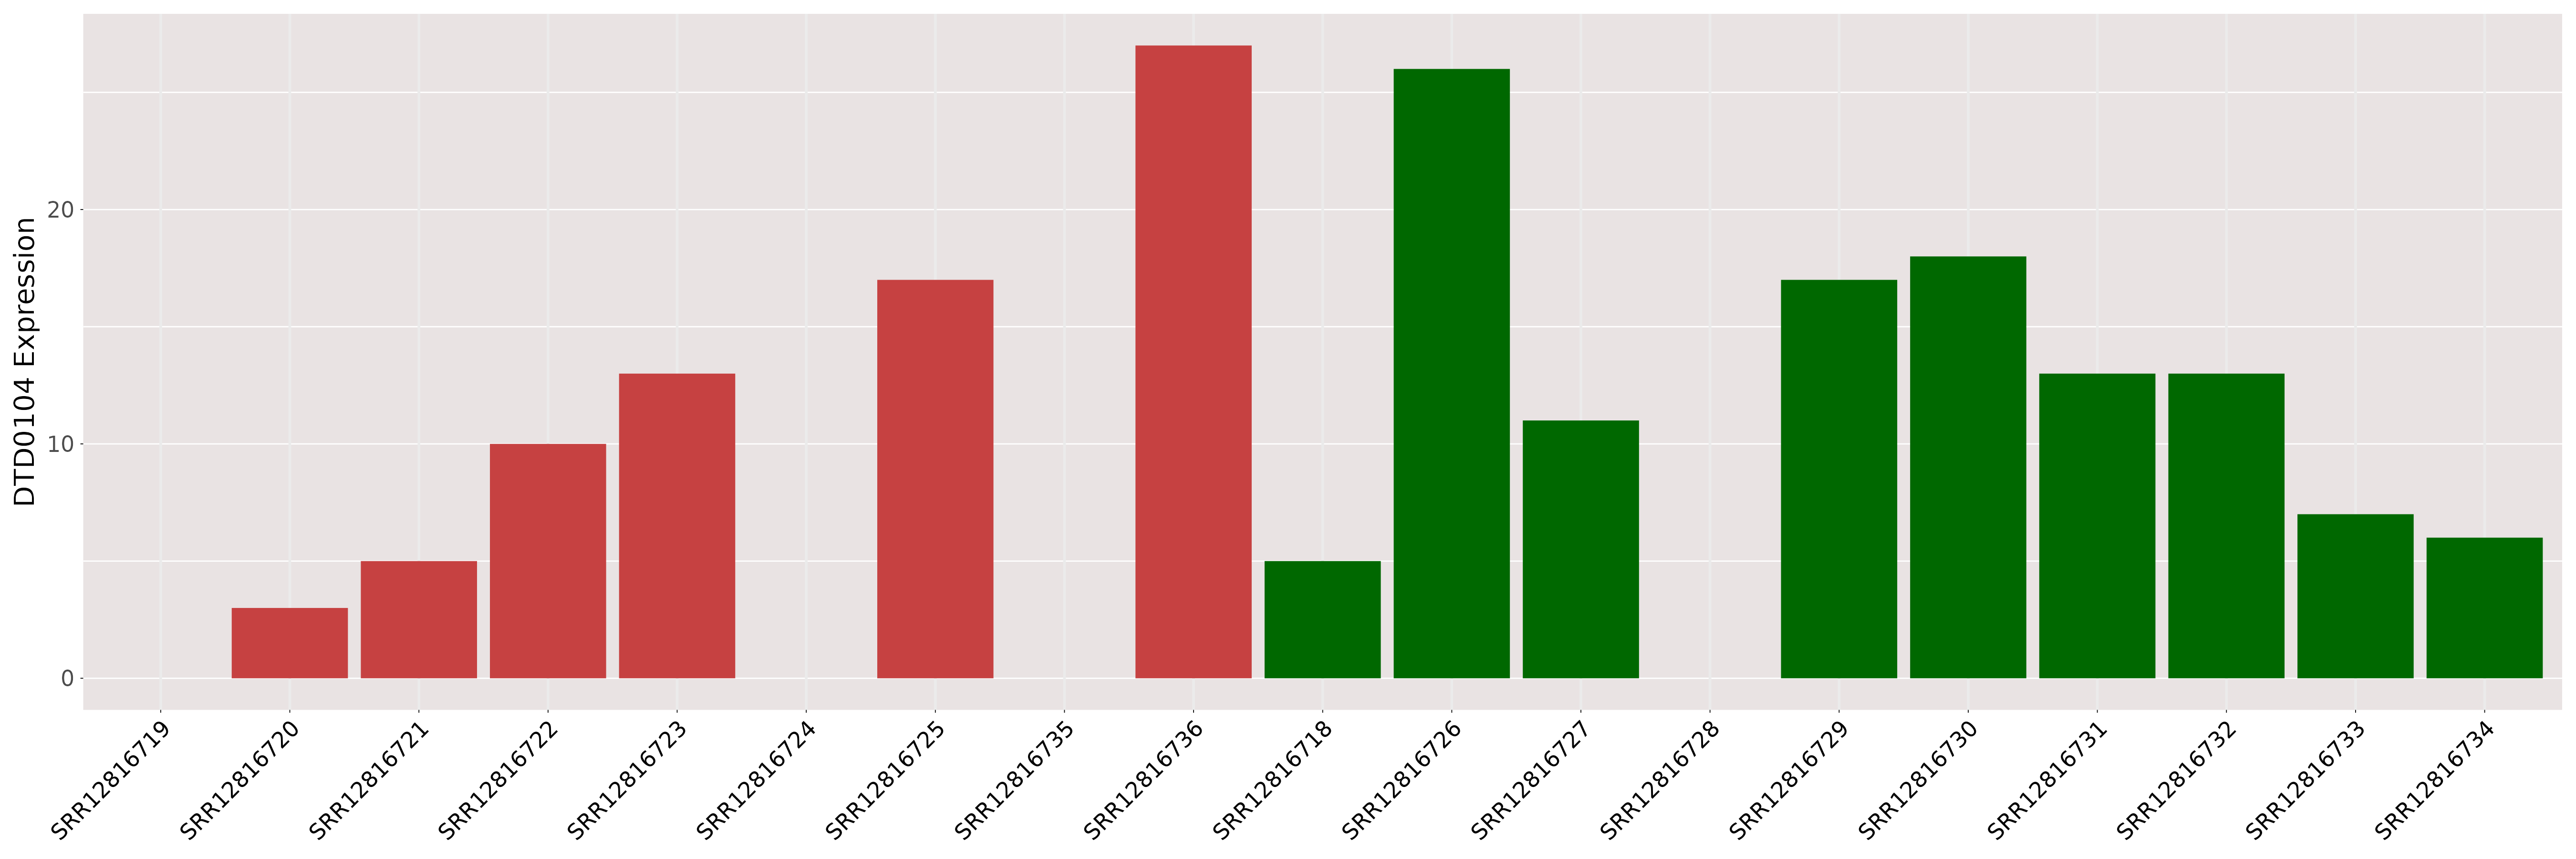
| [+] ICD-11: 2B91 Colorectal carcinoma (colorectal cancer) | Click to Show/Hide the Full List | ||||
| The Studied Tissue | Colon | ||||
| The Specified Disease | Colorectal cancer [ICD-11:2B91] | ||||
| The Expression Level of Disease Section Compare with the Healthy Individual Tissue | p-value:0.0021131510656244; Fold-change:inf; Z-score:142.31335464070443 | ||||
| DT expression in the diseased tissue of patients
DT expression in the normal tissue of healthy individuals
|
|||||

|
 Please Click the above Thumbnail to View/Download
the Expression Barchart for All Samples Please Click the above Thumbnail to View/Download
the Expression Barchart for All Samples
|
||||
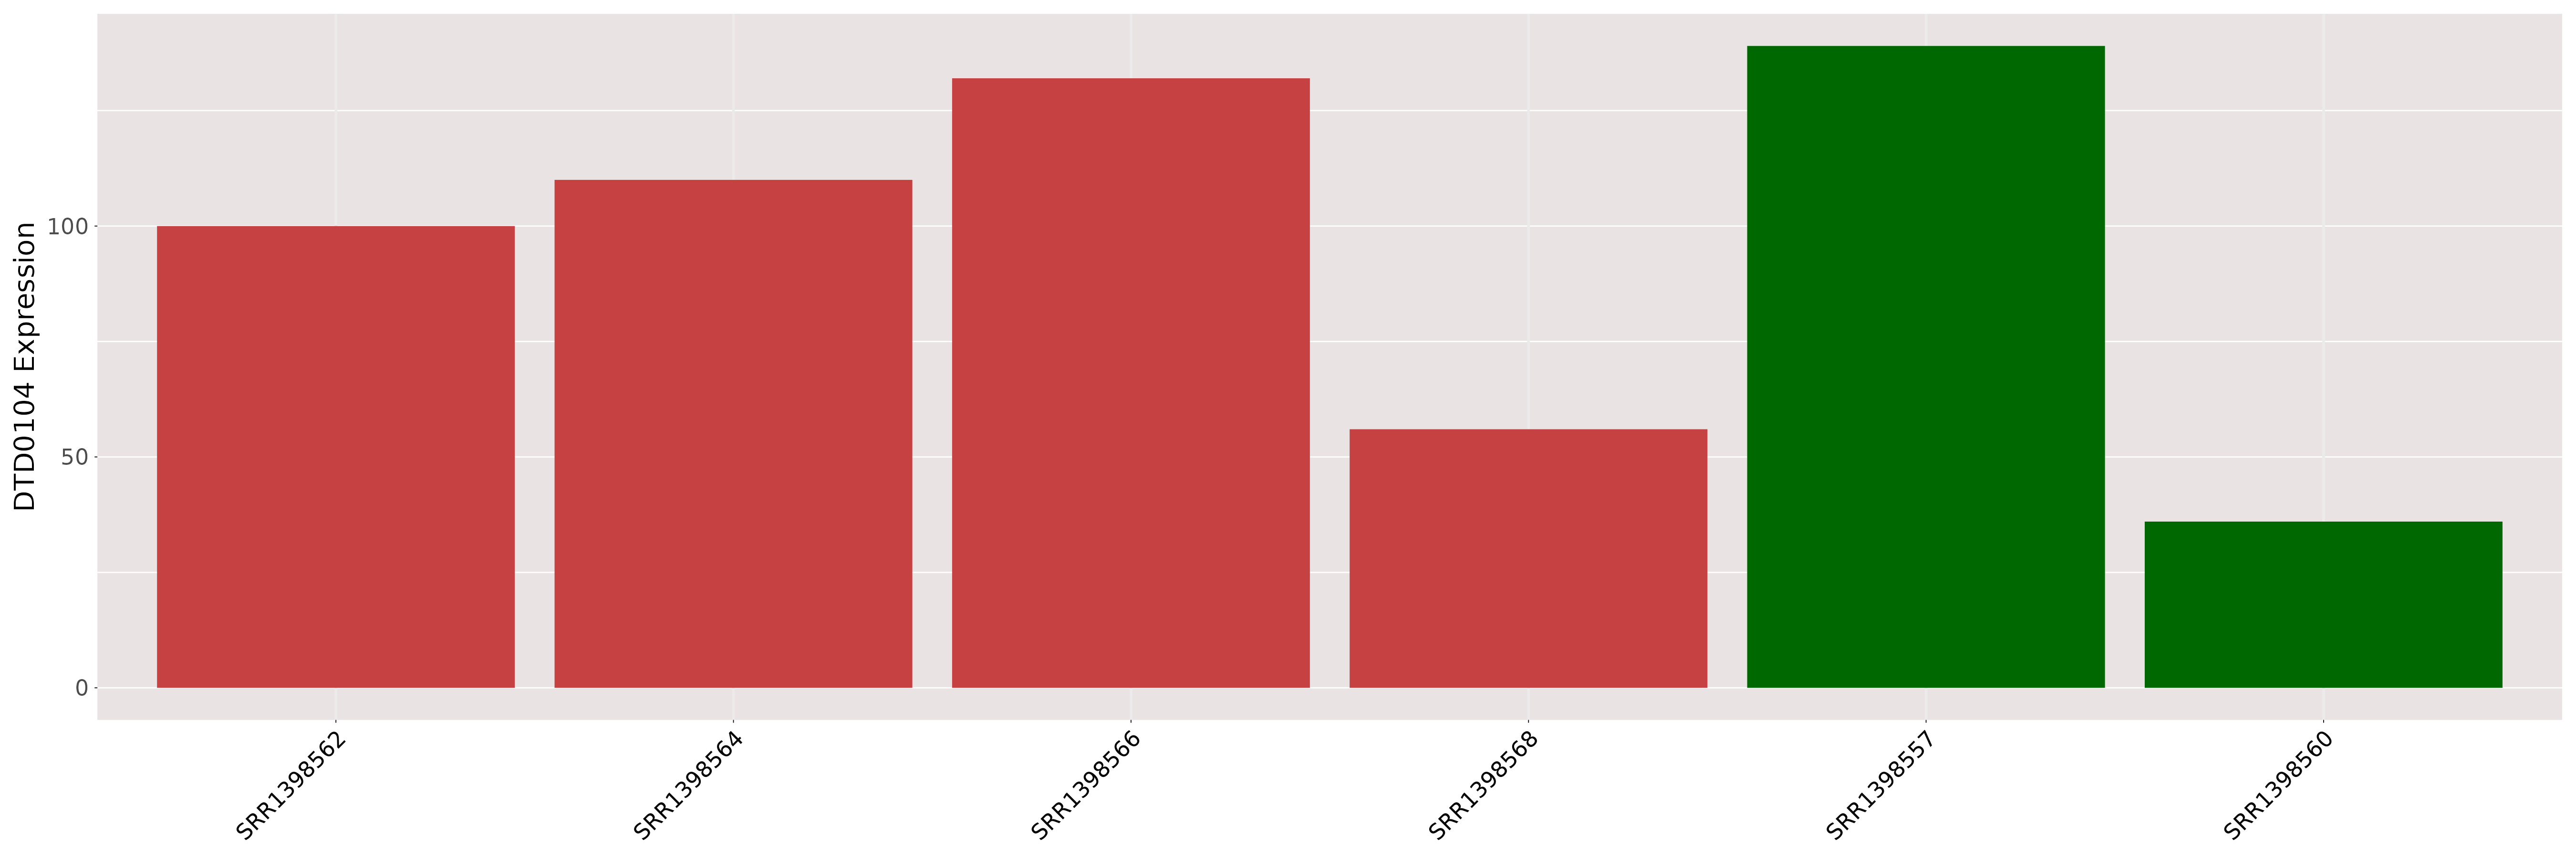
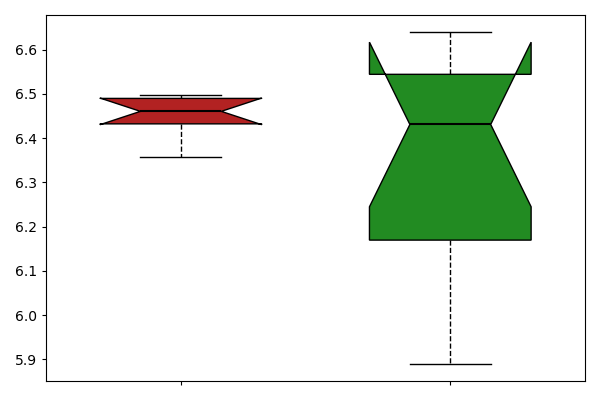
| [+] ICD-11: 2C25.0 Adenocarcinoma of bronchus or lung | Click to Show/Hide the Full List | ||||
| The Studied Tissue | Lung | ||||
| The Specified Disease | Lung adenocarcinoma [ICD-11:2C25] | ||||
| The Expression Level of Disease Section Compare with the Healthy Individual Tissue | p-value:0.0009322384482154; Fold-change:1.0299607291495037; Z-score:1.325297347327242 | ||||
| DT expression in the diseased tissue of patients
DT expression in the normal tissue of healthy individuals
|
|||||
|
 Please Click the above Thumbnail to View/Download
the Expression Barchart for All Samples Please Click the above Thumbnail to View/Download
the Expression Barchart for All Samples
|
||||
| [+] ICD-11: 2C25.1 Small cell carcinoma of bronchus or lung | Click to Show/Hide the Full List | ||||
| The Studied Tissue | Lung | ||||
| The Specified Disease | Small cell lung carcinoma [ICD-11:2C25] | ||||
| The Expression Level of Disease Section Compare with the Healthy Individual Tissue | p-value:0.9988714606444062; Fold-change:0.6046511627906976; Z-score:0.0008098021313677 | ||||
| DT expression in the diseased tissue of patients
DT expression in the normal tissue of healthy individuals
|
|||||

|
 Please Click the above Thumbnail to View/Download
the Expression Barchart for All Samples Please Click the above Thumbnail to View/Download
the Expression Barchart for All Samples
|
||||
| [+] ICD-11: 2C31 Squamous cell carcinoma of skin | Click to Show/Hide the Full List | ||||
| The Studied Tissue | Skin | ||||
| The Specified Disease | Squamous cell carcinoma [ICD-11:2C31.Z] | ||||
| The Expression Level of Disease Section Compare with the Healthy Individual Tissue | p-value:0.0537173270711048; Fold-change:2.610169491525424; Z-score:8.415422928510095 | ||||
| DT expression in the diseased tissue of patients
DT expression in the normal tissue of healthy individuals
|
|||||

|
 Please Click the above Thumbnail to View/Download
the Expression Barchart for All Samples Please Click the above Thumbnail to View/Download
the Expression Barchart for All Samples
|
||||
| ICD-11: 05 Endocrine, nutritional or metabolic disease | |||||
| [+] ICD-11: 5A11 Type 2 diabetes mellitus | Click to Show/Hide the Full List | ||||
| The Studied Tissue | Islet of langerhans | ||||
| The Specified Disease | Type ii diabetes mellitus [ICD-11:5A11] | ||||
| The Expression Level of Disease Section Compare with the Healthy Individual Tissue | p-value:0.6671504544888951; Fold-change:0.896551724137931; Z-score:0.5273872651251388 | ||||
| DT expression in the diseased tissue of patients
DT expression in the normal tissue of healthy individuals
|
|||||

|
 Please Click the above Thumbnail to View/Download
the Expression Barchart for All Samples Please Click the above Thumbnail to View/Download
the Expression Barchart for All Samples
|
||||
| [+] ICD-11: 5A14 Diabetes mellitus, type unspecified | Click to Show/Hide the Full List | ||||
| The Studied Tissue | Skeletal muscle | ||||
| The Specified Disease | Diabetes mellitus [ICD-11:5A14] | ||||
| The Expression Level of Disease Section Compare with the Healthy Individual Tissue | p-value:0.1100574749381165; Fold-change:1.0968985644302898; Z-score:0.9561507126088192 | ||||
| DT expression in the diseased tissue of patients
DT expression in the normal tissue of healthy individuals
|
|||||
|
 Please Click the above Thumbnail to View/Download
the Expression Barchart for All Samples Please Click the above Thumbnail to View/Download
the Expression Barchart for All Samples
|
||||
| ICD-11: 06 Mental, behavioural or neurodevelopmental disorder | |||||
| [+] ICD-11: 6A02 Autism spectrum disorder | Click to Show/Hide the Full List | ||||
| The Studied Tissue | Brain | ||||
| The Specified Disease | Autism [ICD-11:6A02] | ||||
| The Expression Level of Disease Section Compare with the Healthy Individual Tissue | p-value:0.9308627853588108; Fold-change:0.6; Z-score:0.1550434182365105 | ||||
| DT expression in the diseased tissue of patients
DT expression in the normal tissue of healthy individuals
|
|||||

|
 Please Click the above Thumbnail to View/Download
the Expression Barchart for All Samples Please Click the above Thumbnail to View/Download
the Expression Barchart for All Samples
|
||||
| [+] ICD-11: 6A20 Schizophrenia | Click to Show/Hide the Full List | ||||
| The Studied Tissue | Brodmann (1909) area 9 | ||||
| The Specified Disease | Schizophrenia [ICD-11:6A20] | ||||
| The Expression Level of Disease Section Compare with the Healthy Individual Tissue | p-value:0.8217325903885135; Fold-change:0.75; Z-score:-0.110252399 | ||||
| DT expression in the diseased tissue of patients
DT expression in the normal tissue of healthy individuals
|
|||||
_area_9-1.png)
|
_area_9.png) Please Click the above Thumbnail to View/Download
the Expression Barchart for All Samples Please Click the above Thumbnail to View/Download
the Expression Barchart for All Samples
|
||||
| The Studied Tissue | Brodmann (1909) area 11 | ||||
| The Specified Disease | Schizophrenia [ICD-11:6A20] | ||||
| The Expression Level of Disease Section Compare with the Healthy Individual Tissue | p-value:0.2694619684997258; Fold-change:0.75; Z-score:-0.528485454 | ||||
| DT expression in the diseased tissue of patients
DT expression in the normal tissue of healthy individuals
|
|||||
_area_11-1.png)
|
_area_11.png) Please Click the above Thumbnail to View/Download
the Expression Barchart for All Samples Please Click the above Thumbnail to View/Download
the Expression Barchart for All Samples
|
||||
| The Studied Tissue | Brodmann (1909) area 24 | ||||
| The Specified Disease | Schizophrenia [ICD-11:6A20] | ||||
| The Expression Level of Disease Section Compare with the Healthy Individual Tissue | p-value:0.1393282297909321; Fold-change:1.3333333333333333; Z-score:0.996316746232607 | ||||
| DT expression in the diseased tissue of patients
DT expression in the normal tissue of healthy individuals
|
|||||
_area_24-1.png)
|
_area_24.png) Please Click the above Thumbnail to View/Download
the Expression Barchart for All Samples Please Click the above Thumbnail to View/Download
the Expression Barchart for All Samples
|
||||
| [+] ICD-11: 6A60 Bipolar type I disorder (Bipolar disorder) | Click to Show/Hide the Full List | ||||
| The Studied Tissue | Brodmann (1909) area 9 | ||||
| The Specified Disease | Bipolar disorder [ICD-11:6A60] | ||||
| The Expression Level of Disease Section Compare with the Healthy Individual Tissue | p-value:0.3084587374060289; Fold-change:0.5; Z-score:-0.414759026 | ||||
| DT expression in the diseased tissue of patients
DT expression in the normal tissue of healthy individuals
|
|||||
_area_9-1.png)
|
_area_9.png) Please Click the above Thumbnail to View/Download
the Expression Barchart for All Samples Please Click the above Thumbnail to View/Download
the Expression Barchart for All Samples
|
||||
| The Studied Tissue | Brodmann (1909) area 11 | ||||
| The Specified Disease | Bipolar disorder [ICD-11:6A60] | ||||
| The Expression Level of Disease Section Compare with the Healthy Individual Tissue | p-value:0.6718857703450168; Fold-change:0.625; Z-score:-0.284569091 | ||||
| DT expression in the diseased tissue of patients
DT expression in the normal tissue of healthy individuals
|
|||||
_area_11-1.png)
|
_area_11.png) Please Click the above Thumbnail to View/Download
the Expression Barchart for All Samples Please Click the above Thumbnail to View/Download
the Expression Barchart for All Samples
|
||||
| The Studied Tissue | Brodmann (1909) area 24 | ||||
| The Specified Disease | Bipolar disorder [ICD-11:6A60] | ||||
| The Expression Level of Disease Section Compare with the Healthy Individual Tissue | p-value:0.7287873534710099; Fold-change:1; Z-score:0.2530328244400271 | ||||
| DT expression in the diseased tissue of patients
DT expression in the normal tissue of healthy individuals
|
|||||
_area_24-1.png)
|
_area_24.png) Please Click the above Thumbnail to View/Download
the Expression Barchart for All Samples Please Click the above Thumbnail to View/Download
the Expression Barchart for All Samples
|
||||
| The Studied Tissue | Dorsolateral prefrontal cortex | ||||
| The Specified Disease | Bipolar disorder [ICD-11:6A60] | ||||
| The Expression Level of Disease Section Compare with the Healthy Individual Tissue | p-value:0.6522797977281019; Fold-change:1; Z-score:-0.103937614 | ||||
| DT expression in the diseased tissue of patients
DT expression in the normal tissue of healthy individuals
|
|||||

|
 Please Click the above Thumbnail to View/Download
the Expression Barchart for All Samples Please Click the above Thumbnail to View/Download
the Expression Barchart for All Samples
|
||||
| ICD-11: 08 Disease of the nervous system | |||||
| [+] ICD-11: 8A20 Alzheimer disease | Click to Show/Hide the Full List | ||||
| The Studied Tissue | Frontal cortex | ||||
| The Specified Disease | Alzheimer's disease [ICD-11:8A20] | ||||
| The Expression Level of Disease Section Compare with the Healthy Individual Tissue | p-value:0.9106513224635138; Fold-change:1.0047193632359308; Z-score:0.0331062291596088 | ||||
| DT expression in the diseased tissue of patients
DT expression in the normal tissue of healthy individuals
|
|||||

|
 Please Click the above Thumbnail to View/Download
the Expression Barchart for All Samples Please Click the above Thumbnail to View/Download
the Expression Barchart for All Samples
|
||||
| The Studied Tissue | Hippocampus | ||||
| The Specified Disease | Alzheimer's disease [ICD-11:8A20] | ||||
| The Expression Level of Disease Section Compare with the Healthy Individual Tissue | p-value:0.1592620029387139; Fold-change:1.041265479284657; Z-score:0.7295953289441814 | ||||
| DT expression in the diseased tissue of patients
DT expression in the normal tissue of healthy individuals
|
|||||
|
 Please Click the above Thumbnail to View/Download
the Expression Barchart for All Samples Please Click the above Thumbnail to View/Download
the Expression Barchart for All Samples
|
||||
| The Studied Tissue | Temporal cortex | ||||
| The Specified Disease | Alzheimer's disease [ICD-11:8A20] | ||||
| The Expression Level of Disease Section Compare with the Healthy Individual Tissue | p-value:0.1110564671780117; Fold-change:1.0212764619340522; Z-score:0.6060969672029427 | ||||
| DT expression in the diseased tissue of patients
DT expression in the normal tissue of healthy individuals
|
|||||

|
 Please Click the above Thumbnail to View/Download
the Expression Barchart for All Samples Please Click the above Thumbnail to View/Download
the Expression Barchart for All Samples
|
||||
| [+] ICD-11: 8C70.3 Facioscapulohumeral muscular dystrophy | Click to Show/Hide the Full List | ||||
| The Studied Tissue | Muscle | ||||
| The Specified Disease | Facioscapulohumeral dystrophy [ICD-11:8C70.3] | ||||
| The Expression Level of Disease Section Compare with the Healthy Individual Tissue | p-value:0.8521220768518118; Fold-change:1; Z-score:0.0779555633366931 | ||||
| DT expression in the diseased tissue of patients
DT expression in the normal tissue of healthy individuals
|
|||||

|
 Please Click the above Thumbnail to View/Download
the Expression Barchart for All Samples Please Click the above Thumbnail to View/Download
the Expression Barchart for All Samples
|
||||
| The Studied Tissue | Myoblast | ||||
| The Specified Disease | Facioscapulohumeral dystrophy [ICD-11:8C70.3] | ||||
| The Expression Level of Disease Section Compare with the Healthy Individual Tissue | p-value:0.7769726141792792; Fold-change:1.2; Z-score:0.164762745130846 | ||||
| DT expression in the diseased tissue of patients
DT expression in the normal tissue of healthy individuals
|
|||||

|
 Please Click the above Thumbnail to View/Download
the Expression Barchart for All Samples Please Click the above Thumbnail to View/Download
the Expression Barchart for All Samples
|
||||
| The Studied Tissue | Myotube | ||||
| The Specified Disease | Facioscapulohumeral dystrophy [ICD-11:8C70.3] | ||||
| The Expression Level of Disease Section Compare with the Healthy Individual Tissue | p-value:0.0950980241255497; Fold-change:2.8585858585858586; Z-score:5.9026562807570775 | ||||
| DT expression in the diseased tissue of patients
DT expression in the normal tissue of healthy individuals
|
|||||

|
 Please Click the above Thumbnail to View/Download
the Expression Barchart for All Samples Please Click the above Thumbnail to View/Download
the Expression Barchart for All Samples
|
||||
| [+] ICD-11: 8C71.0 Myotonic dystrophy | Click to Show/Hide the Full List | ||||
| The Studied Tissue | Heart left ventricle | ||||
| The Specified Disease | Myotonic dystrophy [ICD-11:8C71.0] | ||||
| The Expression Level of Disease Section Compare with the Healthy Individual Tissue | p-value:0.0343245536936313; Fold-change:1.6363636363636365; Z-score:2.7919297618084515 | ||||
| DT expression in the diseased tissue of patients
DT expression in the normal tissue of healthy individuals
|
|||||

|
 Please Click the above Thumbnail to View/Download
the Expression Barchart for All Samples Please Click the above Thumbnail to View/Download
the Expression Barchart for All Samples
|
||||
| ICD-11: 11 Disease of the circulatory system | |||||
| [+] ICD-11: BA8Z Diseases of coronary artery, unspecified (coronary artery disease) | Click to Show/Hide the Full List | ||||
| The Studied Tissue | Epicardial fat | ||||
| The Specified Disease | Coronary artery disease [ICD-11:BA8Z] | ||||
| The Expression Level of Disease Section Compare with the Healthy Individual Tissue | p-value:0.2221722982900444; Fold-change:1.0046096712913748; Z-score:0.4372864016830007 | ||||
| DT expression in the diseased tissue of patients
DT expression in the normal tissue of healthy individuals
|
|||||
|
 Please Click the above Thumbnail to View/Download
the Expression Barchart for All Samples Please Click the above Thumbnail to View/Download
the Expression Barchart for All Samples
|
||||
| The Studied Tissue | Subcutaneous adipose tissue | ||||
| The Specified Disease | Coronary artery disease [ICD-11:BA8Z] | ||||
| The Expression Level of Disease Section Compare with the Healthy Individual Tissue | p-value:0.1336350450182166; Fold-change:1.0217985441315212; Z-score:0.7027228618174989 | ||||
| DT expression in the diseased tissue of patients
DT expression in the normal tissue of healthy individuals
|
|||||

|
 Please Click the above Thumbnail to View/Download
the Expression Barchart for All Samples Please Click the above Thumbnail to View/Download
the Expression Barchart for All Samples
|
||||
| [+] ICD-11: BD10 Congestive heart failure | Click to Show/Hide the Full List | ||||
| The Studied Tissue | Skeletal muscle tissue | ||||
| The Specified Disease | Heart failure [ICD-11:BD10] | ||||
| The Expression Level of Disease Section Compare with the Healthy Individual Tissue | p-value:0.8504953715756298; Fold-change:1; Z-score:0.1443375672974065 | ||||
| DT expression in the diseased tissue of patients
DT expression in the normal tissue of healthy individuals
|
|||||

|
 Please Click the above Thumbnail to View/Download
the Expression Barchart for All Samples Please Click the above Thumbnail to View/Download
the Expression Barchart for All Samples
|
||||
| [+] ICD-11: BD10 Congestive heart failure (post-ischemic) | Click to Show/Hide the Full List | ||||
| The Studied Tissue | Left ventricle | ||||
| The Specified Disease | Post ischemic heart failure [ICD-11:BD10] | ||||
| The Expression Level of Disease Section Compare with the Healthy Individual Tissue | p-value:0.4067455062413529; Fold-change:0.9820689172690966; Z-score:-0.829215859 | ||||
| DT expression in the diseased tissue of patients
DT expression in the normal tissue of healthy individuals
|
|||||

|
 Please Click the above Thumbnail to View/Download
the Expression Barchart for All Samples Please Click the above Thumbnail to View/Download
the Expression Barchart for All Samples
|
||||
| ICD-11: 13 Disease of the digestive system | |||||
| [+] ICD-11: DD70 Crohn disease | Click to Show/Hide the Full List | ||||
| The Studied Tissue | Ileum | ||||
| The Specified Disease | Crohn's disease [ICD-11:DD70.Z] | ||||
| The Expression Level of Disease Section Compare with the Healthy Individual Tissue | p-value:0.5732870648800432; Fold-change:1; Z-score:-0.097622963 | ||||
| DT expression in the diseased tissue of patients
DT expression in the normal tissue of healthy individuals
|
|||||

|
 Please Click the above Thumbnail to View/Download
the Expression Barchart for All Samples Please Click the above Thumbnail to View/Download
the Expression Barchart for All Samples
|
||||
| The Studied Tissue | Colonic mucosa | ||||
| The Specified Disease | Crohn's disease [ICD-11:DD70.Z] | ||||
| The Expression Level of Disease Section Compare with the Healthy Individual Tissue | p-value:0.7768926291722752; Fold-change:1.0091141399517274; Z-score:0.1360409362386429 | ||||
| DT expression in the diseased tissue of patients
DT expression in the normal tissue of healthy individuals
|
|||||

|
 Please Click the above Thumbnail to View/Download
the Expression Barchart for All Samples Please Click the above Thumbnail to View/Download
the Expression Barchart for All Samples
|
||||
| The Studied Tissue | Ileal mucosa | ||||
| The Specified Disease | Crohn's disease [ICD-11:DD70.Z] | ||||
| The Expression Level of Disease Section Compare with the Healthy Individual Tissue | p-value:0.0038723857858328; Fold-change:0.9454336309771852; Z-score:-1.225580832 | ||||
| DT expression in the diseased tissue of patients
DT expression in the normal tissue of healthy individuals
|
|||||
|
 Please Click the above Thumbnail to View/Download
the Expression Barchart for All Samples Please Click the above Thumbnail to View/Download
the Expression Barchart for All Samples
|
||||
| [+] ICD-11: DD71 Ulcerative colitis | Click to Show/Hide the Full List | ||||
| The Studied Tissue | Caecum | ||||
| The Specified Disease | Active ulcerative colitis [ICD-11:DD71.Z] | ||||
| The Expression Level of Disease Section Compare with the Healthy Individual Tissue | p-value:0.0517833963468523; Fold-change:1.0435612608790632; Z-score:1.4062196303700425 | ||||
| DT expression in the diseased tissue of patients
DT expression in the normal tissue of healthy individuals
|
|||||

|
 Please Click the above Thumbnail to View/Download
the Expression Barchart for All Samples Please Click the above Thumbnail to View/Download
the Expression Barchart for All Samples
|
||||
| The Studied Tissue | Left colon | ||||
| The Specified Disease | Active ulcerative colitis [ICD-11:DD71.Z] | ||||
| The Expression Level of Disease Section Compare with the Healthy Individual Tissue | p-value:0.1300336820983633; Fold-change:1.0710948594359957; Z-score:1.140249664690858 | ||||
| DT expression in the diseased tissue of patients
DT expression in the normal tissue of healthy individuals
|
|||||

|
 Please Click the above Thumbnail to View/Download
the Expression Barchart for All Samples Please Click the above Thumbnail to View/Download
the Expression Barchart for All Samples
|
||||
| The Studied Tissue | Rectum | ||||
| The Specified Disease | Active ulcerative colitis [ICD-11:DD71.Z] | ||||
| The Expression Level of Disease Section Compare with the Healthy Individual Tissue | p-value:0.4784218163123657; Fold-change:1.0185161996606853; Z-score:0.5457056829583287 | ||||
| DT expression in the diseased tissue of patients
DT expression in the normal tissue of healthy individuals
|
|||||

|
 Please Click the above Thumbnail to View/Download
the Expression Barchart for All Samples Please Click the above Thumbnail to View/Download
the Expression Barchart for All Samples
|
||||
| The Studied Tissue | Transverse colon | ||||
| The Specified Disease | Active ulcerative colitis [ICD-11:DD71.Z] | ||||
| The Expression Level of Disease Section Compare with the Healthy Individual Tissue | p-value:0.0613947900113584; Fold-change:1.0618861167860685; Z-score:1.9900172830890688 | ||||
| DT expression in the diseased tissue of patients
DT expression in the normal tissue of healthy individuals
|
|||||
|
|
|
||||
| ICD-11: 14 Disease of the skin | |||||
| [+] ICD-11: EA91 Lichen planus (oral mucosal involvement) | Click to Show/Hide the Full List | ||||
| The Studied Tissue | Mouth mucosa | ||||
| The Specified Disease | Oral lichen planus [ICD-11:EA91.42] | ||||
| The Expression Level of Disease Section Compare with the Healthy Individual Tissue | p-value:0.2012422788481557; Fold-change:1.024759357260723; Z-score:0.6220316710383231 | ||||
| DT expression in the diseased tissue of patients
DT expression in the normal tissue of healthy individuals
|
|||||

|
 Please Click the above Thumbnail to View/Download
the Expression Barchart for All Samples Please Click the above Thumbnail to View/Download
the Expression Barchart for All Samples
|
||||
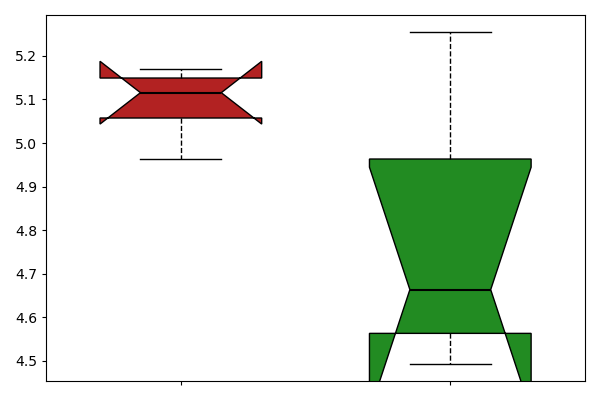
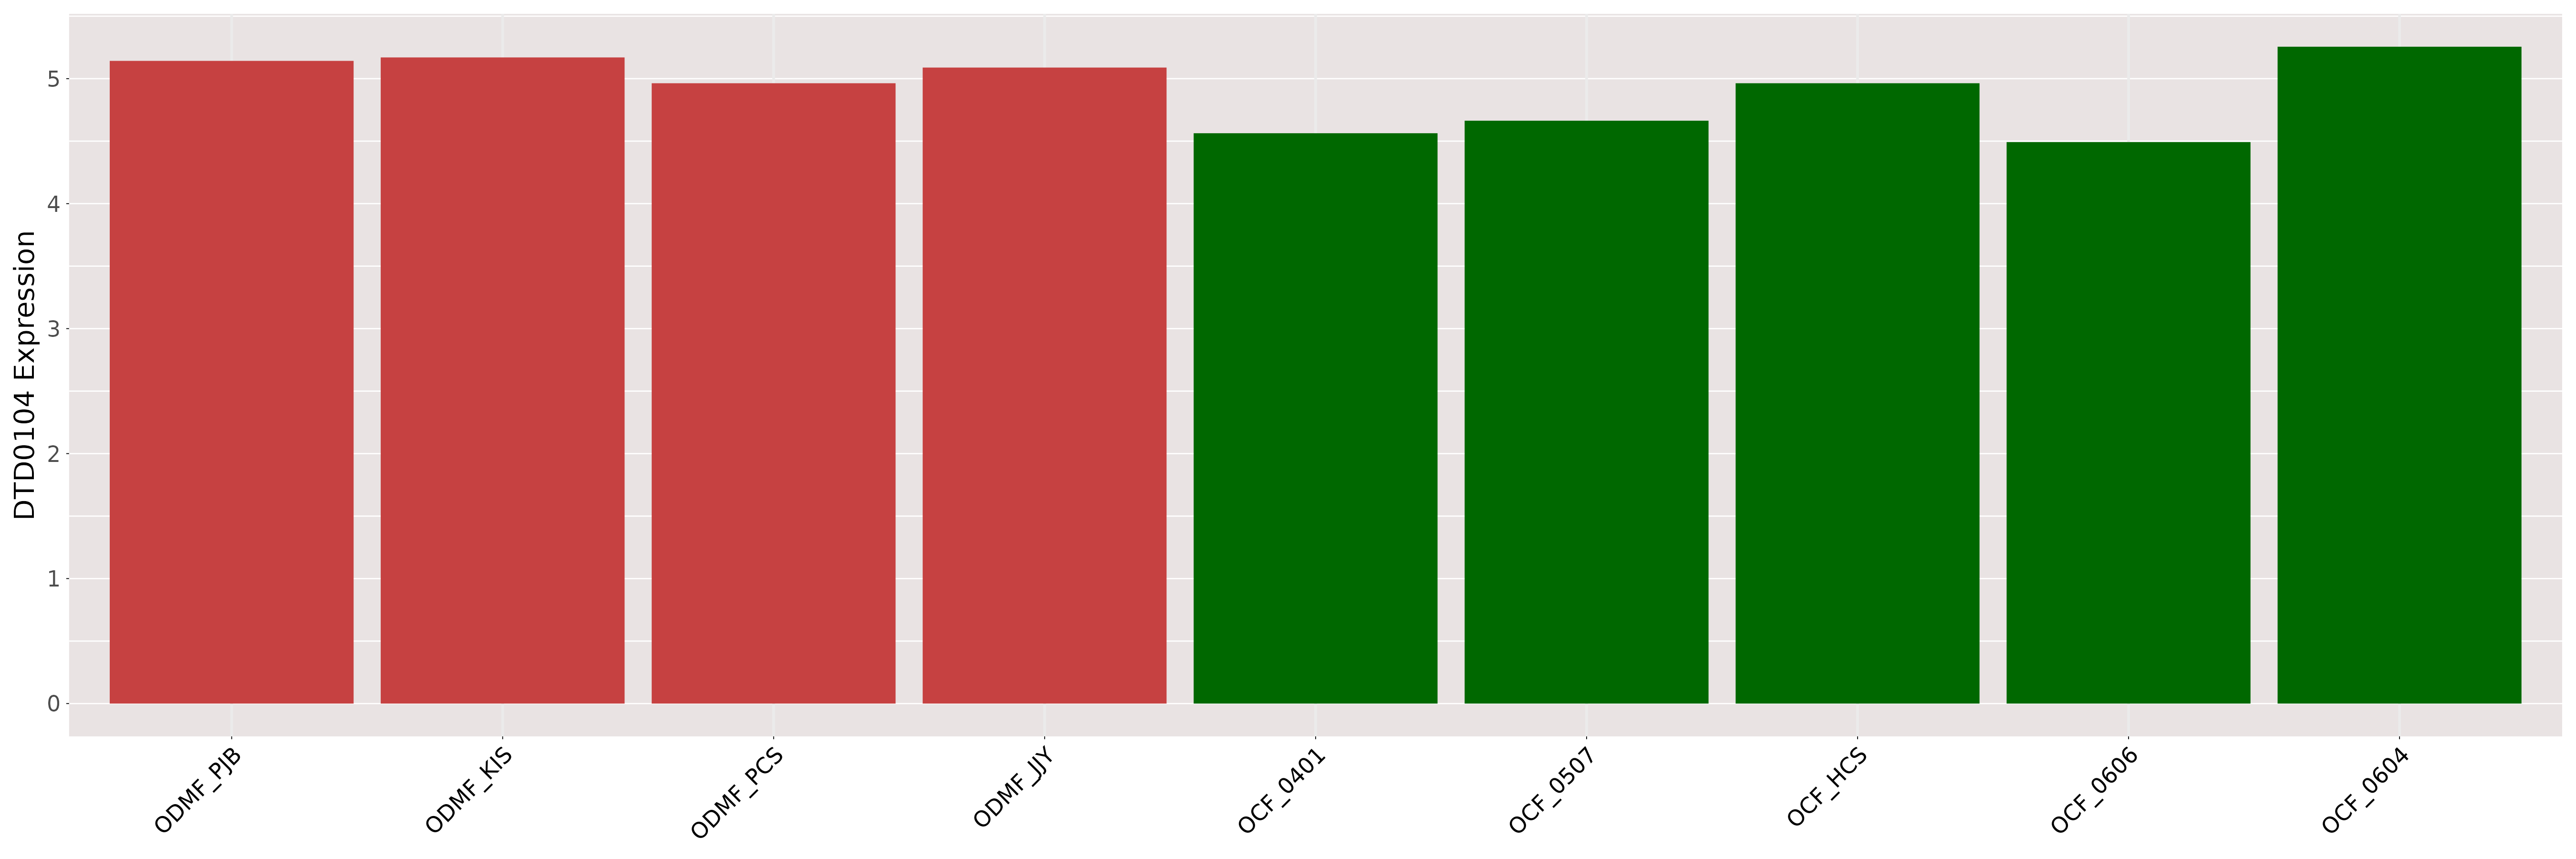
| [+] ICD-11: EK90.0 Actinic keratosis | Click to Show/Hide the Full List | ||||
| The Studied Tissue | Skin | ||||
| The Specified Disease | Actinic keratosis [ICD-11:EK90.0] | ||||
| The Expression Level of Disease Section Compare with the Healthy Individual Tissue | p-value:0.028271823356682; Fold-change:2.067796610169492; Z-score:10.426449415135702 | ||||
| DT expression in the diseased tissue of patients
DT expression in the normal tissue of healthy individuals
|
|||||
|
 Please Click the above Thumbnail to View/Download
the Expression Barchart for All Samples Please Click the above Thumbnail to View/Download
the Expression Barchart for All Samples
|
||||
| ICD-11: 15 Disease of the musculoskeletal system/connective tissue | |||||
| [+] ICD-11: FA0Z Osteoarthritis, unspecified site | Click to Show/Hide the Full List | ||||
| The Studied Tissue | Bone | ||||
| The Specified Disease | Osteoarthritis [ICD-11:FA0Z] | ||||
| The Expression Level of Disease Section Compare with the Healthy Individual Tissue | p-value:0.0001301946650949; Fold-change:0.943982948957559; Z-score:-1.706449222 | ||||
| DT expression in the diseased tissue of patients
DT expression in the normal tissue of healthy individuals
|
|||||

|
 Please Click the above Thumbnail to View/Download
the Expression Barchart for All Samples Please Click the above Thumbnail to View/Download
the Expression Barchart for All Samples
|
||||
| ICD-11: 20 Developmental anomaly | |||||
| [+] ICD-11: LA88.2 Tetralogy of Fallot | Click to Show/Hide the Full List | ||||
| The Studied Tissue | Heart ventricle | ||||
| The Specified Disease | Tetralogy of fallot [ICD-11:LA88.2] | ||||
| The Expression Level of Disease Section Compare with the Healthy Individual Tissue | p-value:0.0040520179969633; Fold-change:0.5588235294117647; Z-score:-1.037290104 | ||||
| DT expression in the diseased tissue of patients
DT expression in the normal tissue of healthy individuals
|
|||||

|
 Please Click the above Thumbnail to View/Download
the Expression Barchart for All Samples Please Click the above Thumbnail to View/Download
the Expression Barchart for All Samples
|
||||
| [+] ICD-11: LB70.00 Unicoronal craniosynostosis | Click to Show/Hide the Full List | ||||
| The Studied Tissue | Skull | ||||
| The Specified Disease | Coronal craniosynostosis [ICD-11:LB70.00] | ||||
| The Expression Level of Disease Section Compare with the Healthy Individual Tissue | p-value:0.1807633499546857; Fold-change:1.453125; Z-score:2.030258904551879 | ||||
| DT expression in the diseased tissue of patients
DT expression in the normal tissue of healthy individuals
|
|||||

|
 Please Click the above Thumbnail to View/Download
the Expression Barchart for All Samples Please Click the above Thumbnail to View/Download
the Expression Barchart for All Samples
|
||||
| [+] ICD-11: LB70.02 Lambdoid craniosynostosis | Click to Show/Hide the Full List | ||||
| The Studied Tissue | Skull | ||||
| The Specified Disease | Lambdoid craniosynostosis [ICD-11:LB70.3] | ||||
| The Expression Level of Disease Section Compare with the Healthy Individual Tissue | p-value:0.3567381440382441; Fold-change:1.03125; Z-score:5.127705182009232 | ||||
| DT expression in the diseased tissue of patients
DT expression in the normal tissue of healthy individuals
|
|||||

|
 Please Click the above Thumbnail to View/Download
the Expression Barchart for All Samples Please Click the above Thumbnail to View/Download
the Expression Barchart for All Samples
|
||||
| [+] ICD-11: LB70.03 Metopic craniosynostosis | Click to Show/Hide the Full List | ||||
| The Studied Tissue | Skull | ||||
| The Specified Disease | Metopic craniosynostosis [ICD-11:LB70.2] | ||||
| The Expression Level of Disease Section Compare with the Healthy Individual Tissue | p-value:0.99035508739186; Fold-change:1; Z-score:-0.011155269 | ||||
| DT expression in the diseased tissue of patients
DT expression in the normal tissue of healthy individuals
|
|||||

|
 Please Click the above Thumbnail to View/Download
the Expression Barchart for All Samples Please Click the above Thumbnail to View/Download
the Expression Barchart for All Samples
|
||||
| [+] ICD-11: LB70.0Y Sagittal craniosynostosis | Click to Show/Hide the Full List | ||||
| The Studied Tissue | Skull | ||||
| The Specified Disease | Sagittal craniosynostosis [ICD-11:LB70.1] | ||||
| The Expression Level of Disease Section Compare with the Healthy Individual Tissue | p-value:0.1170401409083991; Fold-change:1.40625; Z-score:1.764763509341248 | ||||
| DT expression in the diseased tissue of patients
DT expression in the normal tissue of healthy individuals
|
|||||

|
 Please Click the above Thumbnail to View/Download
the Expression Barchart for All Samples Please Click the above Thumbnail to View/Download
the Expression Barchart for All Samples
|
||||
| [+] ICD-11: LC02 Sebaceous naevus (nevus sebaceus of Jadassohn) | Click to Show/Hide the Full List | ||||
| The Studied Tissue | Skin | ||||
| The Specified Disease | Sebaceous of jadassohn nevus [ICD-11:LD2D.Y] | ||||
| The Expression Level of Disease Section Compare with the Healthy Individual Tissue | p-value:0.0537173270711048; Fold-change:2.610169491525424; Z-score:8.415422928510095 | ||||
| DT expression in the diseased tissue of patients
DT expression in the normal tissue of healthy individuals
|
|||||

|
 Please Click the above Thumbnail to View/Download
the Expression Barchart for All Samples Please Click the above Thumbnail to View/Download
the Expression Barchart for All Samples
|
||||
| ICD-11: 25 Codes for special purposes | |||||
| [+] ICD-11: RA01 COVID-19 | Click to Show/Hide the Full List | ||||
| The Studied Tissue | Lung | ||||
| The Specified Disease | Covid [ICD-11:RA01.0] | ||||
| The Expression Level of Disease Section Compare with the Healthy Individual Tissue | p-value:0.4107843407339748; Fold-change:0.4166666666666667; Z-score:-0.432933822 | ||||
| DT expression in the diseased tissue of patients
DT expression in the normal tissue of healthy individuals
|
|||||

|
 Please Click the above Thumbnail to View/Download
the Expression Barchart for All Samples Please Click the above Thumbnail to View/Download
the Expression Barchart for All Samples
|
||||
| The Studied Tissue | Colon | ||||
| The Specified Disease | Covid [ICD-11:RA01.0] | ||||
| The Expression Level of Disease Section Compare with the Healthy Individual Tissue | p-value:0.0306151858131486; Fold-change:0.2285714285714285; Z-score:-1.053980062 | ||||
| DT expression in the diseased tissue of patients
DT expression in the normal tissue of healthy individuals
|
|||||

|
 Please Click the above Thumbnail to View/Download
the Expression Barchart for All Samples Please Click the above Thumbnail to View/Download
the Expression Barchart for All Samples
|
||||
If you find any error in data or bug in web service, please kindly report it to Dr. Li and Dr. Fu.